Epidemiology as a Framework for Large-Scale
Mobile Application Accessibility Assessment
Anne Spencer Ross
1
, Xiaoyi Zhang
1
, James Fogarty
1
, Jacob O. Wobbrock
2
1
Computer Science & Engineering,
2
The Information School
DUB Group, University of Washington Seattle, WA 98195 USA
{ansross, xiaoyiz, jfogarty}@cs.washington.edu, [email protected]
ABSTRACT
Mobile accessibility is often a property considered at the level of a
single mobile application (app), but rarely on a larger scale of the
entire app “ecosystem,” such as all apps in an app store, their
companies, developers, and user influences. We present a novel
conceptual framework for the accessibility of mobile apps inspired
by epidemiology. It considers apps within their ecosystems, over
time, and at a population level. Under this metaphor, “inaccessibility”
is a set of diseases that can be viewed through an epidemiological
lens. Accordingly, our framework puts forth notions like risk and
protective factors, prevalence, and health indicators found within a
population of apps. This new framing offers terminology, motivation,
and techniques to reframe how we approach and measure app
accessibility. It establishes how app accessibility can benefit from
multi-factor, longitudinal, and population-based analyses. Our
epidemiology-inspired conceptual framework is the main contribution
of this work, intended to provoke thought and inspire new work
enhancing app accessibility at a systemic level. In a preliminary
exercising of our framework, we perform an analysis of the
prevalence of common determinants or accessibility barriers. We
assess the health of a stratified sample of 100 popular Android apps
using Google’s Accessibility Scanner. We find that 100% of apps
have at least one of nine accessibility errors and examine which
errors are most common. A preliminary analysis of the frequency
of co-occurrences of multiple errors in a single app is also
presented. We find 72% of apps have five or six errors, suggesting
an interaction among different errors or an underlying influence.
CCS Concepts
• Human-Centered Computing➝Accessibility➝Accessibility
Theory, Concepts and Paradigms
Keywords
Mobile computing; mobile accessibility; app accessibility;
accessibility assessment; conceptual framework; epidemiology.
1. INTRODUCTION
Mobile applications (apps) play increasingly important roles in
many aspects of life, including personal finances, communication,
community engagement, and transportation. Supporting access to
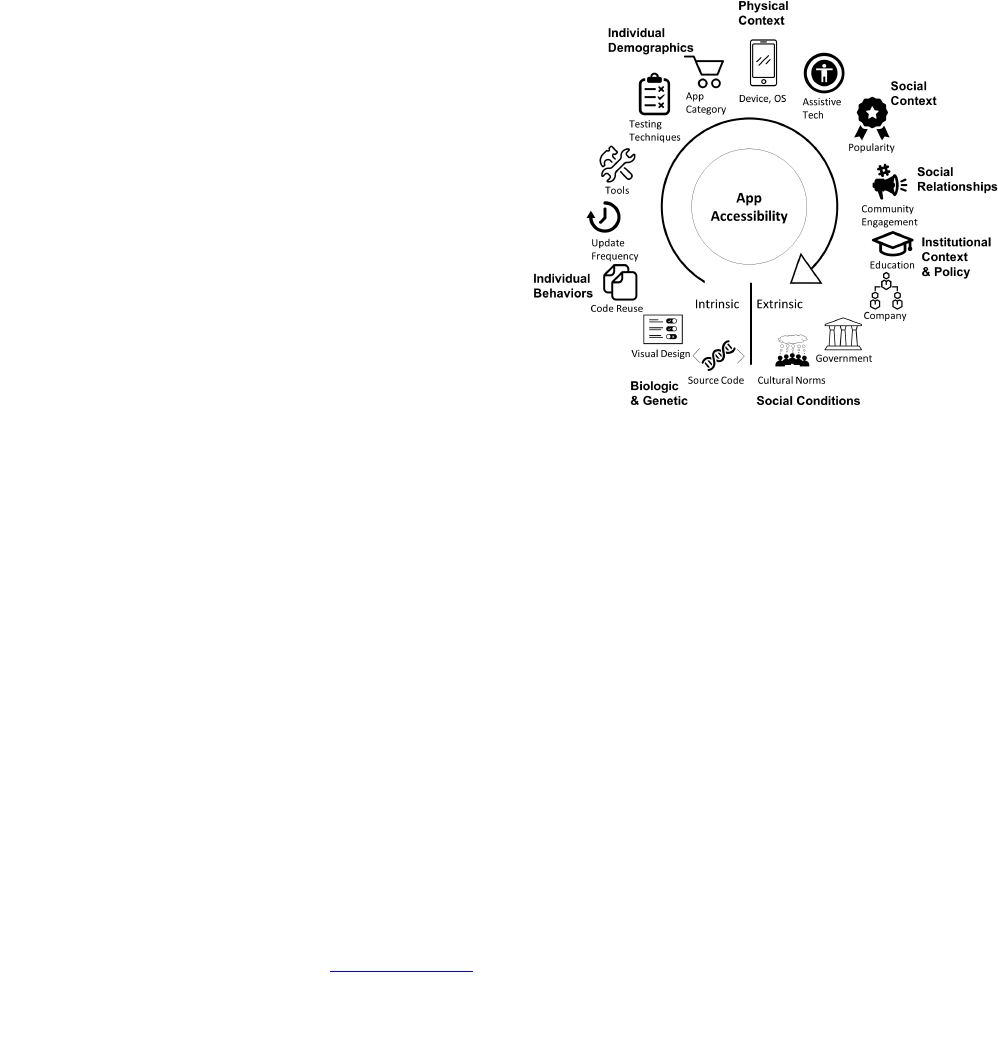
Figure 1. As a systems science, epidemiology can serve as a
metaphor that changes the way we think and work with mobile app
accessibility. Here, the concept of a multi-factor ecosystem from
epidemiology has been applied to mobile app accessibility. An app’s
accessibility is a product of many factors ranging from individual and
intrinsic to population-level and extrinsic. These factors include:
source code and design, behaviors, demographics, physical context,
social context and relationships, institutional context and policies,
and cultural norms. Accessibility is affected by factors at all levels.
Figure inspired by [34].
these impactful technologies for all people is important. Yet, for the
approximately 15% of the world population with disabilities [35],
many of these apps are inaccessible. Understanding the extent and
causes of app inaccessibility is imperative for creating successful
solutions. To date, most approaches to understanding and improving
app accessibility have focused on specific issues within individual
apps, such as developer guidelines [1,4], app scanners [5,19], and
compiler warnings [2]. But apps do not exist in isolation. They
might come from the same developers or studios, utilize the same
libraries or code repositories, mimic the same popular design
patterns, or simply be subsequent versions of prior releases. These
factors can perpetuate accessibility problems, but the factors are
rarely, if ever, analyzed at a “multi-factor” or “population level”
over myriad apps. Expanding how we approach app accessibility to
encompass the rich ecosystem in which apps exist can drive
innovations in how we work to enhance accessibility. Fortunately,
other areas of study provide a model for multi-factor population-level
analyses. One such area is epidemiology, which examines health on
a population level from a systems perspective. Whereas a physician
treats a single patient, an epidemiologist considers the health of a
whole population of patients. Analogously, a designer or developer
Permission to make digital or hard copies of all or part of this work for
personal or classroom use is granted without fee provided that copies are
not made or distributed for profit or commercial advantage and that copies
bear this notice and the full citation on the first page. Copyrights for
components of this work owned by others than the author(s) must be
honored. Abstracting with credit is permitted. To copy otherwise, or
republish, to post on servers or to redistribute to lists, requires prior specific
permission and/or a fee. Request permissions from [email protected]g.
ASSETS '17, October 29-November 1, 2017, Baltimore, MD, USA © 2017
Copyright is held by the owner/author(s). Publication rights licensed to ACM.
ACM 978-1-4503-4926-0/17/10...$15.00
https://doi.org/10.1145/3132525.3132547
Session: Interaction Techniques and Frameworks
ASSETS'17, Oct. 29–Nov. 1, 2017, Baltimore, MD, USA
2
might address the inaccessibility of an individual app, but a
population perspective on app accessibility might reveal the causes of
systemic problems and suggest potential solutions. An example
would be discovering that a widely-used interface toolkit was
responsible for inaccessible widgets used in many apps.
We propose an epidemiology-inspired framework for the examination
of mobile app accessibility. We emphasize that this metaphor
supports the social model of disability [29]. App accessibility is a
community responsibility, as captured by our multi-factor framing
(see Figure 1) that guides how different parts of the community can
contribute to app accessibility. As more companies invest resources
into accessibility and more researchers investigate app accessibility,
it becomes increasingly beneficial to have a conceptual framework
from which to guide thought and action. Conceptual frameworks
(e.g., [7]) give a common vocabulary to ground discussion, guide
efforts to improve accessibility with known strategies, and
illuminate opportunities not previously considered. We acknowledge
that the concepts in our framework are numerous, but we believe
that this is indicative of the richness of the framework and of its
potential to inspire and inform thought and action.
Adapting a model from epidemiology [34], Figure 1 illustrates
many factors that act upon an app during its creation, distribution,
maintenance, and usage. These factors range from intrinsic factors
that are tightly encapsulated within each individual app to extrinsic
factors that indirectly but influentially affect app populations.
Example factors, listed from intrinsic to extrinsic, include source
code, visual design, development and testing tools, operating
systems, assistive technologies used, app popularity, company and
government policies, and public opinions. As this framing
exemplifies, apps do not exist independently of one another or of
their environments. A natural extension is to recognize that neither
do their accessibility strengths or weaknesses. Understanding how
these factors interact and influence the accessibility of apps over
time can help in improving app accessibility through development
of preventative measures and post-release repairs [37].
Developing an understanding of how a variety of factors contribute
to app accessibility requires recognizing the value of varying levels
of analysis, from individual entities to populations at specific
moments and over time. Many well-established scientific disciplines
have benefitted from longitudinal population-level analyses, such
as ecology [33], oceanography [22], and computer security [9]. As
stated, we chose epidemiology [20] as our metaphor for our app
accessibility framework. We construct our epidemiology-inspired
framework and, although no metaphor is perfect or without limitations,
we advance the claim that the study of app accessibility can benefit
from epidemiology’s well-developed language and approach to
collecting, analyzing, and acting upon longitudinal multi-factor
population-based data. To the best of our knowledge, ours is the
first attempt to frame app accessibility as a “population science.”
To put our conceptual framework through its paces, we apply it in
an analysis of accessibility barriers in popular Android apps
available on the Google Play Store. We analyze a sample of 100
apps for nine determinants, or causes, of a variety of
“inaccessibility diseases” using Google’s Accessibility Scanner
[19]. We present the prevalence of different determinants,
motivated by the objective of “Determining the Extent of the
Disease” in the population (see Section 4.2). We then reflect on
how our framework and preliminary data informs future work.
Our research contributions are twofold:
• A novel conceptual framework for monitoring, analyzing, and
acting upon longitudinal multi-factor large-scale data on mobile
app accessibility. Our framework highlights wide-ranging
intrinsic and extrinsic factors that influence app accessibility,
motivates the collection and analysis of large-scale data, and
guides opportunities for enhancing treatments for app
“diseases” of inaccessibility.
• Empirical results from a framework-guided analysis of a
stratified sample of 100 apps from the Google Play Store.
Motivated to determine the extent of the disease in the
population, we found high prevalence with 100% of apps
having an “inaccessibility disease” based on the nine
determinants scanned for.
2. REAL-WORLD EXAMPLES
We present two real-world examples of population-level factors
that influence app accessibility and how they fit into the
epidemiology-inspired framework. The examples present elements
that are infectious agents that carry inaccessibility within Android
Studio [2] and Android’s Floating Action Button design tutorial
[17]. These examples both exemplify how factors apart from
developer-written source code affect the likelihood of an
accessibility barrier.
2.1 Android Studio App Designer
Android Studio is the development environment released by
Google for creating Android apps and is one of the most popular
tools for Android developers. Due to its widespread use, the
accessibility of the Android features it provides has a large impact
on the accessibility of the whole population of Android apps.
Android Studio includes a drag-and-drop WYSIWYG Layout Editor.
The editor provides basic widgets including Image Buttons for
common functionality, such as a star icon for “favoriting.” When
an icon button is dragged onto an interface, Android Studio
generates the layout code in a separate file that defines the button,
its layout size, and other basic features. A notable omission within
the generated code is the Content Description, the field a screen
reader uses to describe an icon button. If that field is not manually
added by the developer, the app will have an inaccessible button for
people using a screen reader. As an approach to addressing this,
when the content description field is non-existent or has no content,
Android Studio will issue a warning that provides options to:
(1) guide the developer to add the field, or (2) set a flag to ignore
all warnings of that type.
This example illustrates the transmission of an inaccessible button
disease from an infectious agent, the icon button, to a host app. The
determinant, or cause of the disease, is the missing content
description. Our epidemiology-inspired framework then motivates an
in-depth analysis to evaluate the existing preventative treatment of
the warning to determine if it is sufficient at preventing the spread
of the disease.
2.2 Android Floating Action Button Design
Floating action buttons are a part of Google’s Material Design for
Android, a guide for a more unified design in Android apps [24].
Floating action buttons are already being adopted in popular apps
such as Skype, Gmail, Facebook Messenger, and Dropbox. Floating
action buttons, however, are potential infectious agents carrying
inaccessibility. These buttons are typically separate from standard
menu bars, “floating” in a visually prominent location, such as in
the bottom-right corner of the screen, highlighting the most
important action. Android provides design guidelines for how to
employ these buttons in interfaces, including outlining how the
buttons should look, act, animate, and function. Such buttons might
become accessibility barriers to people who are blind or have a
Session: Interaction Techniques and Frameworks
ASSETS'17, Oct. 29–Nov. 1, 2017, Baltimore, MD, USA
3
motor impairment because they are not anchored to traditional
menus, making their location in the linear navigation order
unexpected or inconvenient. Switches and linear screen reader
navigation are examples of assistive technologies that depend on
linear navigation orderings. Floating action buttons might also
cause other accessibility barriers with explore-by-touch screen
readers because the design guidelines recommend that floating
action buttons animate, move, or switch functionality with changes
in app state, which might be difficult to track non-visually.
This example illustrates transmission of a second inaccessible button
disease from an infectious agent, the floating action button design, to
a host app. One determinant of the disease is the lack of intuitive
integration of the button into linear navigation order. Another
determinant is the lack of feedback for floating action button state
transitions. This infectious agent lives in the repository of Google’s
Material Design.
3. RELATED WORK
We see two major strands of related work, that of mobile app
accessibility and that of population-level or large-scale analyses of
the web for accessibility or of apps for other purposes. We address
both in the subsections that follow.
3.1 Mobile App Accessibility
There is limited work assessing the accessibility of mobile apps.
Milne et al. [25] investigated nine mobile health apps on Apple iOS
for adherence to seven accessibility features and found that all of
the apps had at least one feature missing. Moreover, many of the
barriers were not covered in Apple’s accessibility guidelines, which
focus primarily on individual elements versus interactions between
elements. This study fits into our conceptual framework by looking
at prevalence of inaccessibility, although on a small scale. It also fits
the objective of assessing existing treatments (i.e., the guidelines).
Yu et al. [36] assessed the interface and navigation accessibility of
six mobile health apps through user tests with six people with spina
bifida. They identified many enhancements that would increase the
app’s accessibility. These studies begin to establish the lethality, or
severity, and prevalence of accessibility barriers. They also fit the
objective of inspiring new treatments. Our framework would also
motivate the collection of data needed to assess if the new
enhancements were effective.
To guide developers in enhancing app accessibility, Google [1] and
Apple [4] have mobile accessibility guidelines. W3C also issued a
note on how to apply existing web accessibility guidelines to
mobile devices [15]. Studies analyzing the success of web guidelines
suggest that guidelines are not sufficient for ensuring accessibility,
due to a number of factors that include lack of developer knowledge,
difficult to implement recommendations, difficulties testing for
adherence, or the mismatch between actual user concerns and
guideline recommendations [13,23,26]. Google’s Accessibility
Scanner [19] and Apple’s Accessibility Inspector [5] are tools for app
accessibility analysis. Both tools run on an app interface, screen by
screen, and return an analysis flagging common accessibility
barriers such as buttons that are too small, images lacking text
descriptions, and elements with problematic color contrast. These
tools can only be applied to a single app at a time and must be guided
interactively. Our framework motivates the development of
advancements in analysis tools to allow for larger-scale analyses with
more detail on accessibility problems.
3.2 Large-Scale Analyses
Large-scale app analyses have been conducted to understand the
effectiveness of web accessibility guidelines, vulnerabilities in
apps, app usage patterns, and popular designs. This prior work
demonstrates insights that can be gained from such analyses and
provides further motivation for designing and leveraging
population-level analyses for app accessibility.
How well the existing guidelines and tools work to address
accessibility is largely under-studied. Hanson and Richards [21]
performed a longitudinal study of changes in web accessibility on
over 100 websites over 14 years. They concluded that government
websites tended to be more accessible than non-government sites
and that accessibility overall was getting better, but most sites still
failed on at least one simple accessibility feature.
Richards, Montague, and Hanson [30] further investigated potential
indirect factors influencing accessibility, including changes in
coding practices, devices, browser capabilities, and the importance
of page rank. They concluded these indirect factors might account
for some increase in web accessibility and discussed the potential of
considering indirect accessibility when developing new technology.
Bigham et al. [8] studied web accessibility by analyzing differences
between sighted and blind people’s browsing behaviors.
Participants used a web proxy to perform their normal web
browsing in their home on their own equipment over the course of
a week. The data collected was analyzed for statistical differences
between sighted and blind people’s browsing experience using
metrics such as number of websites visited that had images with alt
text, number of interactions with dynamic content, and timing spent
on common tasks. They used the differences in these metrics as a
measure of the frequency of accessibility barriers on the web and
how those impact browsing experiences.
These works exemplify the types of insights that can be gained
through large-scale and longitudinal studies. Creating techniques
that allow for such studies of mobile apps could allow similar
insights into how successful existing interventions are, into
potentially impactful unconsidered influences, and into opportunities
for improvement. Our epidemiology-inspired framework helps to
structure our approach to creating those techniques.
Large-scale analyses of app usage can reveal patterns in terms of
duration, app category, and context (e.g., time of day, location)
[10,27]. The results of these studies aim to inform app design [27]
or to provide a basis for an app recommendation system [10]. These
types of analyses have yet to be applied with a focus on mobile
accessibility, but could be insightful. For example, analogous to
prior analysis of web accessibility [8], the difference in time spent
in communication apps between those who use a screen reader and
those who do not could suggest an accessibility barrier.
Population-level analyses have also been used to explore interactions
between apps and more extrinsic factors through analyzing code
reuse [28], design reuse [16], and widget and layout popularity [31].
For example, Mojica et al.’s [28] insights support the
interdependence of apps by highlighting the prominence of code
reuse. The ERICA project [16] similarly analyzed interface designs
and user traces with the aim of informing future designers. App
interdependence is a key component of our epidemiology-inspired
framework, and motivates extending analyses to include the impact
of such code reuse and popular design patterns on accessibility.
Computer security also has a long history of using large-scale
studies to understand the prevalence of security vulnerabilities,
their sources, and how they spread. In work that is perhaps most
similar to ours, Gil et. al. [18] propose a “genetic epidemiology
approach to cyber-security” using large-scale automated analyses
to create tools to determine the probability of a network being
susceptible to a threat. The authors focus on computer networks and
genetic mutation detection concepts from genetic epidemiology. By
Session: Interaction Techniques and Frameworks
ASSETS'17, Oct. 29–Nov. 1, 2017, Baltimore, MD, USA
4
contrast, we create a broader framework utilizing many more concepts
from general epidemiology applied to mobile app accessibility.
4. EPIDEMIOLOGY FRAMEWORK
Epidemiology regards human health as holistic physical, emotional,
and social well-being, not just the absence of illness. Epidemiology
acknowledges that an individual’s health cannot be understood in
isolation and is instead the product of continuous interaction with
environmental and social factors [11]. We utilize key terminology,
concepts, and techniques from epidemiology to frame mobile app
accessibility in a similarly holistic fashion. A healthy app is one
whose essential functionality is accessible and usable to all, not just
an app that has no rudimentary accessibility errors. Our framework
defines a single app as a potential host of one or more diseases of
inaccessibility. A population consists of a large group of apps, such
as: all apps in existence, all Android apps, all apps that use the
Google Map library, or all shopping apps.
Inspired by epidemiological concepts and the five objectives of
epidemiology presented by Gordis [20], we offer a conceptual
framework to guide the thoughts and actions of researchers and
developers concerning app accessibility. We present the terminology
for this framework in Tables 1a-d, showing the analogies drawn
between epidemiology and app accessibility, with examples.
4.1 Identify Factors and Causation
Addressing a disease requires understanding what causes it and
what factors make the entity more (risk factor) or less (protective
factor) likely to contract it. The same is true for various
“inaccessibility diseases” that arise in apps. By understanding
where diseases come from, how they spread, and what factors affect
an app’s risk, we can better guide the development of treatments.
We define a factor as characteristics of an app, or of the ecosystem
in which an app is developed, maintained, and used, that impact the
likelihood of an app having an inaccessibility disease. There are
risk factors that increase the likelihood of disease and protective
factors that reduce the likelihood. Figure 1 presents a structure for
understanding the many factors within the ecosystem that impact
accessibility. Much of the language and structure of the framing are
inspired from the “model for analysis of population health and
health disparities” presented in epidemiology [34].
Epidemiological elements move from intrinsic to extrinsic factors.
Intrinsic factors include the core of an individual app. At the other
end of the spectrum are highly extrinsic factors, or those that impact
many apps in a manner that is removed from their source code.
Starting at the intrinsic end of the spectrum (see Figure 1), there are
the metaphorical biological and genetic factors (i.e. an app’s source
code and design). Progressing toward extrinsic factors, the
spectrum continues into factors that directly impact the biological
characteristics. These factors include individual behavior such as
code reuse through libraries, copying from repositories or tutorials,
frequency of updates, testing techniques, and tools used. Factors
such as tools, testing, and code provenance not only reflect what
app building strategies are used but also the trust in those strategies.
Having high trust in a tool might reduce developer sense of
responsibility for investigating accessibility barriers. Individual
demographics are closely tied to these factors. These include app
age and category (e.g., travel, shopping, entertainment). The next
section of the spectrum is more extrinsic than intrinsic. Within
physical context, there is the device upon which the app is running,
the OS and OS version, and any accessibility software or hardware
being used. These elements have fewer direct interactions with the
app’s biological and genetic factors. Yet physical context can
impact an app’s accessibility based on how the source code and
physical context interact and support one another. For example,
different versions of a screen reader might interact differently with
app source code, resulting in different levels of accessibility within
the same app, dependent on physical context.
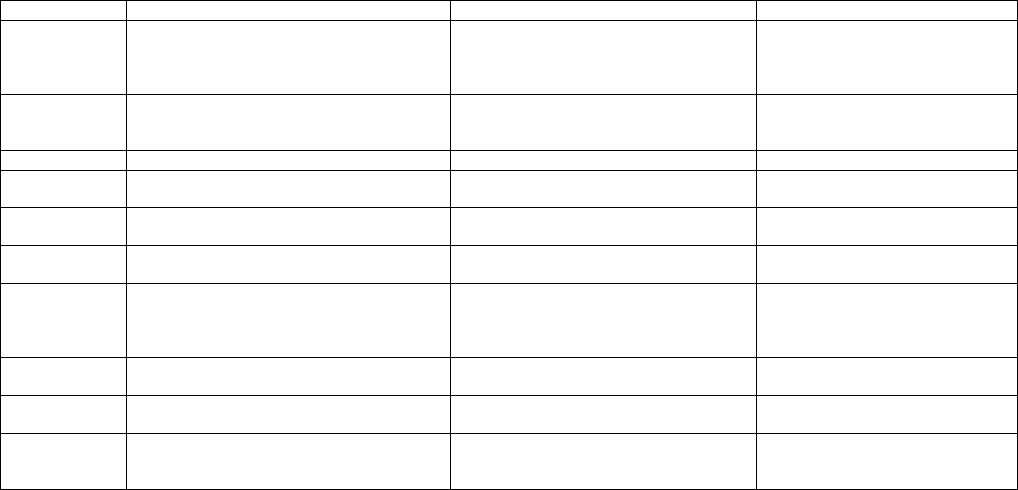
Table 1: Epidemiology-inspired terminology and its mapping to mobile app accessibility with examples. (a) Terms describing a single app
(a) Terms Describing an App
Term
Epidemiology
Accessibility
Example(s)
Health
State of complete physical, social, and mental
well-being, not just the absence of disease
State of complete accessibility and usability,
not merely the absence of obvious accessibility
problems
An app has all its buttons labeled but
their labels so poorly describe their
functions that the app is almost
impossible to use
Disease
A condition that interferes with a vital physiological
process
An accessibility barrier
An app with a calendar that cannot be
traversed with a screen reader would
have an “inaccessible calendar disease”
Host
An organism that can be infected
An app that can have an accessibility barrier
A specific app (e.g., the Yelp app)
Case
An instance of a particular condition
A single instance of an app with an
inaccessibility disease
An instance of the Toggl app with an
unlabeled button
Infectious Agent
An entity that carries and transmits a disease
A component that carries or transmits disease
The icon button widget from Android
Studio (see Section 2.1)
Determinant
A factor (entity, characteristic, behavior, or event)
that directly influences disease occurrence
The root cause (element, characteristic, code, or
design) of an accessibility barrier
The missing content description within
the button’s source code
Factor
An aspect of behavior, lifestyle, environment, or
inherited characteristic that is associated with
increased occurrence of a disease
A characteristic of an app or of the ecosystem in
which an app is developed, maintained, and used
that impact the likelihood of an app having an
inaccessibility disease. Can be risk or protective
(See Factors and Causation Section 4.1)
Usual Source
of Care
The place a patient usually goes when sick or
needing advice about health
The way an app is normally tested for
accessibility
Automated tests;
Blindfolded developer
Diagnosis
The process of determining by examination the
nature and circumstances of a disease
The process of determining the existence and
cause of an accessibility barrier
By hand exploration;
Google Accessibility Scanner
Life Expectancy
Average number of years of life remaining based on
individual, population, and environment
characteristics
How long before an app is abandoned based on
its risk and protective factors, environment, and
characteristics. Can be of development or use
How long app is maintained;
Time between download and
abandonment
Session: Interaction Techniques and Frameworks
ASSETS'17, Oct. 29–Nov. 1, 2017, Baltimore, MD, USA
5
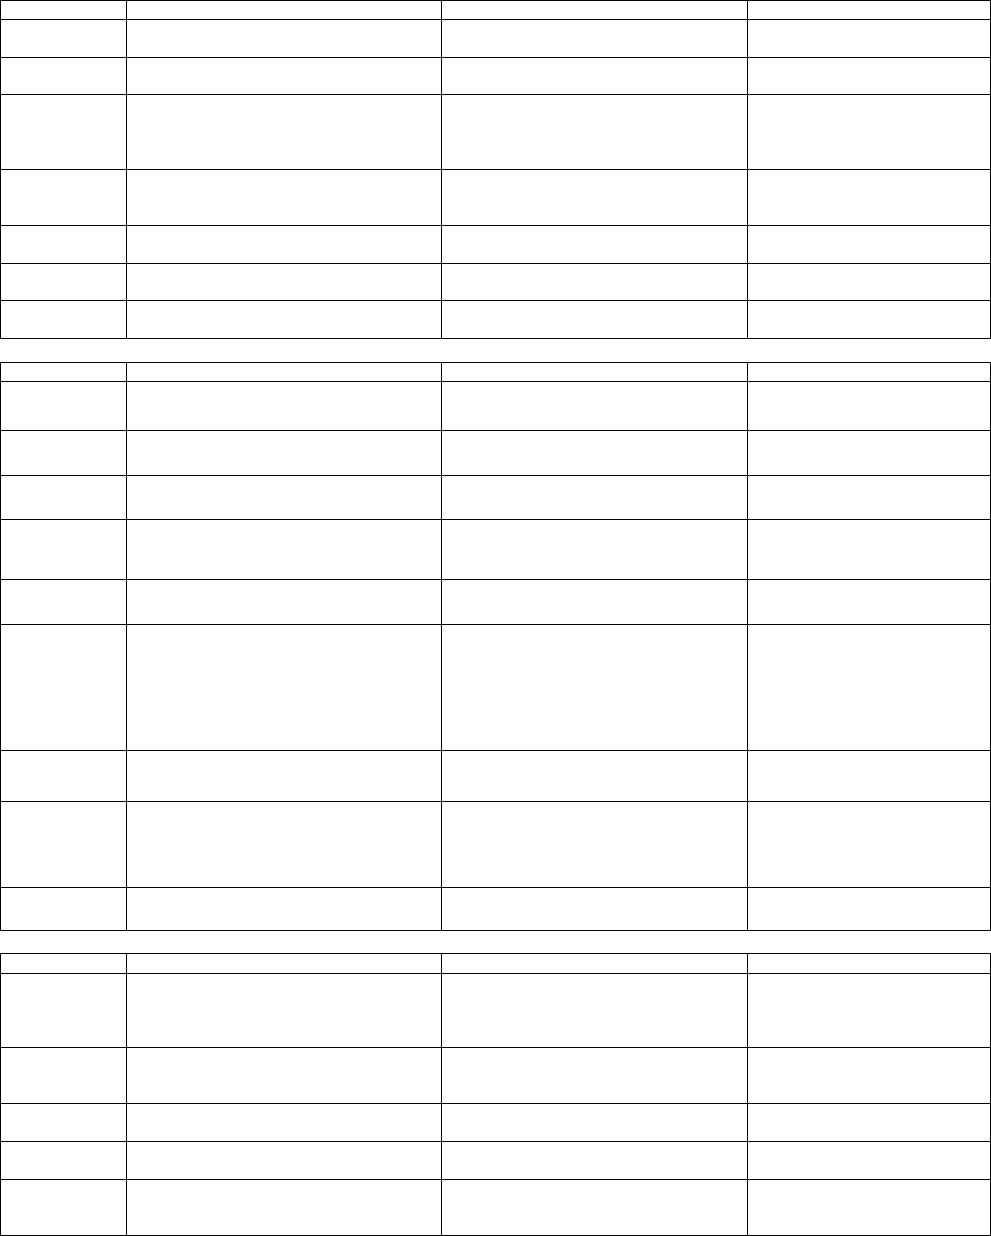
Table 1 cont. (b) Terms describing a disease. (c) Population-level terms. (d) Terms for taking action on epidemiology-inspired data.
(b) Terms Describing a Disease
Term
Epidemiology
Accessibility
Example(s)
Reservoir
The habitat in which an infectious agent normally
lives, grows, and multiplies
A harbor for accessibility barriers
Toolkits;
Design guides
Contagiousness
How capable a disease is of being transmitted by
contact or close proximity
The ease at which an accessibility barrier can be
transmitted given its host and environment
Highly contagious: An accessibility
barrier within core library source code
Natural History of
a Disease
The temporal course of disease from onset to fatal
termination, remission, relapse, or recovery
The process of an accessibility barrier being
introduced, encountered, fixed or ignored, and
perpetuated or permanently remedied. May be
of use or development
See Section 4.3
Incidence
Measure of the frequency of a new case of the
disease occurring in a population over time
A measure of the frequency of new occurrences
of an accessibility barrier in a population over time
Number of new cases of inaccessible
buttons in the Top 100 apps released
in a month
Prevalence
The number or proportion of cases of a disease in
a given population
The number or proportion of apps with a particular
disease in a given population
Number of apps in Top 100 with an
inaccessible button
Lethality
How likely is a disease to cause death or
complications
How likely is an app to be abandoned due to
accessibility barriers
Highly lethal: An log-in button that can’t
be activated with a screen reader
Transmission
Any mode or mechanism by which an agent is
spread
How an accessibility barrier enters an app
Copy-paste repository code;
Using a drag-and-drop tool
(c) Population-Level Terms
Term
Epidemiology
Accessibility
Example(s)
Population
The total number of persons in a particular group
(e.g., all people with a certain occupation)
The apps or a group of apps under consideration
Google Play Store Top 100;
All transportation apps
Census
The enumeration of an entire population with
details including residence, occupation, age, etc.
An enumeration of all apps including versions,
release dates, APK, platform, health status, etc.
The Androzoo [3] collection of apps,
versions, and security vulnerabilities
High-Risk Group
A group in the population with an elevated risk of
disease
A group of apps at elevated risk of having a
particular accessibility barrier
Android apps are more at risk for
inaccessibility than iOS apps
Outbreak
The occurrence of more cases of a disease than
expected in a given area or group over a
particular period of time
Occurrence of more cases of accessibility
barriers or a particular determinant than
expected in a period of time
Significant increase in number of
unlabeled buttons in a week
Mortality Rate
The measure of frequency of death in a
population during a specified time interval
A measure of how often apps are abandoned,
for any reason, during a specified time interval
70% of apps are abandoned within a
week of downloading
Herd Immunity
The resistance to an infection of an entire group
because of a substantial proportion being
immune. Herd immunity is based on having a
substantial number of immune persons, thereby
reducing the likelihood that an infected person will
encounter a susceptible one.
An app’s resistance to an accessibility barrier
because its ecosystem is dominated by factors
that are accessible
Minimizing the number of widgets in
Android Studio that introduce
accessibility barriers
Health Indicator
A measure that reflects, or indicates, the state of
health of people in a population
A measure that reflects, or indicates, the state of
accessibility within a population of apps
The number of apps with unlabeled
buttons
Detection Bias
Can occur when people with a risk factor are more
likely to have a disease detected because of
intense follow-up
Can occur when certain apps are more likely to
have accessibility barriers detected because of
closer scrutiny
Apps built by developers who
themselves have a disability might be
more likely to have early diagnosis of
accessibility barriers than other apps
Common Source
Outbreak
An outbreak that results from a group of persons
being exposed to a common disease agent
When there is a common source for an
increased incidence of an inaccessibility disease
An OS update that causes
widespread inaccessibility
(d) Terms about Taking Action
Term
Epidemiology
Accessibility
Example(s)
Public Health
Systematic collection, analysis, interpretation, and
dissemination of ongoing health data to gain
knowledge of disease patterns, and to control and
prevent disease
Systematic collection, analysis, interpretation,
and dissemination of ongoing app accessibility
data to gain knowledge of accessibility patterns
and to control and prevent barriers to access
Community reporting by and for
people with disabilities about the
accessibility of certain apps
Treatment
Techniques to combat a disease. Includes
prevention and therapy.
An intervention designed to reduce or eliminate
an accessibility barrier or its impact. Includes
prevention and therapy.
App developer tools that aid in the
detection and remedy of accessibility
barriers
Prevention
Treatment measures to prevent disease (e.g.,
immunization, limiting exposure to risk factors)
Treatment measures that prevent an app from
having an accessibility barrier
Screening toolkits;
Thorough testing
Therapy
Measure to treat a contracted disease, reduce its
impact on health, or reduce its spread
A treatment that repairs an existing
inaccessibility disease
Adding custom labels to buttons
Universal
Precautions
Recommendations issued to minimize the risk of
transmission of pathogens by health care and
public safety workers
Population-based prevention with best practices
that all apps should follow to reduce
inaccessibility
Accessibility guidelines;
Integration of accessibility testing into
general quality assurance
Session: Interaction Techniques and Frameworks
ASSETS'17, Oct. 29–Nov. 1, 2017, Baltimore, MD, USA
6
Social context encompasses the popularity of an app and how that
popularity can impact the accessibility standards to which the app
is held. Social relationships cover how vocal people in the
community are about accessibility, how active people are in
demanding that an app be accessible, and how responsive an app is
to adapting to critical feedback.
The final, most extrinsic factors include those on the institutional
and societal level. Within institutional context, there are education,
company, and government influences. Education influences include
the education of developers for creating accessible apps, of users on
existing accessibility support, of the community on the importance
of advocating for accessibility, and of institutional leaders on the
importance of prioritizing and integrating accessibility considerations.
Company factors consider how companies can impact the
accessibility of their apps by dedicating resources to accessibility,
choosing tools to help enhance accessibility, and creating policies
that enforce accessibility within their organizations. Government
factors are similar, but on a larger scale. The government’s role in
funding allocation, public initiatives, policies, lawmaking,
enforcement, and advocacy all play into the accessibility of apps.
At the extrinsic end of the spectrum is social condition. This covers
the cultural norms and public expectations of a whole society. For
example, whether accessibility is viewed as a bonus or an essential
requirement and how much society supports the allocation of
resources for achieving better accessibility.
All factors throughout the spectrum interact with one another and
shape the ecosystem in which an app is created, maintained, and used.
Changes in any one can impact others up and down the spectrum,
potentially affecting accessibility. Structuring our understanding of
how these factors affect an app’s risk for acquiring an “inaccessibility
disease” can guide accessibility enhancing treatments.
4.2 Determine the Extent of a Disease
In a world of limited resources, it is essential to direct those
resources toward the most impactful problems. Epidemiologists
determine the extent of a disease in a community, through measures
such as incidence and prevalence, to plan health services, facilities,
and health-provider training. App accessibility could benefit from
similar metrics. These metrics include disease prevalence, or the
extent to which “inaccessibility diseases” occur in an app
population. For a given disease, metrics also include identifying the
prevalence of determinants, or causes of diseases. Properties of the
determinant can also be measured, such as lethality, a measure of
severity defined as the likelihood an app will be abandoned due to
an accessibility barrier. Finally, metrics such as incidence that
measure how many new cases are emerging over time can help
identify whether a new risk factor has emerged that impacts many
apps. An example would be an accessibility barrier created by a
widespread OS update. The objective of determining the extent of a
disease gives a data-driven focus to addressing app inaccessibility.
4.3 Study Natural Histories
Our next inspiration from epidemiology is the study of the
progression of a disease in a host. Epidemiologists map disease
progression from exposure to a risk factor or infectious agent, to
early disease onset, to the appearance of symptoms, to diagnosis,
and finally to outcome. This progression model, known as the
natural history of the disease, informs what risk factors and
symptoms to be alert for, what impact the disease will have if
untreated, and where in the timeline there exist opportunities for
preventative or therapeutic treatments [20]. Rather than modeling
the natural history of an “inaccessibility disease,” we use similar
concepts to model the progression of an app through two important
phases of its existence: (1) its creation and maintenance, and (2) its
usage [12]. Modeling how an app progresses through these phases
frames thinking about when a host app might be exposed to a risk
factor or infectious agent, at what stages in the progressions the
disease might manifest and be diagnosable, and what impact the
disease might have. The natural histories also inspire when a treatment,
preventative or therapeutic, might be applied most effectively.
4.3.1 Natural History of App Development
The “Natural History of App Development” (Figure 2) outlines the
stages of app creation and maintenance. Pre-birth, or before an app
is released, the app goes through iterative steps of conception,
design, implementation, and testing. Interventions within this
period are preventative treatments. A successful preventative
intervention will treat an “inaccessibility disease” before the app is
released for use. As with epidemiology, preventative treatment is
preferred to therapeutic treatment (i.e., after release), as it prevents
placing a burden on the user community.
Figure 2. The natural history of app development model represents
the design and implementation process an app goes through
pre-release and post-release. It serves as a framework for where
new treatments might be introduced.
However, it is difficult to prevent all “diseases” in an app before
the app is released. We then consider the next stages of the app’s
post-birth life, which is an iteration on pre-birth stages through a
series of updates [12]. These updates might be driven by bug fixes,
end-user feedback, the app creator’s desire for new or extended
features, or any number of other factors. This update stage might
occur at varying rates, from daily to yearly. This stage presents an
opportunity for therapeutic treatments that address accessibility
barriers or vulnerabilities in released apps. It is unfortunately possible
that updates might introduce or worsen “inaccessibility diseases.”
It is therefore beneficial to monitor an app’s accessibility over time.
The last important milestone in the natural history of development
is death. In this stage of natural history, death is defined as when an
app is no longer being maintained. A “dead” app will not benefit
from treatment aimed at developers or maintainers, such as guidelines
or source code testing tools, and requires other forms of remediation.
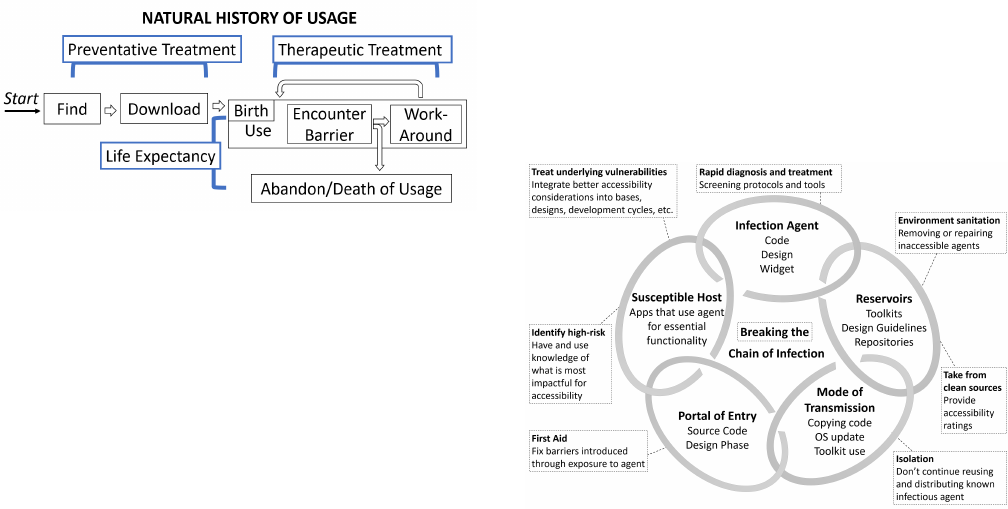
4.3.2 Natural History of App Usage
We also present the “Natural History of App Usage” (Figure 3),
which focuses on the environment of usage on a device by an end user.
An app’s usage is born at the beginning of its active use. Pre-birth
stages include finding and downloading an app. Preventative
treatment can be introduced at these stages. For example, by adding
the ability to filter searches for healthy, accessible apps or by
adding an accessibility rating to an app download page. Such
Session: Interaction Techniques and Frameworks
ASSETS'17, Oct. 29–Nov. 1, 2017, Baltimore, MD, USA
7
preventative treatments would allow a user to understand the health
of the app and potentially avoid trying apps that are “diseased.”
Figure 3. The natural history of app usage model represents the
process by which an end user finds, downloads, uses, and abandons
an app. The usage stage includes first usage, or birth of usage.
Within usage, someone might cycle through the stages of
encountering a barrier and trying to work around it. The progression
could ultimately end when a user abandons an app and usage dies.
An app’s usage-birth happens when it is first opened on the device.
During usage, barriers caused by “diseases” might be encountered
and work-arounds might be attempted. Usage-death occurs when
the person discontinues use entirely. Therapeutic methods could be
introduced within usage or abandonment. An example of an
existing treatment is found in Apple’s and Google’s screen readers,
an end-user can create custom button labels for fixing poorly
labeled elements. A post-death treatment could prompt a user to
submit feedback on why an app’s usage has ceased.
4.4 Evaluating Existing and New Treatments
Epidemiology is motivated to collect information to guide the
development of intervention methods and modes of health care
delivery. A key component to achieving that is being able to
evaluate the effectiveness of interventions in order to focus efforts
on the most promising strategies.
App accessibility efforts would benefit from expanding evaluation
techniques, such as those motivated by our epidemiology-inspired
framework. Existing accessibility enhancement techniques include
preventative treatments such as developer guidelines [1,4] and
automatic interface analysis tools [5,19] as well as therapeutic
treatments such as adding custom labels for screen readers and
forums where people can search for assistance [6].
Some existing treatments might have been tested on a small scale
with user testing or on a small number of apps, but systematic
population-based longitudinal multi-factor analyses are lacking.
Such analyses could provide more insights into the effectiveness of
treatments that address accessibility diseases and highlight
opportunities for improvement.
Example metrics from epidemiology include: (1) tracking the
prevalence or lethality of different disease determinants, or causes,
in the population (e.g., how many Android apps have an unlabeled
image button, or how many apps in that same population are
abandoned because of that “inaccessibility disease”); (2) performing
such tracking before and after a treatment is introduced (e.g., adding
the empty content description warning in Android Studio), and
(3) examining whether a treatment influences factors as expected
(e.g., logging whether missing content description warnings are
frequently muted in Android Studio). An impactful treatment
should be reflected in the metrics of the whole population. By
collecting population-level longitudinal multi-factor data, we can
better evaluate the strength of different approaches.
4.5 Breaking the Chain of Infection
Although not one of Gordis’ five objectives of epidemiology [20],
the Chain of Infection [14] (Figure 4) is another helpful concept for
understanding how different factors interact in the spread of disease.
The chain portrays the links between a disease agent, a susceptible
host, and how a disease spreads. We similarly conceptually model
different hosts, agents, and reservoirs for app accessibility barriers.
This model structures an understanding of the interactions between
agents, hosts, and transmission.
Figure 4. The Chain of Infection helps visualize where an
accessibility barrier originates and how it spreads into host apps.
Working to break the chain at any one major link—infectious agent,
reservoir, transmission, portal of entry, or susceptible host— can
guide where treatments are introduced. Inspired by [14].
This model is further useful with its extension into Breaking the
Chain of Infection [14]. If any link of the chain is broken, then the
disease cannot spread. By looking at each component in the chain
as an opportunity to disrupt the flow of a disease, we can better
consider where interventions could be introduced effectively, what
those interventions might look like, and what resources need to be
involved for intervention success.
This cycle can be applied to the Android Studio unlabeled icon
button case study (see Section 2.1). We start by defining the app as
a susceptible host for the inaccessible button disease. The icon
button widget acts as the infectious agent with the disease
determinant being its missing content description. The agent
resides in the reservoir of the Android Studio design interface. It is
transmitted through the developer’s use of that interface with a port
of entry at the source code implementation stage.
Establishing the links between the elements helps to structure the
consideration of possible interventions. Currently, Android Studio
provides a compilation warning for the missing content description,
effectively applying first aid (i.e., a warning) in the portal of entry
(i.e., the source code). The existing accessibility guidelines for
Android act to treat underlying vulnerabilities of the host app in the
form of addressing lack of education of developers. A potential
treatment at the agent (i.e., Image Button widget) link could be to
create a default content description for default Android icon
buttons. Framing accessibility within this chain provokes thinking
about causes of inaccessibility in greater granularity and inspires
new opportunities for addressing this problem.
Session: Interaction Techniques and Frameworks
ASSETS'17, Oct. 29–Nov. 1, 2017, Baltimore, MD, USA
8
4.6 Inform Public Policy and Regulation
Epidemiology’s consideration of multi-factor and population-level
influences on health within an ecosystem guides data collection and
analysis. In turn, that data can be applied to impact public health.
Mirroring Gordis’ [20] final objective for epidemiology, Informing
Public Policy and Regulation, we consider how a population-based
model of app accessibility can change the app environment to
enhance the health of apps. Changes could include legislation
(e.g., web accessibility [32]), company-enforced vetting of apps,
initiatives to inform developers, or initiatives to educate people on
available treatments for their apps. Data-driven direction and
structure can propel these changes to happen. For example, as in
the introduction of this paper, the percentage of people in the world
with disabilities is often used as motivation for accessibility work.
Similar data around the prevalence and lethality, or impact, of app
accessibility problems could compel policy changes. An
epidemiology-inspired framework helps inform what data
collection, analysis, and presentation might look like.
5. EXERCISING THE FRAMEWORK
Our chief contribution in this paper is conceptual, providing a new
framework that reshapes how we think about and work to improve
app accessibility. To demonstrate how this framework guided our
own thinking, we present an initial empirical study of the
prevalence of various “inaccessibility diseases” in Android apps.
5.1 Method
We took a stratified sample from the population of top free Android
apps. Apps were selected from the “top downloaded, free” lists in
the Google Play Store in each of ten categories (i.e., our strata):
Business, Communication, Education, Entertainment, Health and
Fitness, Maps and Navigation, Medical, Productivity, Shopping,
and Social. We excluded apps that required a specialized log-in
(e.g., a bank account or subscription) or blocked automated
scanning (e.g., banking apps often block taking screenshots). Ten
apps from each category were analyzed, totaling 100 apps. For each
app, 4-8 primary tasks were identified. For example, in the “Indeed
Job Search” app, the tasks were as follows: recover forgotten
password, log-in, search for jobs, apply for jobs, and access
settings. Google’s Accessibility Scanner [19] was the diagnostic
tool used to scan each screen required to complete the tasks for
determinants of various “inaccessibility diseases” (Table 2).
Table 2. The accessibility errors, or disease determinants, reported
by Google’s Accessibility Scanner provide a health indicator for apps.
Error
Description
Clickable Items
Overlapping clickable items
Editable Image Label
TextView has a content description. This might
interfere with a screen reader’s ability to read the
content of the text field
Image Contrast
Low contrast in image or icon
Item Descriptions
Items with identical speakable text
Item Label
Missing element label
Item Type Label
Item label ends with type, e.g., “Play Button.”
TalkBack automatically announces item type, so
information is redundant
Link
URL in link may be invalid
Text Contrast
Low text contrast between foreground and
background
Touch Target
Item is too small
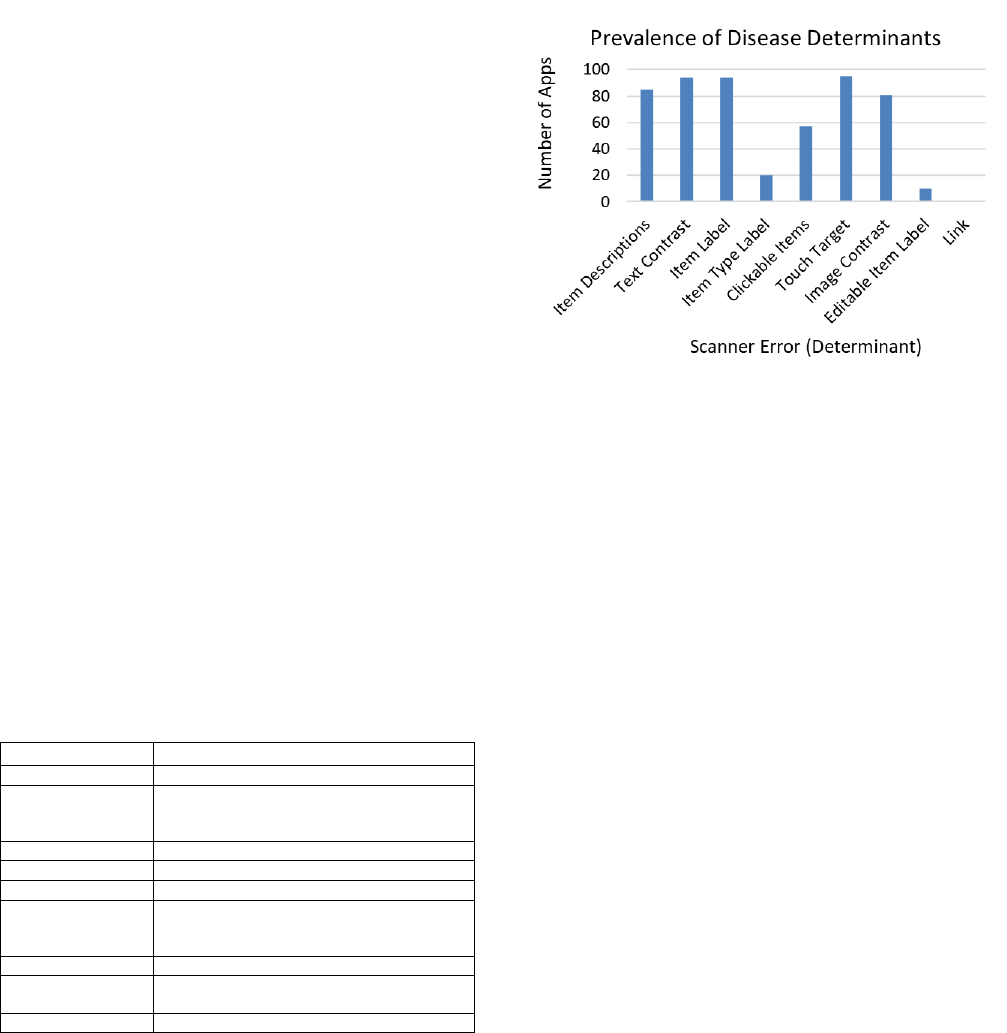
5.2 Results
The prevalence of each disease determinant is the number of apps
in which each error occurred (Figure 5). The most prevalent
determinants are Touch Target (95% of apps), Item Label (94%),
and Text Contrast (94%). Slightly less prevalent are Item
Descriptions (85%), Image Contrast (85%), and Clickable Items
(57%). The least prevalent determinants were Item Type Label
(20%), Editable Item Label (10%), and Link (1%).
Figure 5. The high prevalence of disease in the tested apps
highlights that apps are still largely inaccessible, even for simple
determinants like item labels. All of these determinants can result in
various “inaccessibility diseases,” like the “inaccessible button disease.”
To provoke thinking about whether determinants co-occur, Figure 6
presents the distribution of disease determinants per app. Based on
the determinants tested, all of the apps had some form of an
“inaccessibility disease;” in other words, they all presented at least
one of the nine determinants as symptoms. Seventy-two percent of
apps were diagnosed with either five or six determinants (36%
each). The remaining distribution is skewed slightly left with 3%
of apps diagnosed with one determinant, 2% of apps with two, 2%
with three, 9% with four, 10% with seven, 3% with eight, and no
apps presenting a case with all determinants. It is important to note
the limitations of the Google Accessibility Scanner diagnostic tool
and the impact those limitations have on the results. For example,
the three apps with a single determinant all presented a single Item
Label error on all tested screens. In each case, the single error
reflected the fact that their entire interface was a canvas that
presented itself as a single item to the accessibility API (i.e., the
entire screen is inaccessible, but only one error is reported).
5.3 Discussion of Results
To our knowledge, there is no large-scale census of how prevalent
different accessibility barriers are in mobile apps. The prevalence
report presented above works toward such a census on the most
prominent accessibility barriers in the population of top Android
apps. Our findings, albeit preliminary, show that significant
accessibility barriers, such as missing item labels, are still widely
prevalent in apps. Situating these findings within our new
conceptual framework, we can see how this type of data can
motivate the need for dedicating resources to reducing even basic
accessibility barriers and serve as a metric for evaluating the
effectiveness of existing interventions.
Session: Interaction Techniques and Frameworks
ASSETS'17, Oct. 29–Nov. 1, 2017, Baltimore, MD, USA
9
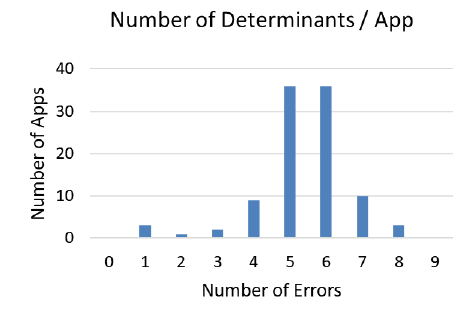
Figure 6. The distribution of the number of errors in each app
explores co-occurrences of different disease determinants. Co-
occurrence might suggest different underlying influential factors.
Although prevalence is one useful metric of app accessibility, it
does not alone capture disease causes or impact. The lethality of
each case of inaccessibility varies due to the determinant and
context. For example, the Item Label error is more lethal than the
Item Type Label for a screen reader user. A Touch Target error may
be more lethal for someone with a motor impairment than an Item
Label error. These observations motivate the development of
advanced diagnostic tools and techniques that can give deeper
insights into the most impactful determinants.
There are many co-occurrences of different determinants of
inaccessibility (Figure 6). Cases where different lethalities of
similar determinants co-occur are of special interest. For example,
Item Description and Item Label are similar errors but Item Label
is usually more lethal. An Item Label error will result in a screen
reader saying “unlabeled button” versus an Item Description error will
cause it to redundantly say “save button button.” The co-occurrence
of these determinants raises the question of why some elements get
poor labels while others get none. The fact that the co-occurrence
was not an isolated incident (at least 11% of apps tested had both
errors) suggests that there might be underlying common factors
involved. A more detailed analysis of what tools, education, or
other factors contributed to some elements being labeled while
others were not would give insight into: (1) in what stages of an
app’s natural history of development and usage it might be exposed
to different infectious agents and determinants (e.g., what libraries
are associated with unlabeled versus poorly labeled elements); (2)
the effectiveness of current treatments; and (3) where in the chain
of infection new treatments might be most effective.
Our results also highlight the limitations of current accessibility
analysis tools. As noted above, the three apps that only have one
error are due to the whole interface canvas being represented as a
single, unlabeled element. This design makes them among the most
inaccessible apps for screen reader users. Yet our current approach
of counting types of errors, based on the granularity of the
Accessibility Scanner, does not reflect the magnitude of those
single error cases. Advancements in diagnostic tools would allow
for the collection of better overall health metrics.
6. TAKEAWAYS AND FUTURE WORK
Our epidemiology-inspired framework has influenced how we
approach app accessibility, driving our initial prevalence analysis.
Situating our analysis and findings within the framework guided
our methods, structured the types of phenomena we investigated,
and gave us language to discuss the results and how they impact the
larger ecosystem of app accessibility. The framework also provided
many opportunities for considering future work in understanding
and enhancing app accessibility.
The primary purpose and contribution of this paper is to introduce
the epidemiology-inspired framework for app accessibility and to
put a small piece of it through its paces in a preliminary analysis of
disease prevalence. But, as the size of the entire framework makes
clear, there are many other aspects of accessibility that can be
measured in future work. Creating tools that allow for large-scale
population-level analyses, tracing “inaccessibility diseases” in apps
to identify potential agents (e.g., the Android Studio icon button
example), and designing novel interventions beyond guidelines and
individual developer tools are priorities for future work. Our new
conceptual framework provides the motivation and structure to
explore these opportunities. We acknowledge the sheer size and
complexity of the epidemiology-inspired framework, but find it
proportional to the problems and opportunities associated with
improving the accessibility of the entire mobile app ecosystem.
7. CONCLUSION
We have shown how epidemiology’s motivation, language,
techniques, and models are highly transferrable to the challenge of
mobile app accessibility on a population-level, beyond just addressing
individual apps. It is our hope that our epidemiology-inspired
framework will shape, guide, and inform our current methods and
priorities for addressing app accessibility by incorporating
multi-factor, longitudinal, and population-level concepts.
8. ACKNOWLEDGMENTS
We thank Anat Caspi of the Taskar Center for Accessible Technology
at the University of Washington for her insights and feedback. This
work was funded in part by the National Science Foundation under
awards IIS-1053868, IIS-1702751, and DGE-1256082; the Wilma
Bradley Endowed Fellowship in Computer Science & Engineering;
a Google Faculty Award; and The Mani Charitable Foundation.
9. REFERENCES
1. Android Accessibility Developer Guidelines.
https://developer.android.com/guide/topics/ui/accessibility
2. Android Studio.
https://developer.android.com/studio/index.html
3. Androzoo. https://androzoo.uni.lu/
4. Apple Accessibility Developer Guidelines.
https://developer.apple.com/accessibility/ios/
5. Apple Accessibility Scanner.
https://developer.apple.com/library/content/documentation/
Accsssibility/Conceptual/AccessibilityMacOSX/
OSXAXTestingApps.html
6. AppleVis. http://www.applevis.com/
7. Victoria Bellotti, Maribeth Back, W. Keith Edwards, Rebecca
E. Grinter, Austin Henderson, and Cristina Lopes. (2002).
Making Sense of Sensing Systems: Five Questions for
Designers and Researchers. Proc CHI 2002, 415–422.
http://doi.org/10.1145/503376.503450
8. Jeffrey P. Bigham, Anna C. Cavender, Jeremy T. Brudvik,
Jacob O. Wobbrock, and Richard E. Lander. (2007).
WebinSitu: a Comparative Analysis of Blind and Sighted
Browsing Behavior. Proc. Assets 2007, 51–58.
http://doi.org/10.1145/1296843.1296854
Session: Interaction Techniques and Frameworks
ASSETS'17, Oct. 29–Nov. 1, 2017, Baltimore, MD, USA
10
9. Matt Bishop. (2003). What is Computer Security? IEEE
Security & Privacy Magazine, 1(1), 67–69.
http://doi.org/10.1109/MSECP.2003.1176998
10. Matthias Böhmer, Brent Hecht, Johannes Schöning, Antonio
Krüger, and Gernot Bauer. (2011). Falling Asleep with Angry
Birds, Facebook and Kindle – A Large Scale Study on Mobile
Application Usage. Proc. MobileHCI 2011, 47–56.
http://doi.org/10.1145/2037373.2037383
11. Urie Bronfenbrenner. (1979). The Ecology of Human
Development: Experiments by Nature and Design. Harvard
University Press.
12. Parmit K. Chilana, Andrew J. Ko, Jacob O. Wobbrock, Tovi
Grossman, and George Fitzmaurice. (2011). Post-Deployment
Usability: a Survey of Current Practices. Proc. CHI 2011,
2243–2246. http://doi.org/10.1145/1978942.1979270
13. Raphael Clegg-Vinell, Christopher Bailey, and Voula
Gkatzidou. (2014). Investigating the Appropriateness and
Relevance of Mobile Web Accessibility Guidelines. Proc.
W4A 2014, 1–4. http://doi.org/10.1145/2596695.2596717
14. Association for Professionals in Infection Control. (2017).
Break the Chain of Infection. Infection Protection and You:
Healthcare Professionals.
15. Michael Cooper, Peter Korn, Andi Snow-Weaver, Gregg
Vanderheiden, Loïc Martínez Normand, and Mike Pluke.
(2013). Guidance on Applying WCAG 2.0 to Non-Web
Information and Communications Technologies
(WCAG2ICT). http://www.w3.org/TR/wcag2ict/
16. Biplab Deka, Zifeng Huang, and Ranjitha Kumar. (2016).
ERICA: Interaction Mining Mobile Apps. Proc. UIST 2016,
767–776. http://doi.org/10.1145/2984511.2984581
17. Floating Action Button Usage Guidelines.
https://www.material.io/guidelines/components/
buttons-floating-action-button.html
18. Santiago Gil, Alexander Kott, and Albert-László Barabási.
(2014). A Genetic Epidemiology Approach to Cyber-Security.
Scientific Reports, 4, 5659. http://doi.org/10.1038/srep05659
19. Google Accessibility Scanner.
https://play.google.com/store/apps/details?
id=com.google.android.apps.accessibility.auditor
20. Leon Gordis. (2004). Epidemiology. Saunders, Philadelphia, PA.
21. Vicki L. Hanson and John T. Richards. (2013). Progress on
Website Accessibility? ACM Transactions on the Web, 7(1),
1–30. http://doi.org/10.1145/2435215.2435217
22. Dale F. Leipper. (1961). Oceanography—A Definition for
Academic Use. Transactions, American Geophysical Union,
42(4), 429. http://doi.org/10.1029/TR042i004p00429
23. Jennifer Mankoff, Holly Fait, and Tu Tran. (2005). Is Your
Web Page Accessible?: a Comparative Study of Methods for
Assessing Web Page Accessibility for the Blind. Proc. CHI
2005, 41–50. http://doi.org/10.1145/1054972.1054979
24. Material Design. https://material.io/guidelines/
25. Lauren R. Milne, Cynthia L. Bennett, and Richard E. Ladner.
(2014). The Accessibility of Mobile Health Sensors for Blind
Users. http://scholarworks.calstate.edu/handle/10211.3/133384
26. S. Milne, A. Dickinson, A. Carmichael, D. Sloan, R. Eisma,
and P. Gregor. (2005). Are Guidelines Enough? An
Introduction to Designing Web Sites Accessible to Older
People. IBM Systems Journal, 44(3), 557–571.
http://doi.org/10.1147/sj.443.0557
27. Trinh Minh, Tri Do, Jan Blom, and Daniel Gatica-perez.
(2011). Smartphone Usage in the Wild : a Large-Scale
Analysis of Applications and Context. Proc. ICMI 2011,
353–360. http://doi.org/10.1145/2070481.2070550
28. Israel J. Mojica, Bram Adams, Meiyappan Nagappan, Steffen
Dienst, Thorsten Berger, and Ahmed E. Hassan. (2014). A
Large-Scale Empirical Study on Software Reuse in Mobile
Apps. IEEE Software, 31(2), 78–86.
http://doi.org/10.1109/MS.2013.142
29. Mike Oliver. (1990). The Individual and Social Models of
Disability. Joint Workshop of the Living Options Group and
the Research Unit of the Royal College of Physicians, Vol. 23.
30. John T. Richards, Kyle Montague, and Vicki L. Hanson.
(2012). Web Accessibility as a Side Effect. Proc. ASSETS
2012, 79-86. http://doi.org/10.1145/2384916.2384931
31. Alireza Sahami Shirazi, Niels Henze, Albrecht Schmidt,
Robin Goldberg, Benjamin Schmidt, and Hansjörg
Schmauder. (2013). Insights Into Layout Patterns of Mobile
User Interfaces by an Automatic Analysis of Android Apps.
Proc. EICS 2013, 275–284.
http://doi.org/10.1145/2494603.2480308
32. Section 508. https://www.section508.gov/
33. Arthur Tansley. (1987). What is Ecology? Biological Journal
of the Linnean Society, 32(1), 5–16.
http://doi.org/10.1111/j.1095-8312.1987.tb00406.x
34. Richard B Warnecke, April Oh, Nancy Breen, Sarah Gehlert,
Electra Paskett, Katherine L Tucker, Nicole Lurie, Timothy
Rebbeck, James Goodwin, John Flack, Shobha Srinivasan,
Jon Kerner, Suzanne Heurtin-Roberts, Ronald Abeles,
Frederick L Tyson, Georgeanne Patmios, and Robert A Hiatt.
(2008). Approaching Health Disparities From a Population
Perspective: the National Institutes of Health Centers for
Population Health and Health Disparities. American Journal
of Public Health, 98(9), 1608–15.
http://doi.org/10.2105/AJPH.2006.102525
35. World Health Organization. (2011). World Report on Disability.
http://www.who.int/disabilities/world_report/2011/report/en/
36. Daihua X Yu, Bambang Parmanto, Brad E Dicianno, and
Gede Pramana. (2015). Accessibility of mHealth Self-Care
Apps for Individuals with Spina Bifida. Perspectives in
Health Information Managemen, American Health
Information Management Association, 12(Spring).
http://www.ncbi.nlm.nih.gov/pubmed/26755902
37. Xiaoyi Zhang, Anne Spencer Ross, Anat Caspi, James
Fogarty, and Jacob O. Wobbrock. (2017). Interaction Proxies
for Runtime Repair and Enhancement of Mobile Application
Accessibility. Proc. CHI 2017, 6024–6037.
Session: Interaction Techniques and Frameworks
ASSETS'17, Oct. 29–Nov. 1, 2017, Baltimore, MD, USA
11
