
Financing the UN Development System
Time for Hard Choices
September 2019
United Nations
MPTF Oce
The views expressed in this publication are those of the authors and do not necessarily
represent those of the Dag Hammarskjöld Foundation, the United Nations,
(including the United Nations Development Programme)
the Multi-Partner Trust Fund Oce or the UN Member States.
Design of figures and illustrations
Pär Jansson and Kristin Blom
Illustrations
Cover, and all small labyrinth illustrations: Adobe Stock Images
Copy Editor
Emma Naismith
Printer
X-O Graf Tryckeri AB
Uppsala, Sweden
August 2019
ISBN
978-91-985372-1-5

Financing the UN Development System
Time for Hard Choices

5
This fth annual report, Financing the UN Development System 2019: Time for Hard Choices
is produced through a collaborative partnership between the Dag Hammarskjöld Foundation
(the Foundation) and the United Nations Multi-Partner Trust Fund Oce (MPTFO).
The lead authors of the 2019 edition of the report were Bruce Jenks (Senior Advisor to the
Dag Hammarskjöld Foundation) and Jennifer Topping (Executive Coordinator of the MPTFO).
Veronika Tywuschik-Sohlström (Programme Manager) acted as production lead for the report,
supported by Sigrid Gruener (Programme Director) and Henrik Hammargren (Executive
Director), all three from the Foundation.
Part One was developed and led by MPTFO colleagues Henriette Keijzers (Deputy Executive
Coordinator), Per Andersson (Senior Advisor), Diana Fajardo-Ardila (Data Analyst) and Per Jentzsch
(Data Analyst).
The look of the report is thanks to Kristin Blom (Communication Manager) at the Foundation.
Annika Östman (Communication Manager) and Anna Crumley-Enger (Communications and
Programme Coordinator) provided useful reections on the content together with all lead authors.
Johanna Mårtendal (Programme Assistant) helped with thorough proofreading.
The Financing the UN Development System 2019: Time for Hard Choices report was made all the richer
by the contributions, expertise, and ideas from a wide array of partners from near and far.
A special thank you to our guest authors, who generously contributed with their insights on
current nancial trends. A sincere thanks to: Adriana Erthal Abdenur, Max-Otto Baumann,
Fiona Bayat-Renoux, Michael Bennett, Franck Bousquet, Henk-Jan Brinkman, Laura Buzzoni,
Pedro Conceição, Brian Elliott, Philipp Erfurth, Rebeca Godoy, Navid Hanif, Catherine Howell,
Homi Kharas, Erik Lundsgaarde, Ayham Al Maleh, John W. McArthur, Ulrika Modéer,
Michael Møller, Ambassador Lana Zaki Nusseibeh, Jonathan Prentice, Ambassador E. Courtenay
Rattray, Maximilian Sandbaek, Guido Schmidt-Traub, Silke Weinlich, and Kanni Wignaraja.
Last but not least, this publication would not have been possible without the close partnership
with Laura Gallacher from the Chief Executives Board for Coordination (CEB) Secretariat and
Andrew MacPherson from the United Nations Department of Economic and Social Aairs
(UNDESA) who kindly provided us with the CEB and UNDESA data used for the gures and
tables found in Part One of this report.
Acknowledgements

6
ACKNOWLEDGEMENTS ....................................................................................................... 5
OVERVIEW OF FIGURES & TABLES ...................................................................................... 8
EXECUTIVE SUMMARY .......................................................................................................10
INTRODUCTION ................................................................................................................. 22
PART ONE: ........................................................................................................................ 25
OVERVIEW OF UNITED NATIONS' RESOURCE FLOWS ....................................................... 26
CHAPTER ONE: REVENUE ..................................................................................................27
CHAPTER TWO: EXPENDITURE...........................................................................................52
CHAPTER THREE: MOVING AHEAD ON DATA QUALITY .................................................... 58
PART TWO: ....................................................................................................................... 65
OVERVIEW OF PART TWO .................................................................................................. 66
CHAPTER ONE: FINANCING THE 2030 AGENDA: THE BIG PICTURE .................................70
International nancing of the Sustainable Development Goals
By Homi Kharas ........................................................................................................................................... 71
The United Nations Secretary-General’s strategy for nancing the 2030 Agenda for Sustainable Development
By Fiona Bayat-Renoux ............................................................................................................................... 74
Investment Gapportunities: Changing the narrative on investment in sustainable development
By Navid Hanif and Philipp Erfurth.............................................................................................................. 79
Driving development nance to the ground: Closing the investment gap
By Ambassador E. Courtenay Rattray ............................................................................................................ 86
Bye-bye, billions to trillions
By John W. McArthur ................................................................................................................................... 90
How does science and technology policy shape inequality?
By Pedro Conceição ..................................................................................................................................... 93
Table of contents

7
Table of contents
CHAPTER TWO: EARMARKING: MAKING SMART CHOICES .............................................100
UN pooled funding:
‘Healthy’ nancing for better multilateral results
By the UN Multi-Partner Trust Fund Oce (MPTFO) .............................................................................. 101
Shades of grey: Earmarking in the UN development system
By Max-Otto Baumann, Erik Lundsgaarde and Silke Weinlich .................................................................... 106
Improving the World Health Organization’s nancing
By Brian Elliott and Maximilian Sandbaek .................................................................................................. 110
Lessons from health on how to invest wisely in development
By Guido Schmidt-Traub ........................................................................................................................... 115
Current and future pathways for UN system-wide nance
By Silke Weinlich and Bruce Jenks .............................................................................................................. 119
CHAPTER THREE: FINANCING PEACEBUILDING,
HUMANITARIAN ASSISTANCE AND MIGRATION: TIME TO INVEST ...............................124
Financing t for the future: A 10-point Agenda for Financing Peacebuilding
By the Dag Hammarskjöld Foundation ...................................................................................................... 125
The World Bank Group and the IDA18: Scaling-up support to address Fragility, Conict and Violence
By Franck Bousquet ................................................................................................................................... 128
Innovative nance for peacebuilding: It is time to invest
By Catherine Howell and Henk-Jan Brinkman ........................................................................................... 131
Ocial Development Assistance and peacebuilding: 10-year trends
By Ayham Al Maleh .................................................................................................................................... 136
How the Peacebuilding Fund is investing in the Sustainable Development Goals
By Laura Buzzoni and Henk-Jan Brinkman ................................................................................................ 141
OECD's Total Ocial Support for Sustainable Development pilot study on peace and security ...............................146
Financing the humanitarian-development-peace nexus
By the UN Multi-Partner Trust Fund Oce (MPTFO) .............................................................................. 148
Forecast-based nancing: A breakthrough at last for humanitarian nancing?
By Lana Zaki Nusseibeh ............................................................................................................................. 153
World Bank catastrophe bonds as an innovative development nancing tool
By Michael Bennett and Rebeca Godoy ..................................................................................................... 156
The Migration Fund: Building on the Global Compact for Safe, Orderly and Regular Migration
By Jonathan Prentice .................................................................................................................................. 160
CHAPTER FOUR: MULTILATERALISM ON TRIAL? .............................................................162
A resolute resolution for multilateralism – a perspective from International Geneva
By Michael Møller...................................................................................................................................... 163
A brief reection on multilateralism, the UN and nancing
By Ulrika Modéer ...................................................................................................................................... 165
Multilateralism: An instrument of choice
By Bruce Jenks ........................................................................................................................................... 168
The crisis of multilateralism, viewed from the Global South
By Adriana Erthal Abdenur ......................................................................................................................... 172
Attracting the millennial investor to multilateralism and investing in the Sustainable Development Goals
By Kanni Wignaraja .................................................................................................................................... 174
CONCLUSION .................................................................................................................... 177
ACRONYMS & ABBREVIATIONS ........................................................................................178
ENDNOTES FOR PART ONE ...............................................................................................180
NOTES TO FIGURES AND TABLES IN PART ONE ............................................................... 182

8
Overview of figures and tables
in Part One
Figures
Figure 1: Overview of the total revenue of the UN system by nancing instrument, 2017 ............................ 29
Figure 2: Distribution of total UN system revenue, by nancing instrument, 2010–2017 .............................. 29
Figure 3: UN operational activities’ share of total revenue of the UN system by
nancing instrument, 2017 (Total US$ 53.2 billion) ..................................................................................... 32
Figure 4: Total core and earmarked contributions for UN operational activities, 2000–2017 . ........................ 35
Figure 5: Funding of UN system-wide activities, 2017 .................................................................................. 36
Figure 6: Total contributions for development and humanitarian-related
UN operational activities, 2000–2017 .......................................................................................................... 37
Figure 7: Real growth of ODA and of funding for UN operational activities
for development, 2000-2017 ........................................................................................................................ 37
Figure 8: Global humanitarian assistance ows, 2007–2018 .......................................................................... 38
Figure 9: Channels of total multilateral assistance from OECD-DAC countries, 2017 .................................. 39
Figure 10: Channels of total multilateral assistance from OECD-DAC countries,
core and earmarked, 2013 and 2017 .............................................................................................................. 40
Figure 11: Funding sources for UN operational activities, 2017 ..................................................................... 41
Figures 12-17: Non-state revenue of six selected UN entities, 2017 ............................................................. 42
Figure 18: Sources of ODA within 12 largest OECD-DAC members, as proportion of total, 2017 ................ 43
Figures 19-24: Funding sources within 6 OECD-DAC contributing countries nancing ODA, 2017 ........... 44
Figure 25: Funding mix of the top 12 OECD-DAC members to UN operational activities, 2017 ................. 45
Figure 26: Funding mix of the top 12 non OECD-DAC countries contributing to UN
operational activities, 2017 ............................................................................................................................ 46
Figure 27: Why a Funding Compact? .......................................................................................................... 47
Figure 28a and 28b: Development assistance funding mix of the top 20 contributors to the UNDS,
including assessed contributions, 2017 ........................................................................................................... 48
Figure 29: Total core contributions from the top ten OECD-DAC countries
to six selected UNentities, 2017 ................................................................................................................... 50
Figure 30: Total core contributions from the top ten non OECD-DAC countries
to six selected UN entities, 2017 ................................................................................................................... 50
Figure 31: Total earmarked contributions from the top ten OECD-DAC donors
to six selected UN entities, 2017 ................................................................................................................... 51

9
Figure 32:
Total earmarked contributions from the top ten non OECD-DAC countries
to six selected UN entities, 2017 ................................................................................................................... 51
Figure 33: Deposits to UN inter-agency pooled funds, 2010–2017 ............................................................... 52
Figure 34: Deposits to UN inter-agency pooled funds from the 12 largest contributors, and share
of their total earmarked contributions to the UN, 2017 ................................................................................. 53
Figure 35: Countries contributing more than 10% of their total earmarked funding to the UN
through UN inter-agency pooled funds, 2017 ............................................................................................... 53
Figure 36: Expenditure on UN operational activities by region, 2017 ........................................................... 54
Figure 37: Expenditure on UN operational activities by countries’ income status, 2017 ................................. 56
Figure 38: UN operational and peace related expenditure in crisis-aected countries, 2017 .......................... 57
Figure 39: Simplied representation of ows reported by multilateral institutions
in ODA and TOSSD ..................................................................................................................................... 61
Figure 40: Estimates of double counting in the UN system’s total 2017 revenue ........................................... 62
Figure 41: UN Data Standards and the Funding Compact ............................................................................ 63
Overview of figures and tables
Tables
Table 1: The spectrum of UN nancing instruments ..................................................................................... 27
Table 2a: Total revenue of the UN system by entity and by nancing instrument, 2017 (US$ million) ......... 30
Table 2b: Total revenue of seven UN entities, 2017-2018 (US$ million) ....................................................... 31
Table 3: Assessed contributions to the UN system by entity, 1975-2017 (US$ million) ................................. 33
Table 4: Earmarked contributions to the UN system by entity (US$ million) .............................................. 34
Table 5: Five year perspective of Total Multilateral Aid from OECD-DAC countries (US$ billion) ............... 39
Table 6: Total expenditure by UN entity, 2005-2017 (US$ million) .............................................................. 55

10
Executive summary
trends impacting the SDGs. These are organised into
four dierent chapters. Emerging issues this year are how
nancing can more eectively support a ‘leave no one
behind’ agenda and how the ‘big picture’ of nancial
ows to developing countries inuences the role of the
UNDS in dierent country contexts.
This part of the report also dives deeply into the
challenges and opportunities for nancing related to
conict prevention and peacebuilding. In addition, it
looks at the role of nancing as it relates to technology,
digitalisation, science and for the rst time at the
purposeful investment choices of young millennial
investors. Together these essays provide analysis and
insights that we believe make an important contribution
to the debate and to the choices that lie ahead.
Key findings Part One:
Overview of United Nations’ resource flows
Chapter One: Revenue
The total revenue received by the UN in 2017 was
US$ 53.2 billion and represented an increase of
US$ 3.9 billion compared to 2016 (Table 2a). The
increase can be partly attributed to three factors:
First, six new UN entities are reporting to the Chief
Executives Board for Coordination (CEB) for the rst
time in this year’s report adding a total of US$ 0.5
billion to the overall revenue. Second, ‘double counting’
in the UN nancial system makes the UN total revenue
seem larger than it is; specic instances of where the
same nancial ows are reported by two UN entities
to the CEB are analysed in more detail in the third
chapter on data quality. And lastly, the overall revenue
of many UN entities has grown between 2016 and 2017,
with the United Nations Children’s Fund (UNICEF)
and the World Health Organization (WHO) having the
highest growth rate among six large UN entities
(35% and 17% respectively).
An important challenge is embedded in the
title of this year’s report:
Time for Hard Choices.
In a financing world which is both simple
and complex, the choices are numerous and
what follows are hard decisions about the
allocation of resources. A multilateral
approach to today’s global challenges will
need to use evidence to show its competitive
advantage. From here on, the financing
questions flow.
The intention of this report is to wake us up to the
reality that the nancing of the United Nations
development system (UNDS) is currently in the
spotlight of a complex reform agenda. At the same time,
nancing is a crucial dimension of a multilateral
approach to addressing the world’s urgent development
challenges. The report showcases the complexities and
inno vations within Sustainable Development Goal
(SDG) nancing and the need for a rm multilateral
approach when it is best for SDG achievement.
Scope of the report
This, the fth edition of Financing the UN Development
System report, is, as in previous years, divided into two parts.
Part One provides accessible UN funding data on
revenue and expenditures, which we believe is important
for understanding current and future nancing reform
discussions. This year’s report includes references to two
new initiatives in the UNDS funding landscape, the
Funding Compact and the 1% levy on tightly earmarked
contributions. It also discusses the quality issues of
nancial data, the adoption of new UN data standards
and why it matters.
In Part Two of the report, 25 prominent guest authors
from outside and inside the UN system present their
ideas and initiatives in concise essays on the nancing
11
Executive summary
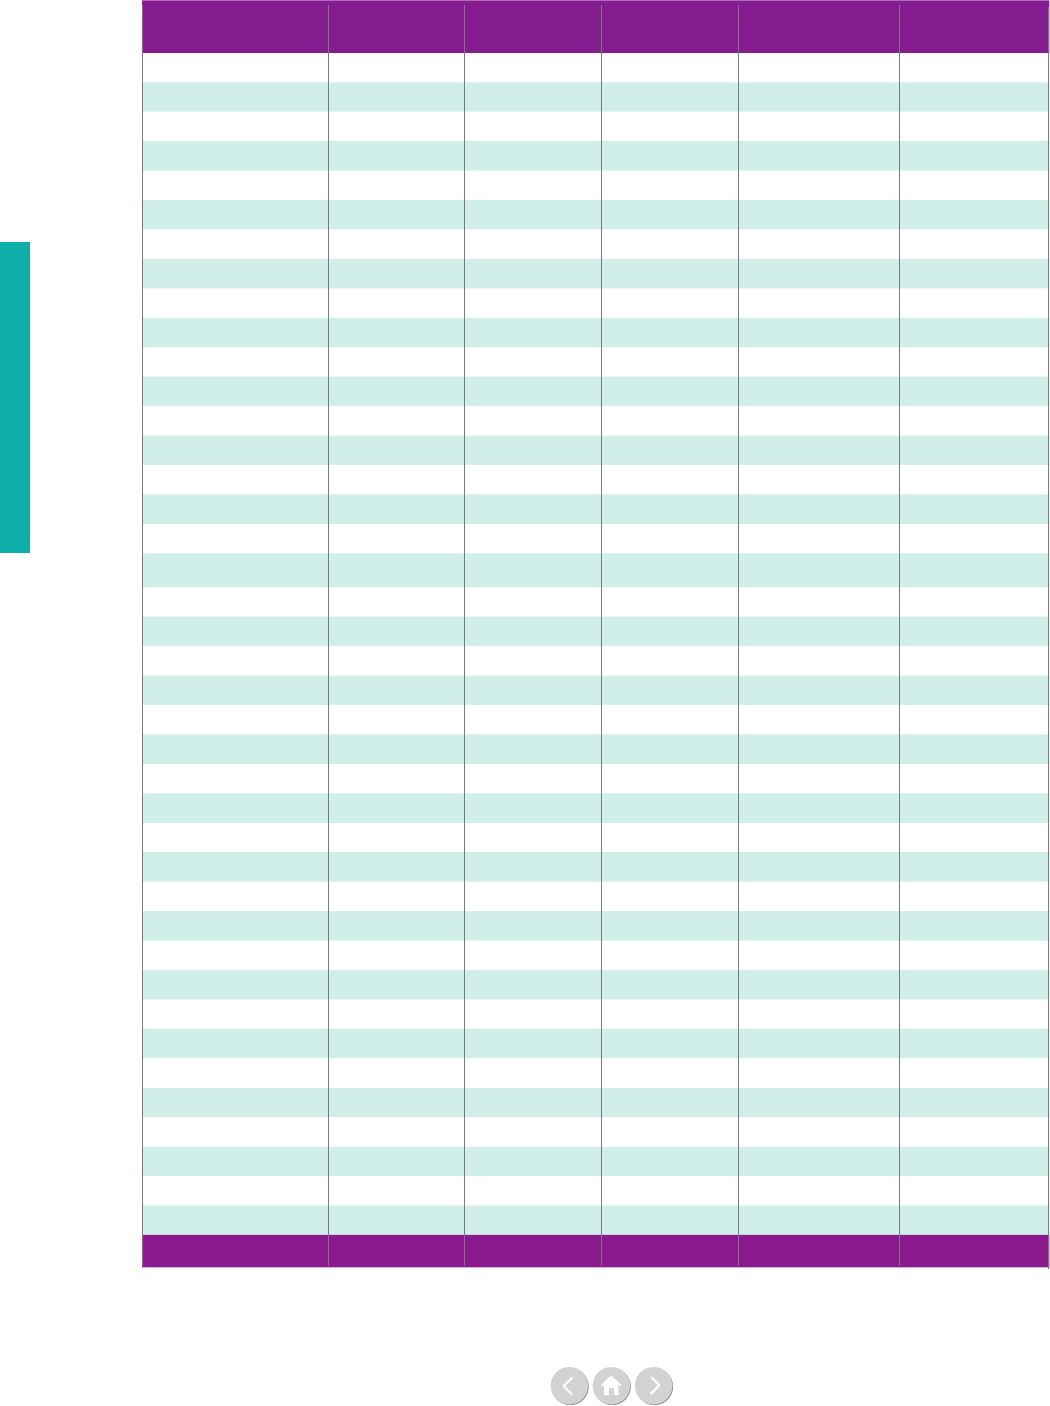
Total revenue of the UN system by entity and by financing instrument, 2017 (US$ million)
(Table 2a from Part One, Chapter One):
Source: see page 30
Entity Assessed
Voluntary
core
Earmarked
Fees and
other revenues
Total
revenue 2017
UN Secretariat
2,578 2,279 623 5,480
CTBTO
119 7 2 128
DPKO
7,853 343 79 8,276
FAO
474 751 39 1,264
IAEA
434 260 8 702
ICAO
80 114 22 216
ICC
167 2 0 170
IFAD
306 104 9 419
ILO
370 293 21 683
IMO
41 7 19 67
IOM
49 15 1,450 100 1,615
ITC
35 29 62 1 127
ITU
125 1 10 47 183
PAHO
102 614 716 1,433
UNAIDS
173 52 8 233
UNCDF
10 47 3 60
UNDP
647 4,245 344 5,236
UNEP
199 443 25 668
UNESCO
316 261 71 648
UNFCCC
31 2 38 15 86
UNFPA
350 718 93 1,160
UN-HABITAT
14 3 142 11 169
UNHCR
48 703 3,445 31 4,227
UNICEF
1,278 5,153 146 6,577
UNIDO
80 256 3 339
UNITAR
0 32 0 33
UNODC
31 4 342 15 391
UNOPS
834 834
UNRISD
2 0 2
UNRWA
625 559 55 1,239
UNSSC
4 7 0 11
UNU
49 58 107
UN Women
8 146 214 10 379
UNWTO
16 3 5 24
UPU
37 17 16 69
WFP
391 5,609 431 6,431
WHO
457 81 2,058 179 2,775
WIPO
18 1 11 392 423
WMO
70 5 17 2 94
WTO
200 21 2 224
Total 13,953 4,776 30,035 4,435 53,200
Table
2a
12
Executive summary
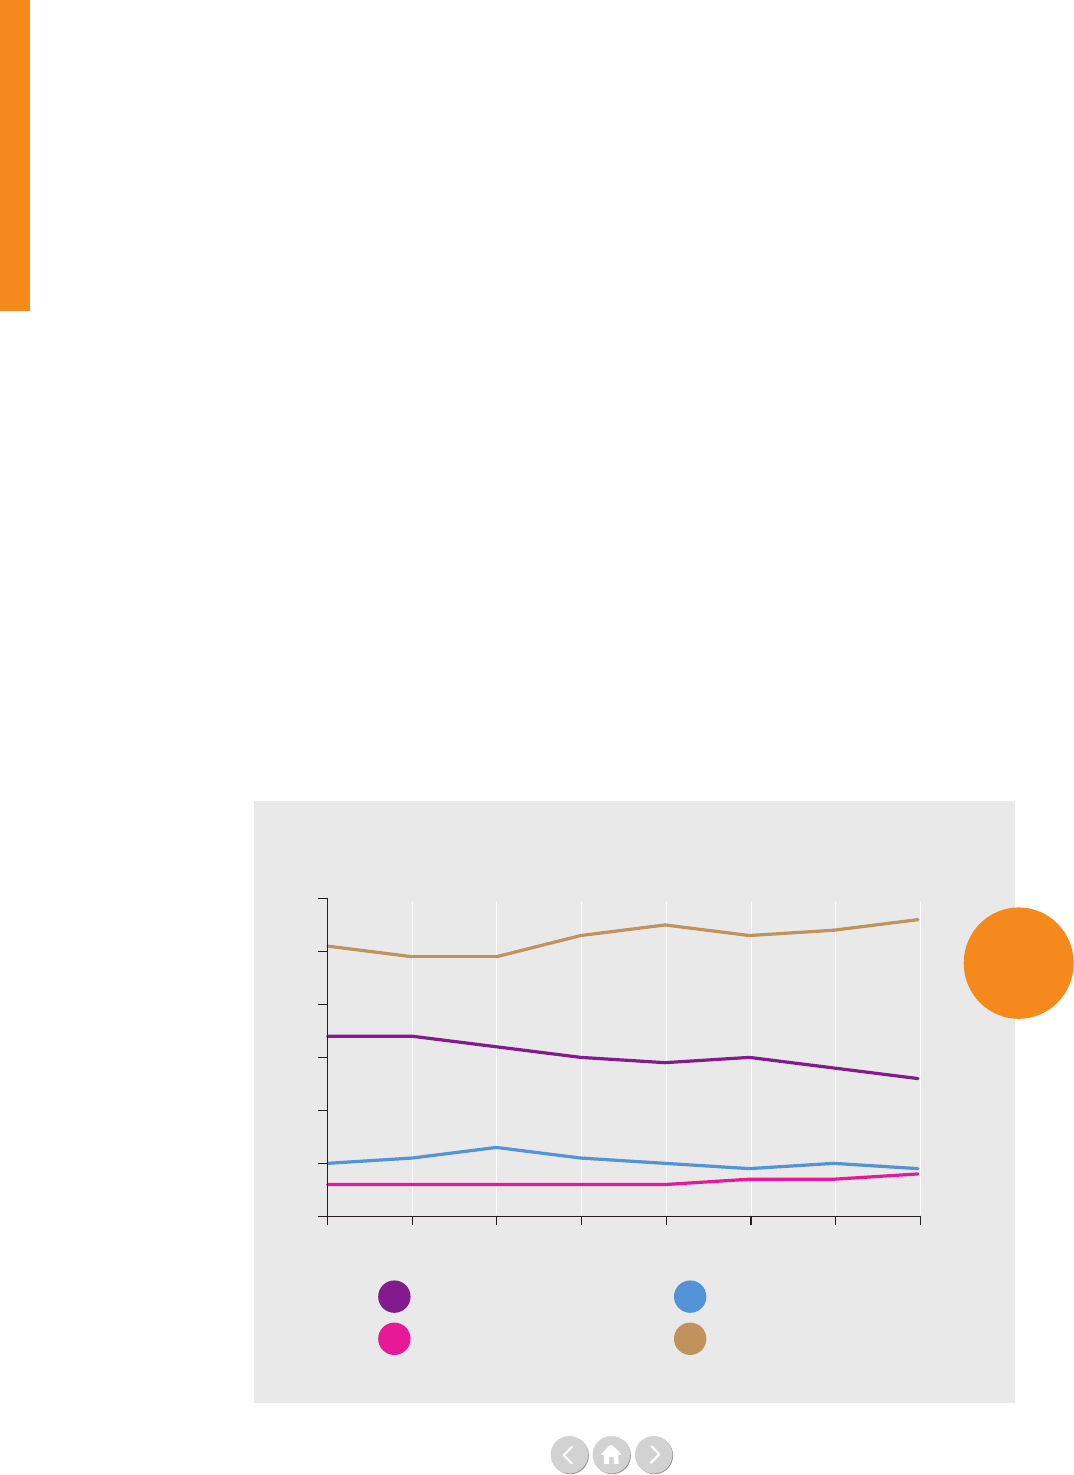
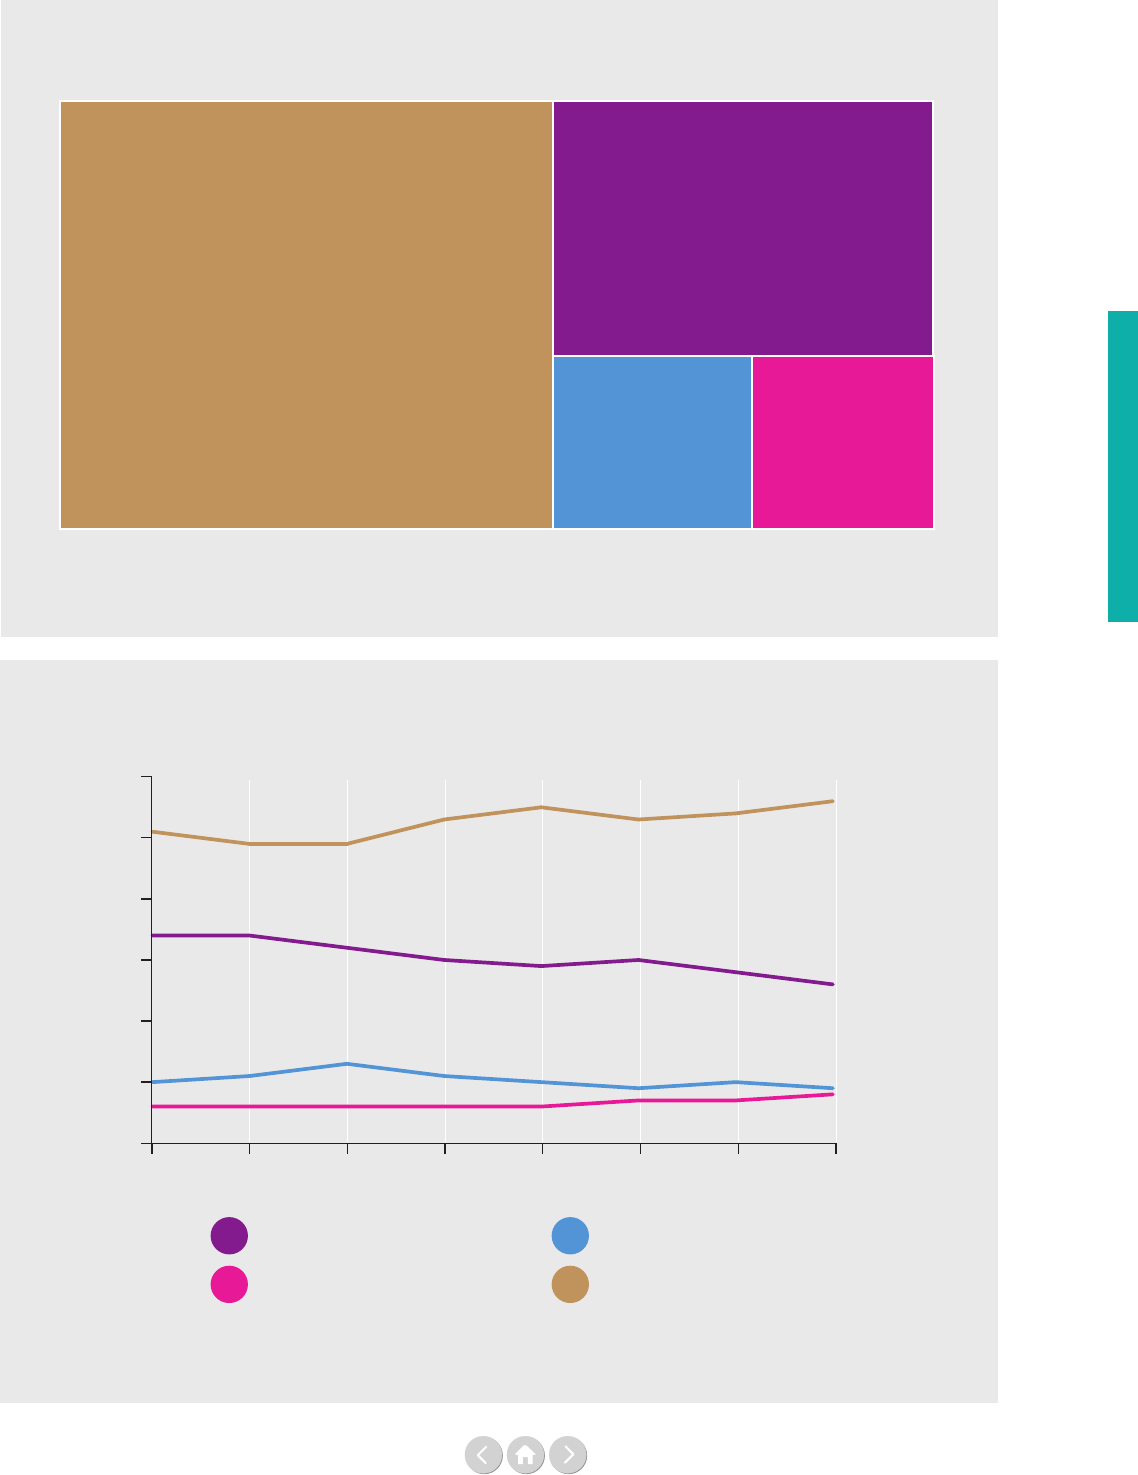
Distribution of total UN system revenue, by financing instrument, 2010–2017
(Figure 2 from Part One, Chapter One):
Source: see page 29
How these UN entities are nanced inuences how they
operate, and in 2017 more than half of all UN revenue
was earmarked to a certain degree (57%). This is a three
percentage point increase since the previous year and is
part of a long-term trend in UN nancing, which has
seen a relative decline of the more exible contributions
(assessed and voluntary core) and a relative shift towards
the more constrained earmarked contributions. In 2017,
voluntary core contributions decreased by one percent-
age point to 9%, which almost equalled the 8% that
came from ‘fees and other revenues’ (Figure 2).
Meanwhile, assessed contributions amounted to 26%.
The next question is what part and which revenue
streams of the UN are growing? The UN’s overall revenue
growth has been concentrated in UN Operational
Activities for Development (UN-OAD), which grew
from US$ 29.5 billion in 2016 to US$ 33.6 billion in
2017 (UN non-OAD activities decreased slightly from
US$ 19.8 to 19.6 billion). It is, however, specically the
earmarked resources for UN-OAD that have increased
(from US$ 23.1 to 26.7 billion). A closer look at the
levels of earmarked contributions to each UN entity
(as well as assessed contributions) is detailed in the full
report, and it shows, for example, that in 2017 for seven
UN entities, over 80% of their funding was earmarked.
Having looked at the revenue streams into the dierent
UN funding instruments, the report also examines what
is being funded in the UN. Figure 5 shows 32% of the
funding in 2017 went to humanitarian assistance, which
is a growth of four percentage points compared to the
previous year. The relative share of funding for develop-
ment and peacekeeping has remained stable, while the
category of global norms, standards, policy and advocacy
has decreased by four percentage points compared to
2016. A note of caution before drawing too many
conclusions: the decrease in the category of global norms
is more linked to denitional and methodological issues
than with the UN investing fewer resources in its
normative mandates.
If we now turn to how the UN ts into the funding
picture of the broader multilateral system we see in
Figure 10 how important the UN is as a multilateral
channel. Indeed, the UN remains the largest channel of
multilateral assistance from countries part of the
Organisation for Economic Co-operation and
Development’s Development Assistance Committee
(OECD-DAC) with US$ 20.9 billion in contributions
in 2017, which represents 33% of the total (see Figure 9
on page 39).
In Figure 10 we also see major funding dierences and
trends between the multilateral institutions. Higher levels
of earmarking compared to core funding distinguish the
UN system from other multilateral institutions. More-
over, the share of earmarking has increased substantially
in the UN in recent years. In 2017, of the US$ 20.9
billion of multilateral aid channelled through the UN
development system, 71% was earmarked, against 64% of
the US$ 16.6 billion in 2013.
0%
10%
20%
30%
40%
50%
60%
57%
26%
9%
8%
Assessed contributions
Fees and other revenues
Voluntary core contributions
Earmarked contributions
2016
2014
2012
2017
2015
2013
2011
2010
Figure
2
13
Executive summary
Executive summary
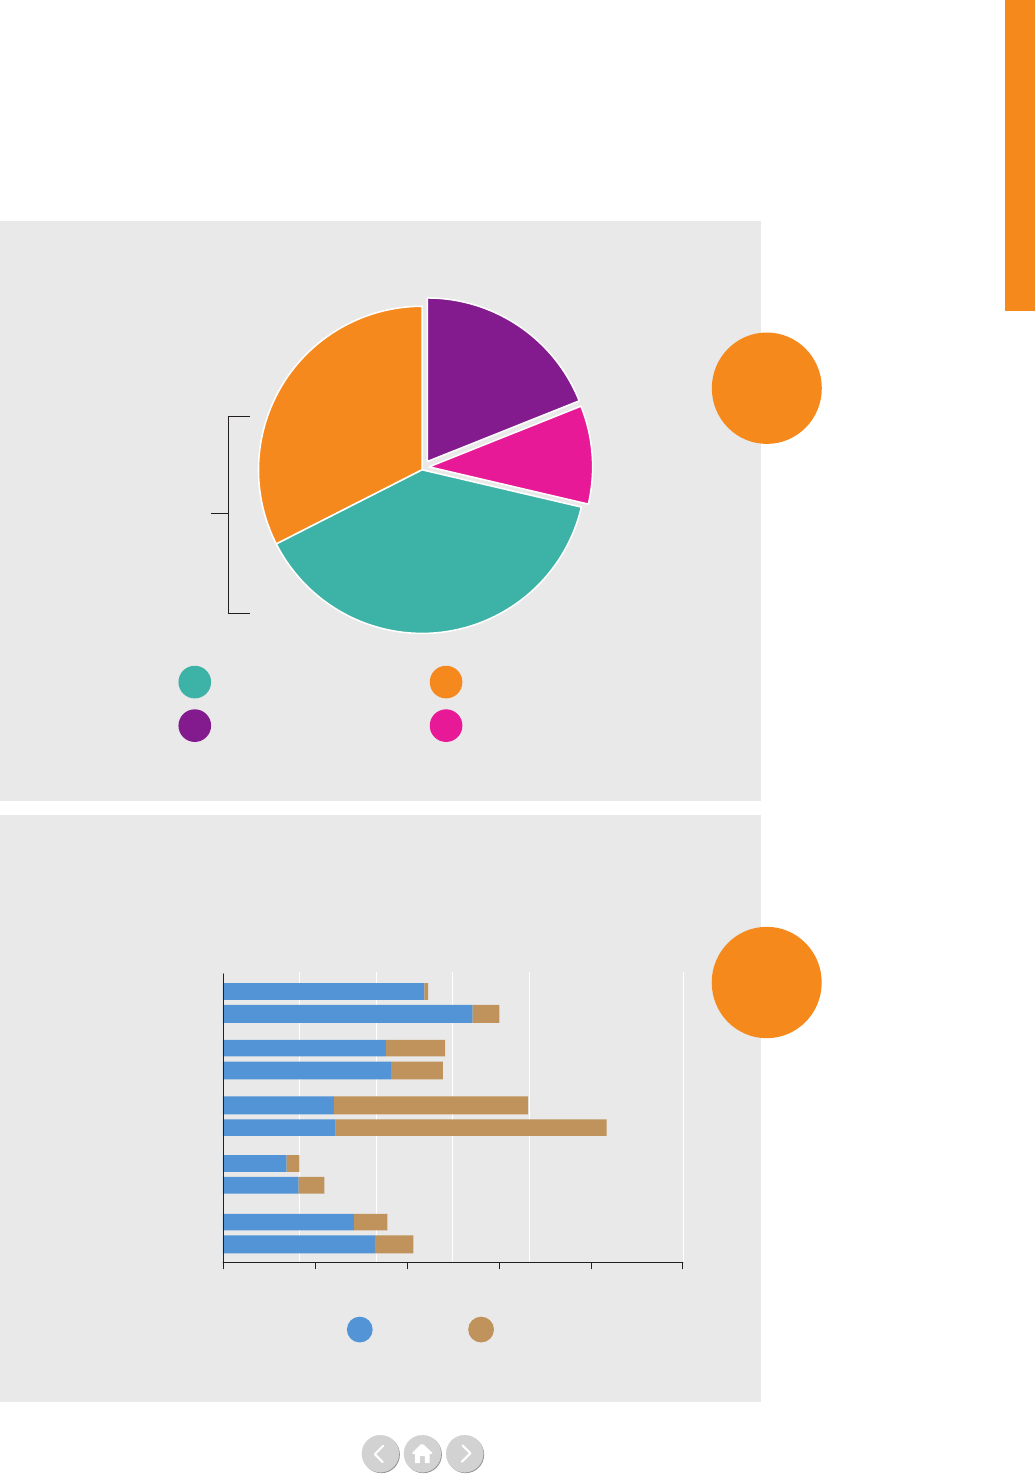
Funding of UN system-wide activities, 2017
(Figure 5 from Part One, Chapter One):
Source: see page 36
Channels of total multilateral assistance from OECD-DAC countries,
core and earmarked, 2013 and 2017 (Figure 10 from Part One, Chapter One):
Source: see page 40
Operational activities
for development 71%
19%
32%
39%
10%
Development assistance Humanitarian assistance
Peacekeeping Global norms, standards,
policy and advocacy
0 5 10 15 20 25
Other multilateral institutions
Regional development banks
UN development system
World Bank Group and
International Monetary Fund
European Union institutions
15.0
11.2
12.1
12.0
4.2
5.5
9.0
10.4
16.6
20.9
US$ billion
Earmarked
Core
2013
2017
2013
2017
2013
2017
2013
2017
2013
2017
A more detailed ve-year multilateral funding trend can
be seen in Table 5 in Chapter One of the full report.
This data does, however, not capture the whole picture
with regards to trends in Ocial Development
Assistance (ODA) funding, since contributions from
OECD-DAC members to multilateral organisations
represented only around 41% of total ODA in 2016.
Figure
5
Figure
10
14
Executive summary
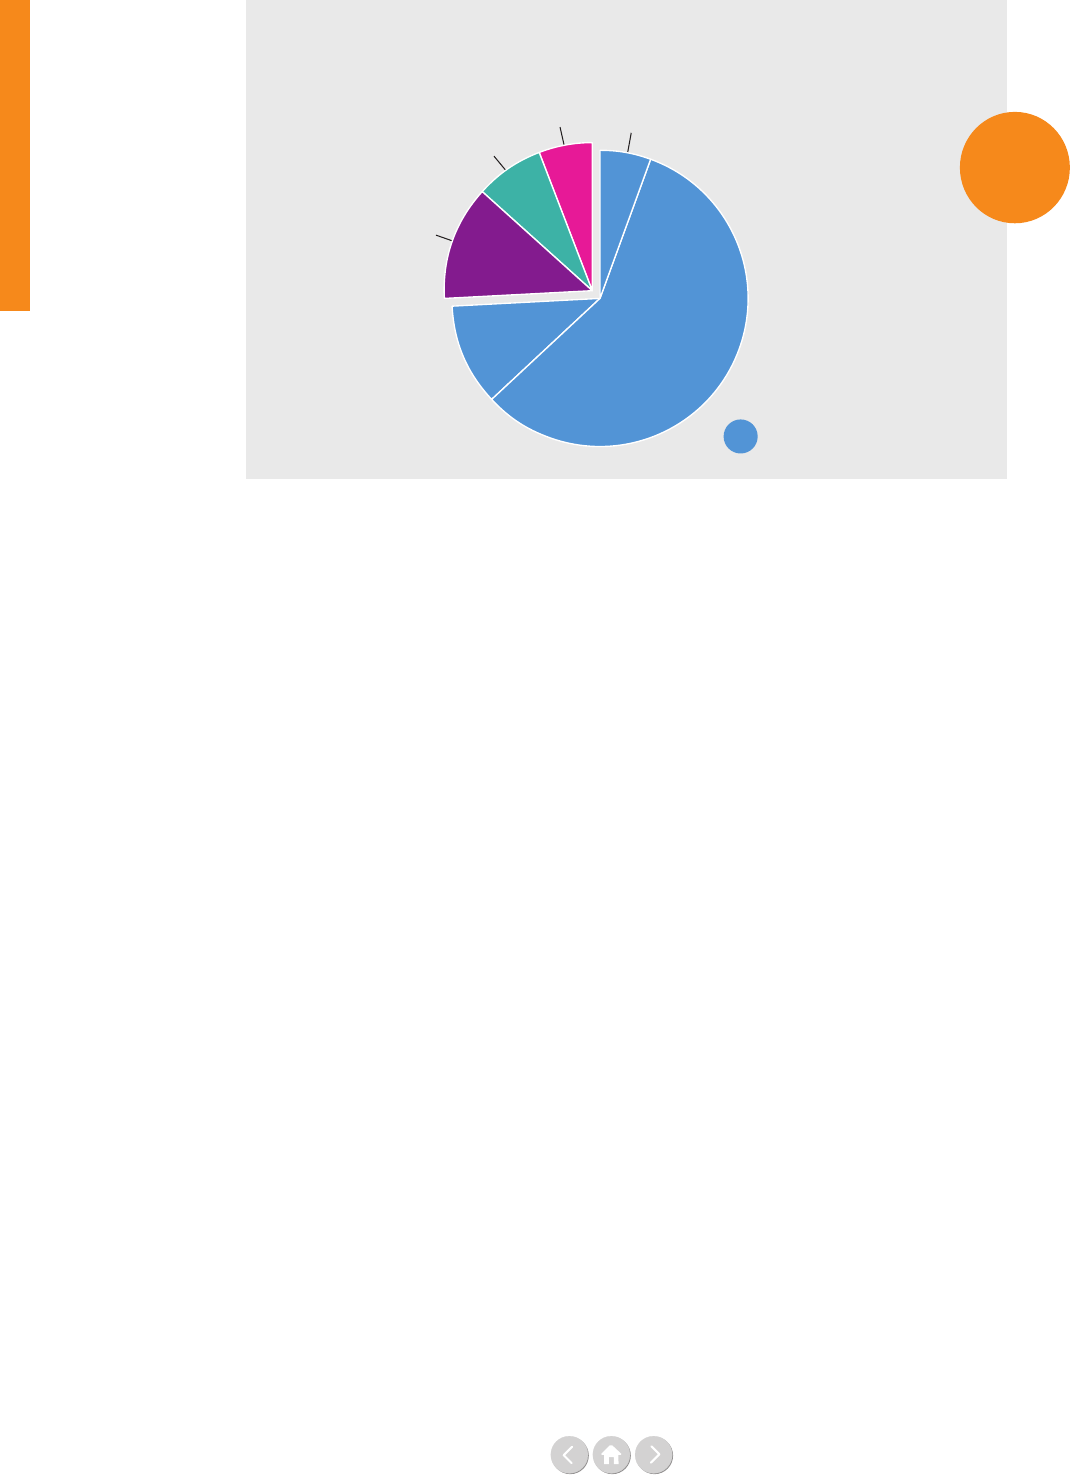
Funding sources for UN operational activities, 2017
(Figure 11 from Part One, Chapter One):
Source: see page 41
Inter-agency pooled funds
6%
Vertical funds
6%
European Union institutions
7%
NGO, private and others
13%
non OECD-DAC
11%
OECD-DAC
57%
Governments 74%
group of countries, which was 7% of the total of contri-
butions to UN operational activities. Compared to 2016,
China has increased its funding the most in nominal terms
and of the same group, Qatar increased its funding most
in relative terms. Local resources, which are contributions
from programme countries in support of their own
development framework, are depicted separately. They
have only been added after the top 12 non OECD-DAC
contributors were identied.
In this year's report we bring back our 2017 analysis of
levels of funding that individual UN Member States are
contributing to six UN entities, United Nations Develop-
ment Programme (UNDP), United Nations High
Commissioner for Refugees (UNHCR), UNICEF,
United Nations Relief and Works Agency for Palestine
Refugees in the Near East (UNRWA), World Food
Programme (WFP) and WHO. It specically shows how
much the top ten OECD-DAC and top ten non OECD-
DAC countries contribute to each of the entities above in
core and earmarked funding. A visual comparison can be
found on pages 50-51 (Figures 29-32). While all ten of
the OECD-DAC countries contribute core resources to
all six entities, the total portfolio of core contributions is
not dominated by one single entity.
Finally, this chapter also takes a closer look at the use and
scale of UN inter-agency pooled funds. In Figure 34 (page
16) we see the top 12 contributors to these funds and the
share of earmarked resources they channel through pooled
funds. It points to the need to increase the funding to this
type of nancial instrument if the target set in the recent
Funding Compact is to be met (doubling of contributions
to UN inter-agency pooled funds by 2023).
So, knowing that OECD-DAC countries channel a
signicant part of their ODA funding into the UN, how
much of the overall UN funding pie is that? Who are the
other funders of the UN? As we can see in Figure 11,
governments constituted 74% of the direct funding to
the UNDS with 57% coming from OECD-DAC
countries and 11% from non OECD-DAC countries.
Indirectly governments also funded the UNDS via
eg the European Union (EU) institutions and in-part via
UN pooled and vertical funds. An equal share of 6% of
total funding to the UNDS was channeled through UN
inter-agency pooled funds and vertical funds.
While non-state contributions are growing signicantly as
sources of revenue for the UN (from 9% in 2016 to 13%
in 2017), they remain a relatively small source of revenue
for most UN entities (a visual breakdown of the non-state
funding for six UN entities is provided in the report).
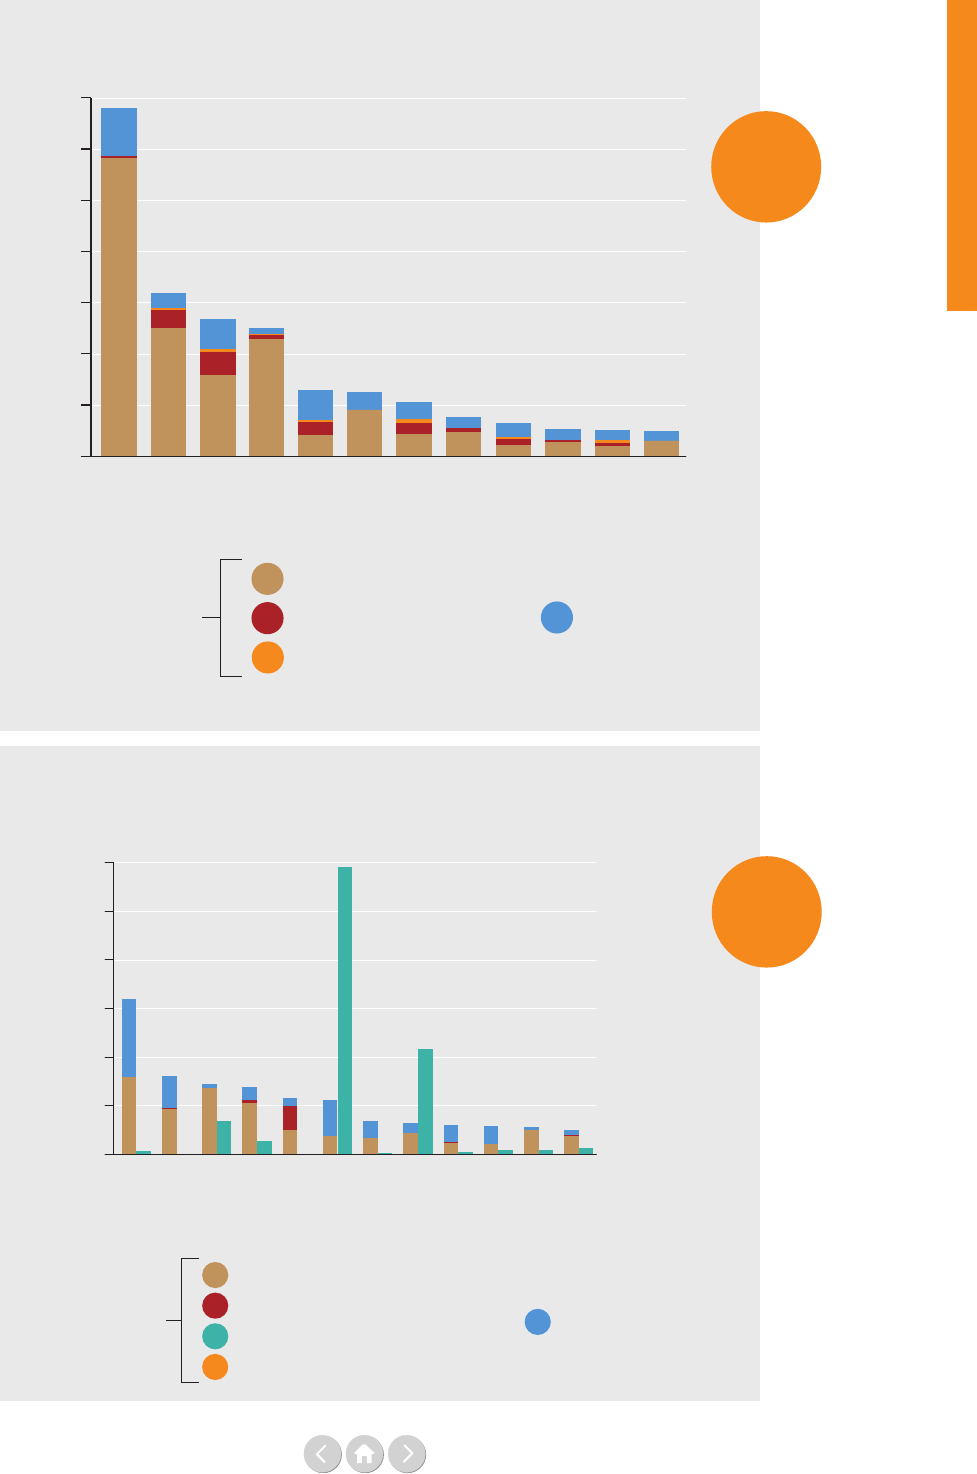
In fact, the majority of contributions to UN operational
activities come from a small group of Member States.
Figure 25 shows the funding mix of the top 12 OECD-
DAC contributors, with contributions broken down into
core, inter-agency pooled funds, single-agency
thematic funds, and other earmarked funds. In 2017,
these top OECD-DAC members provided 65% of the
total contributions for UN operational activities and in
the past ve years this share has grown four percentage
points (from 61% in 2013).
This analysis is complemented by an investigation into the
funding mix of non OECD-DAC countries, (Figure 26). It
shows that the top ve countries: China, Russian Federa-
tion, Colombia, Saudi Arabia and Qatar, contributed 51%
of the total funding (excluding local resources) from this
Figure
11
15
Executive summary
Funding mix of the top 12 OECD-DAC members to UN operational activities, 2017
(Figure 25 from Part One, Chapter One):
Funding mix of the top 12 non OECD-DAC countries contributing to
UN operational activities, 2017
(Figure 26 from Part One, Chapter One):
Source: see page 45
Source: see page 46
Single-agency thematic funds
US$ million
Inter-agency pooled funds
Local resources
Earmarked excluding pooled and thematic funds
Total earmarked
Pakistan
India
United Arab Emirates
Qatar
Colombia
China
Kuwait
Mexico
Argentina
Brazil
Saudi Arabia
Russian Federation
0
100
200
300
400
500
600
Core
0
1
2
3
4
US$ billion
5
6
7
= total core
14%
9%
22%
5%
44%
28%
31%
27%
42%
41%
37%
39%
Inter-agency pooled funds
Earmarked excluding pooled
and thematic funds
Single-agency thematic funds
Total earmarked
Denmark
Netherlands
Canada
Japan
United Kingdom
EU institutions
United States
Italy
Switzerland
Norway
Sweden
Germany
Core
Figure
25
Figure
26
16
Executive summary
Deposits to UN inter-agency pooled funds from the 12 largest contributors,
and share of their total earmarked contributions to the UN, 2017
(Figure 34 from Part One, Chapter One):
Source: see page 53
US$ million
0 10050 200150 250 300 400350 450
United Kingdom
Germany
Sweden
Norway
Netherlands
Canada
Ireland
Belgium
Denmark
Qatar
Australia
United States
19%
12%
30%
26%
29%
12%
50%
28%
17%
45%
1%
12%
% = inter-agency pooled fund
share of total earmarked
contributions
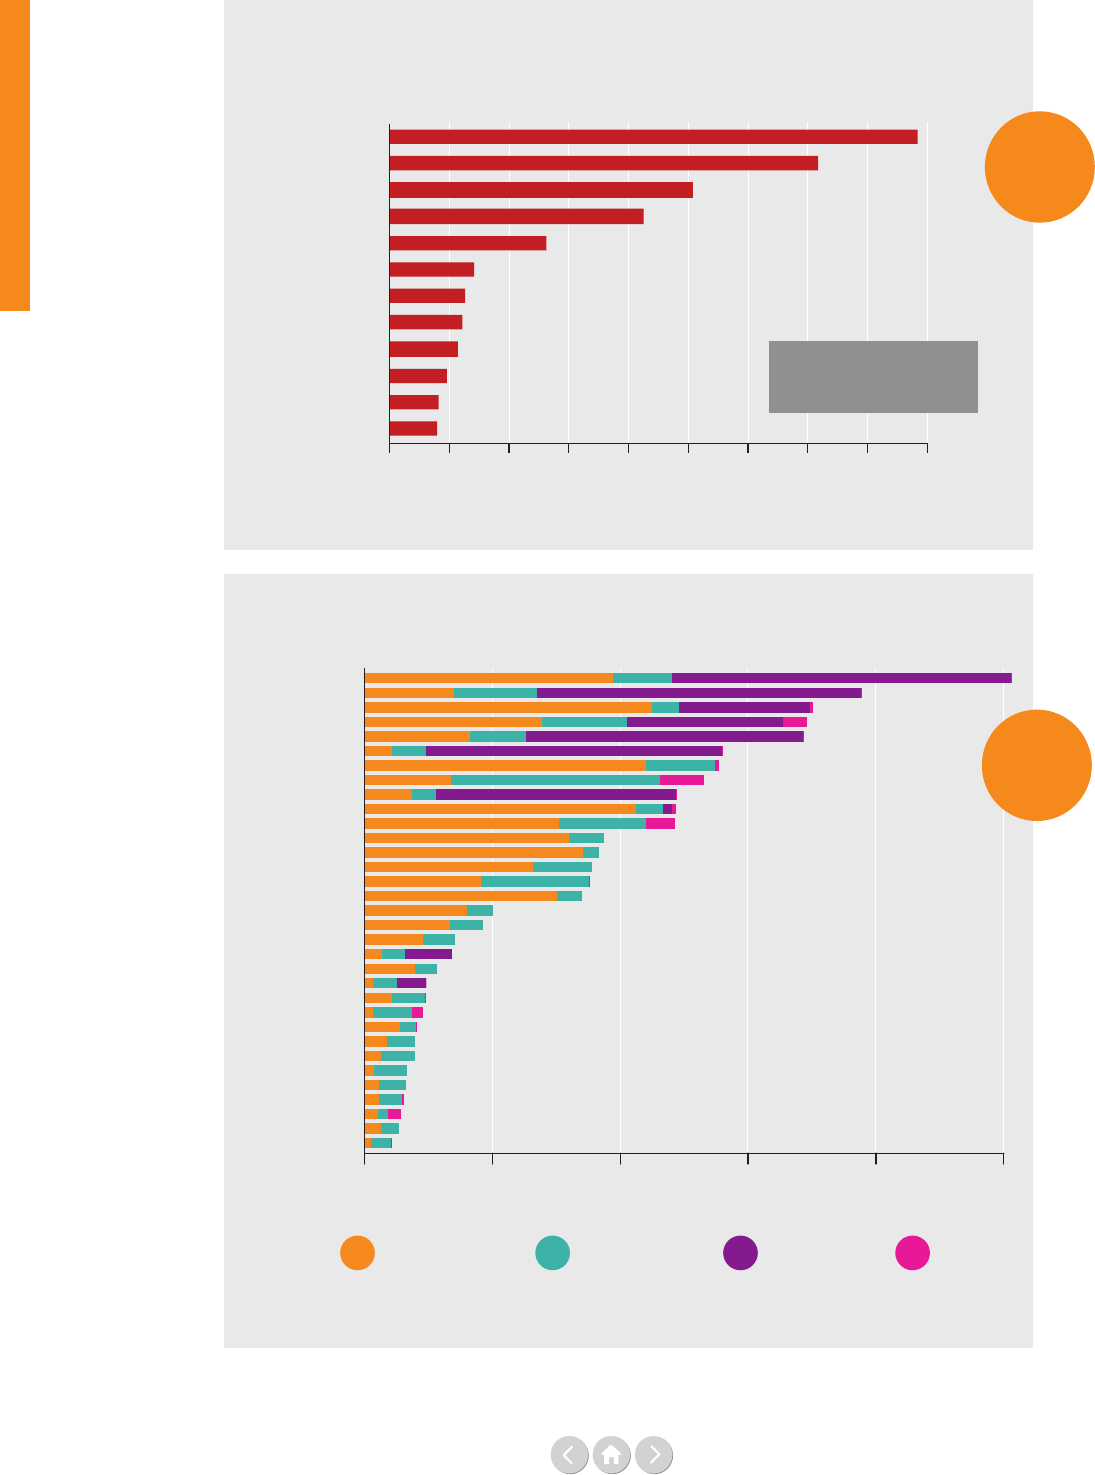
UN operational and peace related expenditure in crisis-affected countries, 2017
(Figure 38 from Part One, Chapter One):
Source: see page 57
US$ billion
South Sudan
Dem. Rep. of the Congo
Lebanon
Somalia
Sudan
Mali
Yemen
Afghanistan
Central African Rep.
Syrian Arab Rep.
Iraq
State of Palestine
Jordan
Ethiopia
Nigeria
Turkey
Uganda
Kenya
Chad
Haiti
Niger
Liberia
Myanmar
Colombia
Cameroon
Egypt
Ukraine
Sierra Leone
Senegal
Burundi
Libya
Madagascar
Côte d’Ivoire
0 0.5 1.0 1.5 2.0 2.5
Peace DPAPeace DPKODevelopment
Humanitarian
Figure
38
Figure
34

17
Executive summary
The report also discusses the newly adopted ‘UN Funding
Compact’ and its mutual commitments between the UN
and Member States. The core idea of the Funding Compact
is to give incentives for Member States to contribute more
qualitatively, exibly and predictably, alongside incentives
for UN development entities to increase coherence, co-
operation and transparency and make full use of eciency
gains. Several aspects of the Funding Compact are discussed
in Part One as well as in a separate contribution by Silke
Weinlich and Bruce Jenks in Chapter Two of Part Two.
Chapter Two: Expenditure
The second chapter of the report examines the expen-
diture of the UN. It provides the global picture of UN
operations in nancial terms and supplies historical data
by each UN entity, as well as expenditures by region
and by income status. It shows that among UN entities
Department for Peacekeeping Operations (DPKO), WFP,
the UN Secretariat, UNICEF and UNDP had the largest
share of expenditures in 2017.
Meanwhile, in 2017 Africa continued to be the region
with the proportionally highest UN expenditures (35%),
followed by Western Asia (23%), Asia and the Pacic
(13%), Americas (10%) and Europe (3%). Global expendi-
ture, which includes global normative work, programme
support, management and administration, constituted
17% of all UN expenditure.
With regards to UN expenditure by income status, we see
it is concentrated in low-income countries, and 48% of
the total country-level expenditure in 2017 took place in
this group of countries. Expenditure in the group of 50
countries dened as crisis-aected was in total 76% of the
total country-level operational expenditures the same year.
Figure 38 provides an interesting comparison between
expenditures on development, humanitarian, and peace and
security-related operations in these crisis-aected countries.
The gure shows that South Sudan, Democratic Republic
of Congo, Lebanon, Somalia and Sudan are the top ve in
terms of UN funding for crisis-aected countries; together
they constituted US$ 9.7 billion in expenditures or 19% of
the total UN system-wide expenditure in 2017. The rst
ten crisis-aected countries represented 31% of the UN’s
total expenditure – illustrating the concentration of the
UN’s work.
Overall, for this group of 50 crisis-aected countries, 24%
of the expenditure is dedicated to development assistance,
27% is dedicated to peace and security-related activities,
while 49% is dedicated to humanitarian activities.
Chapter Three: Moving ahead on data quality
Chapter Three discusses the quality issues of nancial
data and the adoption of new UN data standards. It
examines why these are crucial for our analysis and for
explaining correctly the nancial eco-system of the UN.
It also scrutinises which nancial data challenges have
been solved and what remains to be done.
It notes that most of the data analysis issues are linked
to the limitations of the two existing UN system-wide
datasets used as the main data sources for Part One.
The data comes from the CEB and the United Nations
Department of Economic and Social Aairs (UNDESA)
and these two parts of the UN system did not – up until
recently – share a common system of data governance or
a shared set of denitions. This means that the 2017 data,
used for this report and largely collected in May 2018,
has systemic aws, including dierent denitions and no
common rules for aggregating and analysing data.
However, the UN has awoken to the importance of
having good quality, system-wide nancial data. This
is clear by the major eorts made by the UN over the
past two years to improve its nancial data through the
Data Cube Initiative, which was jointly led by the CEB’s
High Level Committee on Management and the United
Nations Sustainable Development Group.
The main result was the adoption of a set of six data
standards for UN-system wide nancial reporting in the
fourth quarter of 2018. A roadmap for implementing the
data standards has also been developed. The introduction
of the data standards is not only expected to improve
data quality, but also to have a positive impact on trans-
parency and accountability as access to quality nancial
data will be improved through an online data platform.
Nonetheless, the introduction of data standards is not
the end, but rather the beginning of a longer process
of improving the UN’s system-wide nancial data.
Much more will need to be done, but this is an
encouraging start.
18
Executive summary
Funding of the UN system-wide activities, 2016
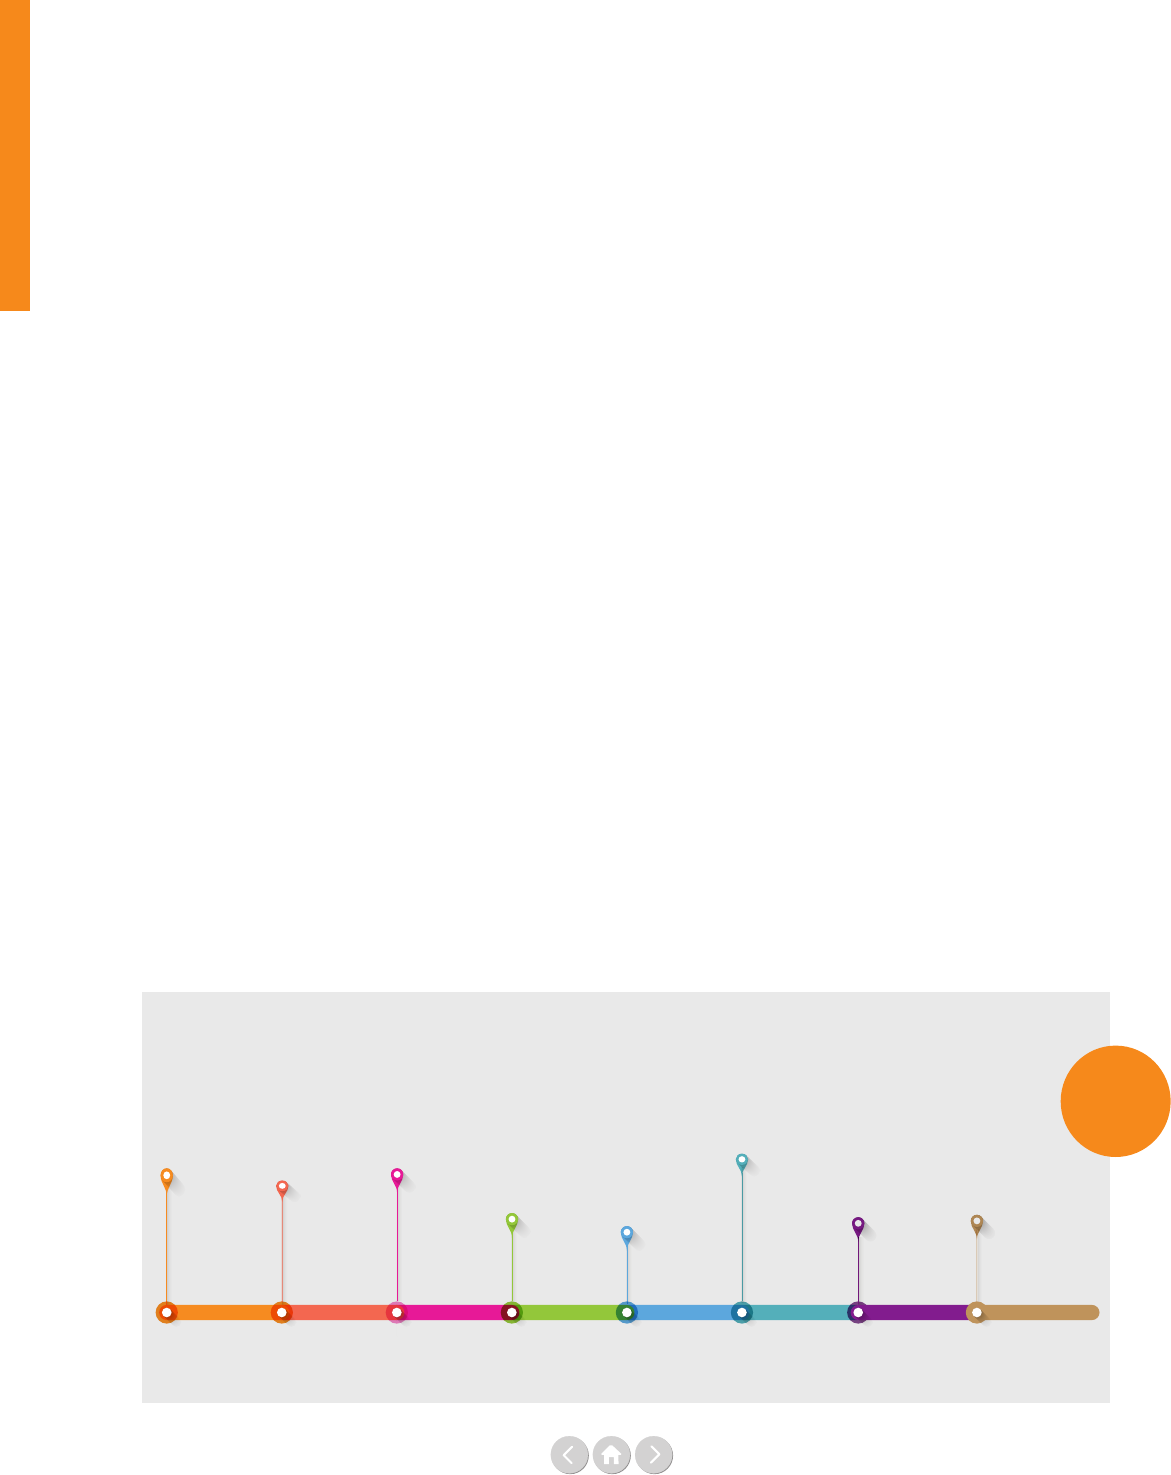
(Figure 2 from Part Two, Chapter One: International financing of the Sustainable Development Goals):
The compressed current cycle of replenishments
THE AFRICAN
DEVELOPMENT
FUND
(4th working group
meeting May 22,
2019, hoped for
funding upwards
of US$ 10 billion)
THE
INTERNATIONAL
DEVELOPMENT
ASSOCIATION
19th replenishment
- IDA 19
(pledging session,
December 2019,
funding ask upwards
of US$ 23 billion)
THE
INTERNATIONAL
FINANCE
FACILITY FOR
EDUCATION
(pledging session,
ask about
US$ 2 billion)
3rd GAVI
REPLENISHMENT
(upwards of
US$ 7.5 billion)
2019
2019 2019
2019 2019 2019
THE GREEN
CLIMATE FUND
(funding upwards
of US$ 10 billion)
2020
May
THE GLOBAL
FUND
(6th replenishment,
funding ask
US$ 14 billion)
October
September
INTERNATIONAL
FUND FOR
AGRICULTURAL
DEVELOPMENT
(12th replenishment
first consultation
session, funding
ask about
US$ 1.4 billion)
April
Autumn December mid-2020
THE GLOBAL
PARTNERSHIP
FOR EDUCATION
(upwards of
US$ 2.3 billion)
2020
Autumn
Key findings Part Two:
Financing flows impacting
the Sustainable Development Goals
The second part of the report is organised into four
chapters where guest contributors discuss some of the
key challenges facing development nance today.
Chapter One:
Financing the 2030 Agenda: The big picture
In Chapter One, contributors were invited to look at the
big picture of development nance against the backdrop
of the 2030 Agenda. Homi Kharas provides an overview
of the state of cross-border nancing of the SDGs. These
are dened as the nancing ows to developing coun-
tries that likely nance investments related to the SDGs.
He sees a signicant increase, largely due to private
ows, but notes that these private ows are volatile and
not a full substitute for aid. His concluding analysis looks
at the net impact of nancial inows and outows
together and notes that the International Monetary
Fund’s (IMF) most recent forecast for net ows to
developing countries in 2019 is actually zero. He also
notes that in 2019 and 2020, a period when aid budgets
will be tight, the replenishment cycles of several large
multilateral agencies are overlapping, so aid for one
entity might result in reduced aid for another (see the
gure below).
This is followed by a contribution from Fiona
Bayat-Renoux, outlining the Secretary-General’s strategy
for nancing the 2030 Agenda. She sees current invest-
ment levels are far from the scale and speed required, but
stresses that the resources and capacity available today
can close the existing investment gap. She notes that the
UN has a long history of supporting Member States on
nancing for development.
Navid Hanif and Philipp Erfurth focus on the need to
change the narrative from identifying investment gaps to
promoting investment opportunities. Rather than a gap
lling exercise, investment in sustainable development
needs to be seen as an exercise in matching investments
with investors. They argue that there is a need to change
mind-sets and perceptions both on the supply and the
demand sides.
For Ambassador E. Courtenay Rattray, achieving the
objectives of the 2030 Agenda and the targets of the
Paris climate agreement requires a massive, global
programme of investment in real assets and sustainable
infrastructure. Beyond establishing new partnerships
between the public and private sectors, as with others,
he stresses the critical engagement needed by
institutional investors. He wants to see Member States
taking concrete action and in this regard, he describes
the launch of the Closing the Investment Gap initiative
(the CIG initiative).
John W. McArthur takes us back to the country level
in his paper entitled ‘Bye-bye, billions to trillions’. He
argues that if normal global economic growth trends
continue until 2030, SDG government spending will
grow on its own by US$10 trillion per year, which more
than covers the needed incremental investment cited in
the SDG context. Bearing this in mind he argues that
the focus needs to shift from volume to purpose and
distribution.
Pedro Conceição’s paper explores the relevance of
science, technology and innovation policy in relation to
the 2030 Agenda and how they will shape inequality.
Far from neutral, they may emerge as one of the most
consequential policy areas for inequality because of the
Figure
2
19
Executive summary
impacts of the incentives that exist to foster innovation.
The key idea is that this area has little to do with mobilis-
ing resources as such and more to do with the incentives
that shape creativity and innovation to advance science
and technology in a way that generates widely shared
benets.
Chapter Two:
Earmarking: Making smart choices
Chapter Two features a number of contributions that
explore how to go beyond the core vs earmarked
conundrum. The rst paper in this section by the UN
Multi-Partner Trust Fund Oce (MPTFO) provides
an overview of UN pooled funding and discusses some
of the advantages that pooled funding has to oer. The
paper makes a persuasive case that pooled funding can
provide quality funding and oers opportunities that
might otherwise not be available to the UN system.
This is followed by a paper by Max Bauman, Erik
Lundsgaarde and Silke Weinlich which explores some of
the advantages and disadvantages of non-core funding.
The paper calls for more attention to the best mix of
various forms of funding, which allows UN organisations
to play to their strengths.
A paper by Brian Elliott and Maximilian Sandbaek
provides an overview of WHO’s approach to strength-
ening its resource mobilisation eorts as part of its new
ve-year strategic plan. It links WHO’s resource strategy
with a range of initiatives it is taking, such as WHO’s rst
ever investment case, the formulation of a draft Global
Action Plan and the development of a draft global
resource mobilisation and partnership strategy. What has
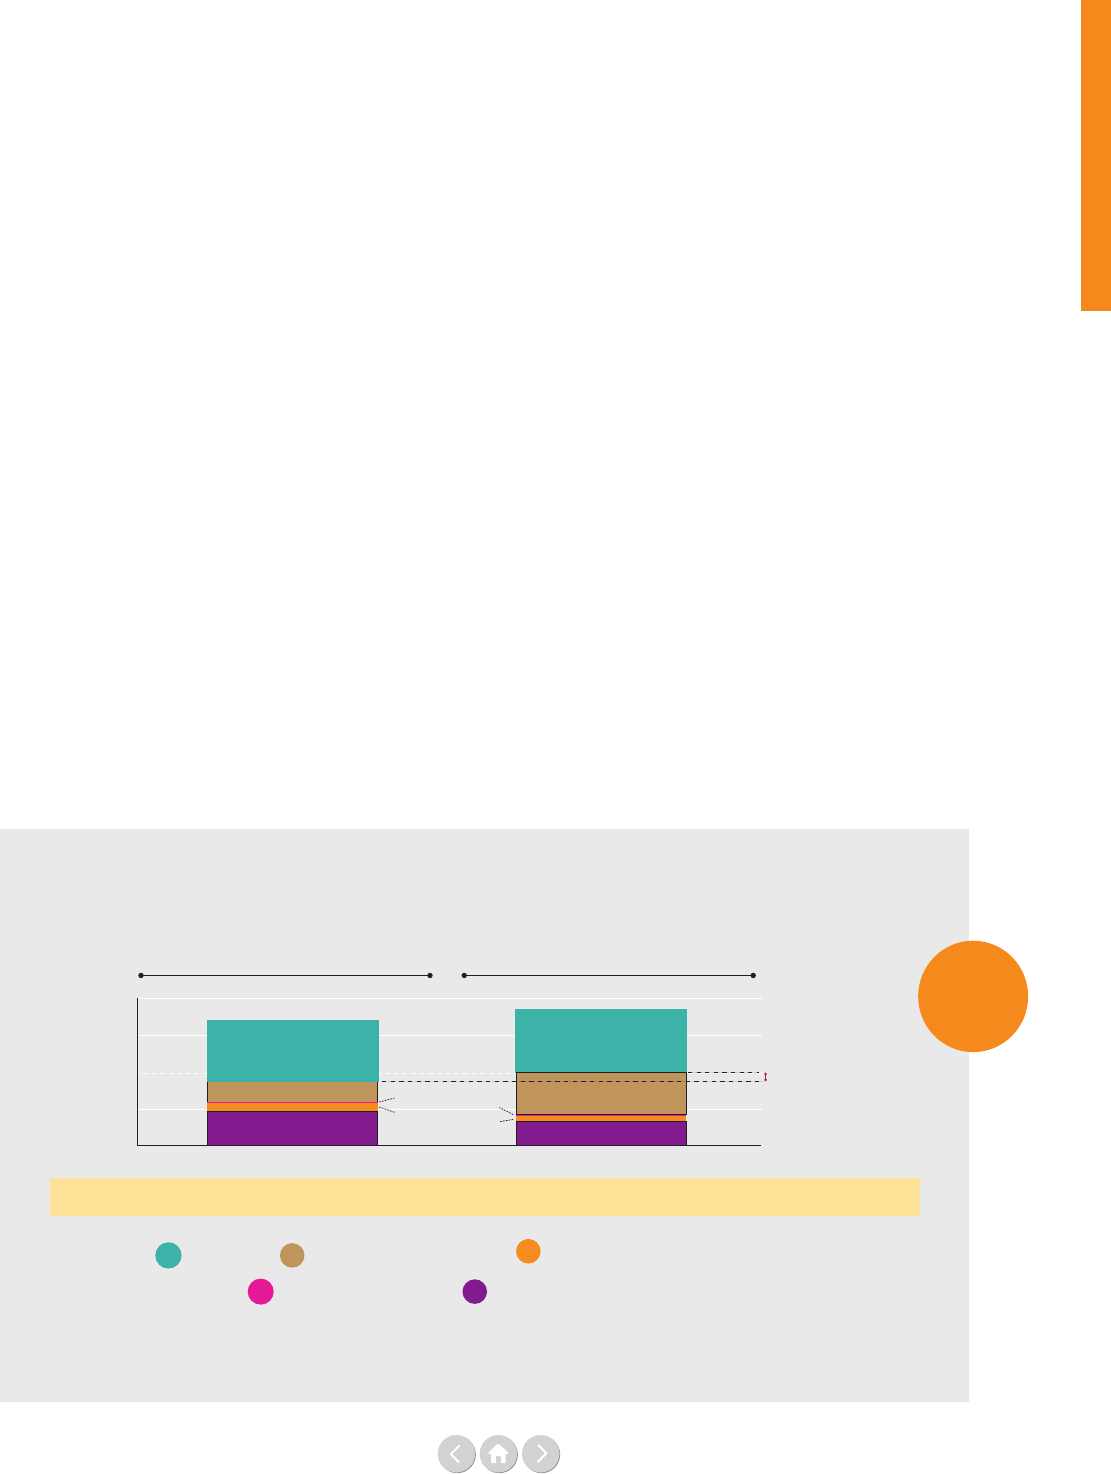
the impact of all these actions been so far? The current
nancial outlook for the approved Programme Budget
2020-2021 already shows an improvement (see Figure 3
below).
In his paper, Guido Schmidt-Traub shares lessons learned
from the experience of setting up the Global Fund
to ght AIDS, Tuberculosis and Malaria, which was
launched in January 2003. The paper argues that success
was made possible in large part due to the unique design
principles of the Global Fund and notes that they have
applicability and should be of great interest to sector
nancing mechanisms as a whole.
Finally, the paper by Silke Weinlich and Bruce Jenks
explores the implications of the UNDS reform process
on the growth of system-wide funding mechanisms. It
argues that the Secretary-General’s UNDS reform pro-
posals and the Funding Compact have put system level
funding back on the table as a fundamental component
of a reform agenda. The paper identies ve dierent
approaches to system-wide funding that merit close
attention and then details the dierent instruments that
comprise the Secretary-General’s Funding Compact.
How realistic is the budget increase for 2020-21? Comparison of projected financing levels
(Figure 3 from Part Two, Chapter Two: Improving the World Health Organization's financing):
Source: see page 114
4,000
3,400
2018-2019
2018-19 base budget
(as of Dec 2016)
2020-2021
2020-21 base budget
(as of Dec 2018)
48%
45%
23%
25%
18%
28%
1%
5%
5%
3,769
312.3
3,000
2,000
1,000
US$ million
Financing
levels
Shortfall
Voluntary contributions specified
Thematic and strategic engagement funds
Voluntary core contributions
Assessed contributions
Higher projected financing
levels can largely be explained
by increases from Germany,
the UK, the European
Commission, Japan and Gavi.
52% 55%
2%
Figure
3
20
Executive summary
Structure of a cat bond issued by the World Bank
(Figure 1 from Part Two, Chapter Three: World Bank catastrophe bonds as an innovative development financing tool):
Country
exposed to
natural risk
disaster
Insurance contracts Cat bonds
Capital market
World Bank
Investors
Investors
Investors
Chapter Three:
Financing peacebuilding, humanitarian
assistance and migration: Time to invest
Chapter Three explores ongoing eorts and innovative
approaches to strengthen nancing for peacebuilding,
sustaining peace, humanitarian assistance and migration
in times of greater needs. In the rst piece, the Dag
Hammarskjöld Foundation, argues that beyond the
need for additional resources for peacebuilding, a radical
rethink is needed on how nancing is structured and
how to leverage strong partnerships for more eective
resourcing. The paper outlines ten points to help frame
the issues that require attention and action by the UN
and its Member States.
Franck Bousquet highlights the success of the World
Bank’s International Development Association (IDA) 18
in addressing fragility, conict and violence (FCV). He
explains that the scale-up in IDA18 from US$7 billion
to US$14 billion for low-income countries impacted by
FCV has proven critical and has helped the World Bank
adapt a more tailored response to diverse situations
of fragility.
The third piece by Catherine Howell and Henk-Jan
Brinkman explores innovative nancing options for
peacebuilding. They call for caution and note that
innovative nance is unlikely to be a panacea that brings
the ‘quantum leap’ for the Peacebuilding Fund that the
UN Secretary-General has called for or raise the needed
resources for nancing peacebuilding more broadly. They
explain that donor contributions will remain at the heart
of peacebuilding nancing, certainly in the near term.
Ayham Al Maleh looks at 10 years of ODA ows to
peacebuilding, updating the ndings of a 2017 report
by the Institute of Economics and Peace and the UN’s
Peacebuilding Support Oce. Looking at OECD-DAC
data, the article notes that peacebuilding expenditures
remain a small, and declining, proportion of total aid
disbursement to all developing countries, although this
trend seems to be halting in the most recent years.
Building on the conviction that sustaining peace and
sustainable development are complementary and
mutually reinforcing, Laura Buzzoni and Henk-Jan
Brinkman present ndings from a portfolio review of
projects funded by the Peacebuilding Fund (PBF) from
2015 to 2018 and note that PBF has contributed 83% of
its total allocations to the SDGs.
The report also highlights OECD’s Total Ocial
Support for Sustainable Development (TOSSD) pilot
study on peace and security. The pilot is based on a
consultation with a wide range of experts and a deep
dive into one specic provider country’s support to
the security sector.
Given the importance to overcome the silos, the
MPTFO oers insight on a new generation of pooled
funds that are helping to bridge the humanitarian-
development-peace nancing divide. These exible
instruments are demonstrating that well-designed pooled
funds can quickly pivot when faced with rapidly
changing conditions on the ground. The article argues
that they improve cost-eciency, transparency and
collective outcomes not only by pooling resources
and delivery systems, but also by sharing, and thereby
reducing, the risks that often arise in highly volatile and
unpredictable settings.
Looking concretely at humanitarian nancing and
natural disasters, Ambassador Lana Zaki Nusseibeh
explains the advantages of ‘forecast based nancing’ as a
new preventive tool for humanitarian response to
climate change. The article notes that while it is not
Figure
1

21
Executive summary
going to eliminate what is often a US$ 10+ billion
annual gap in humanitarian nancing, it could provide,
for the rst time, a very concrete and politically feasible
way to do what the UN and international humanitarian
system struggle to grapple with: prevent rather than react.
Continuing in the area of disaster risk management,
Michael Bennett and Rebeca Godoy of the World Bank
explain the advantages of a Cat Bond, which is a unique
type of loan that is designed to provide immediate
liquidity to countries following a natural disaster
(see Figure 1 on the previous page).
And lastly, Jonathan Prentice looks at ways in which the
recently adopted Migration Compact can be realised and
provides details around the US$ 25 million Migration
Pooled Fund. He explains that the aim is to encourage
and support the design of projects which can either be
scaled up and/or replicated as bodies of best practice.
Chapter Four: Multilateralism on trial?
Chapter Four explores new ways to forge a strong
multilateral order in times of uncertainty. Former UN
Director General of Geneva, Michael Møller sees the
instability and period of discontent as an opportunity
to revive multilateralism by injecting it with new levels
of agility, inclusiveness and partnership. He argues this
entails breaking down internal and external silos, forging
new and unconventional partnerships, increasing public
outreach and promoting openness.
In the next piece, Ulrika Modéer states that in order for
the multilateral system to regain trust and bolster the
rule-based and value-driven system, it needs to address
its discontents and evolve to be ‘t for purpose’. She
calls on Member States to show their support for and
trust in the ability of the UN development system to
meet both the promises and the responsibilities of
achieving the SDGs and increase the core-share for more
predictable funding.
Multilateralism is a hard option, argues Bruce Jenks, and
to be eective, multilateralism must be a choice that is
made because it is the most eective or ecient instru-
ment available to a government. He notes that countries
should work multilaterally when it is the most eective
way to meet a challenge. It should not become a way of
abdicating leadership; it must be a way of exercising it.
Adriana Erthal Abdenur brings a perspective on multi-
lateralism from the Global South. In her contribution
she highlights that the Global South is increasingly
frustrated that global norms are, too often, set by global
powers, and that—recent restructuring eorts notwith-
standing—deeper reform of the multilateral system is
hampered by geopolitics and outdated, unjust power
structures that date back to the post-War period. She
argues that three particular steps are needed to boost
the engagement of the Global South in the defence of
multilateralism.
In the last piece Kanni Wignaraja reminds us how
important Millennial Investors are in shaping the next
multilateral order. She notes that the millennial
generation – as leaders, consumers, self-starters and
investors – can dramatically move the needle on
inuencing SDG investments, locally and globally.
She highlights how UNDP is expanding its knowledge
on Millennial Investors and engaging with them so they
can transition from considering nancing of the SDGs as
fringe philanthropy to being mainstream better-business
for all.
Conclusion
Time is short. Not only is 2030 approaching, but there
is little time to take the necessary actions to prevent
irreversible setback and development losses. Climate
action, armed conict, disease prevention, migration,
inequality – all need urgent action and multilateral
approaches to be at the centre of global action. To make
the case for a multilateral approach, countries, leaders,
investors and citizens will need evidence of where and
in which areas this approach is the most eective option
to achieve the goals we aspire to globally, nationally and
locally. This is the rst hard choice, out of which the
nancing choices ow.
This report has attempted to provide the necessary
evidence, showcasing the funding of the UN development
system and its role within the nancing dynamics of the
2030 Agenda. A number of headline messages and
questions have emerged from this work.
What kind of multilateralism supports nancing and
funding of sustainable development and is there a
sucient sense of urgency and evidence for meaningful
investment? How do global norms get funded and
support these larger investment and nancing choices?
Does the big picture of nancial ows to development
countries – apparently increasing – point to any net
impact?
How can some of the most impactful drivers of change
– technology, science and innovation – help to reduce
inequality, ‘leave no one behind’ and leapfrog transforma-
tion? And what are the nancing approaches most likely
to accelerate these drivers? How can impact be credibly
measured to underpin hard investment choices and track
outcomes and return for future investment? What are
today’s (and tomorrow’s) models of ‘good multilateral
donorship’? And where are the pathways to ensure the
model becomes a rm structure?

22
In order to support countries in their achievement of the
SDGs, the required repositioning of the UNDS was
advanced by recent milestones. These include the
Secretary-General’s 2018 reform agenda adopted by
Member States, the major global nancing events for
sustainable development held in 2018 and 2019, and the
Funding Compact with Member States. These steps, if
well reinforced can serve as nancing cornerstones for the
UN’s contribution to a stronger multilateral order. The
hard choices ahead rest on further strengthening this
multilateral foundation, where strength is needed
especially in times of uncertainty.
Executive summary

23
Introduction
An important challenge is embedded in the title of
this year’s report: Time for Hard Choices. In a nancing
world which is both simple and complex, the choices are
numerous and what follows are hard decisions about the
allocation of resources. A multilateral approach to today’s
global challenges will need to use evidence to show its
competitive advantage. From here on, the nancing
questions ow.
The intention of this report is to wake us up to the reality
that the nancing of the United Nations development
system (UNDS) is currently in the spotlight of a complex
reform agenda. At the same time, nancing is a crucial
dimension of a multilateral approach to addressing the
world’s urgent development challenges. The report show-
cases the complexities and inno vations within Sustainable
Development Goal (SDG) nancing and the need for
a rm multilateral approach when it is best for SDG
achievement.
Over the past year, the extensive discussions and negotia-
tions around the 2030 Agenda implementation have
been increasingly focused on aspects of nancing. The
High-level UN summits on sustainable development
nancing in 2018 and 2019, major ongoing global fund
and International Financial Institutions (IFI) replenish-
ment exercises, as well as negotiation of a rst-ever Fund-
ing Compact for the UNDS are all expressions of these
nancing choices, approaches and innovations. And far
away from UN and IFI conference rooms, similar discus-
sions are taking place in private investors forums, company
boardrooms and country-level strategy meetings.
As previous reports have highlighted, the exact numbers
on the aggregate annual nancing needed to achieve the
17 goals vary widely depending on calculations, but all are
in the trillions. There is a consistent realisation from the
range of estimated gures that traditional aid, consisting of
mainly Ocial Development Assistance (ODA), will be
far from enough. Currently estimated to be US$ 140
billion annually, ODA is a mere 3 to 4% of the total
needed, but it remains a vital nancing ow especially for
low-income and conict-aected countries.
In this report, we look at how and why the UNDS fund-
ing ecosystem – underpinned by US$ 53.2 billion in total
UN revenue in 2017 – can and should interact with the
wider SDG nancing landscape. Emerging issues this year
are how nancing can more eectively support a ‘leave no
one behind’ agenda and how the ‘big picture’ of nancial
ows to developing countries inuences the role of the
UNDS in dierent country contexts. It dives deeply into
the challenges and opportunities for nancing related to
conict prevention and peacebuilding. The report looks
again at the role of nancing as it relates to technology,
digitalisation, science and, for the rst time, at the purpose-
ful investment of young millennials.
Successfully making the hard choices and investing with
intent in the SDGs will require leadership. Countries
must recognise when the multilateral option provides
added-value and is the most eective approach to meet
urgent global challenges – climate change, health,
migration, armed conict and inequality. New partner-
ships and engagement with investors are required to close
the investment gap.
This is the fth annual report of Financing the UN
Development System and maintains the basic structure from
previous reports. Part One provides accessible UN fund-
ing data on revenue and expenditures, which we believe is
important for understanding current and future nancing

24
Introduction
reform discussions. This year’s report includes references to
two new initiatives in the UNDS funding landscape, the
Funding Compact and the 1% levy on tightly earmarked
contributions. It is important to note that as these reports
have grown in ambition over the ve years of production,
so has our attention to the underlying data and current
denitions. While there is a wealth of statistics to draw
from, there are a number of challenges with data quality,
as was highlighted in the 2018 report, making in-depth
analysis at times dicult. Thus, again this year we have
devoted more attention to this, taking a step further and
outlining the current challenges with the denitions and
the 2017 nancial data used in the report, as well as high-
lighting the major progress made in the last 12 months.
In Part Two of the report, 25 prominent guest authors
from outside and inside the UN system present their
ideas and initiatives in concise essays on the nancing
trends impacting the SDGs. The overview to Part Two
on page 66 outlines each of these important perspectives
and contributions. There are some inevitable crossovers
between the issues covered in the papers, but they are
nonetheless clustered into four chapters:
1. Financing the 2030 Agenda: The big picture
2. Earmarking: Making smart choices
3. Financing peacebuilding, humanitarian assistance
and migration: Time to invest
4. Multilateralism on trial?
The 2030 Agenda requires a better understanding of the
complexities and opportunities of nancing development.
Part Two gives us the analysis and insights that we believe
make an important contribution to the debate and to the
choices that lie ahead.
Our overall ambition for this report, which is a collabora-
tive partnership between the Dag Hammarskjöld
Foundation and the UN Multi-Partner Trust Fund Oce,
is to advance the quality of the evidence-based debate
and the marketplace of ideas related to the UN’s role in
nancing development. With a rm platform of data and a
strong portfolio of ideas presented in the report, we hope
that when hard decisions are made – bilateral, multilateral
or other – they deliver on our shared goals.


26
Overview of
United Nations' resource flows
As readers of the Financing the UN Development System
reports have learnt in previous years, the nancial
landscape of the UN is both simple and complex, both
traditional and innovative, both agile and rigid, young
and old. It is a uniting force and a divider. All at the
same time. How and by whom is the UN funded? And
where and on what does the UN spend? The answers to
these questions are key to understanding the multilateral
nancial architecture of the UN and informing future
debates on the funding of the UN.
The rst chapter of Part One is a deep dive into the
nancial engine room of the UN, looking closely at
its revenue streams, where they originate and why
identifying them matters. It also contrasts the funding
of the UN to that of other multilateral institutions.
Chapter Two examines UN expenditure by building up
a global picture of UN operations in nancial terms.
In what functions does the UN invest and where,
geographically, does the UN spend?
Chapter Three discusses the quality of nancial data and
the adoption of new UN data standards. It examines
why these are crucial for our analysis and for correctly
explaining the nancial ecosystem of the UN. It also
scrutinises the nancial data challenges that have been
resolved and what remains to be done.
Finally, Part One explains two new initiatives formally
introduced to the UN in 2019 that will aect how UN
nances are measured, analysed and operationalised:
1) the adoption of the Funding Compact and its
mutual commitments between the UN and its
Member States;
2) the operationalisation of the levy on tightly
earmarked funding and what it entails.
Both are results of the wider UN reform ambitions and
the repositioning of the United Nations development
system (UNDS).¹ The ambition and vision of the
Funding Compact is to measure and strive towards more
exible, predictable and coherent UN funding, while the
levy has been introduced to serve as a nancing
mechanism for the reinvigorated Resident Coordinator
function and to give incentives for more exible funding
to the UN. All these measures are being put in place to
enable the UN to deliver on the ambitions of the 2030
Agenda.
PART ONE
27
Revenue
PART ONE
Chapter One
Assessed
contributions
Voluntary core
contributions
Negotiated
pledges
Earmarked
contributions
Fees
Definition
What is the
central
characteristic
of financing?
How are decisions
on the amount of
contribution made
(burden sharing)?
How are
resources
allocated?
Who takes
allocation
decision?
Fixed amounts,
calculated based on
agreed formula that
Member States
undertake to pay
when signing a
treaty
A price of a
membership
Price is based
on an agreed
formula
Established
in recipient's
budget
UN membership
Voluntary
untied
contributions
Voluntary,
usually annual
contributions
(no earmarking)
Contributions
are purely
voluntary
Established
in recipient's
budget
UN Member
States
Legally binding
contribution
agreements
made by
Member States
Member States
negotiate and
agree on the
contribution each
will make
The amount to
be paid is
negotiated and
legally binding
Established
in recipient's
budget
Recipient
UN entity and
UN Member
States
Voluntary
contributions that
are designated
for a specific
purpose
Funding is
earmarked to
theme, country
or project
No
institutionalised
formula,
contributions are
purely voluntary
Agreed,
case-by-case,
between
contributor and
UN recipient
Specific parties
concerned
Payments
for services
Collection of
separate knowledge,
management and
product fees from
both state and
non-state actors
Flat or
negotiated fees
Various
Various
Total revenue of the UN system
How the UN is nanced aects how it operates and
inuences, for example, the level of exibility and
accountability for the UN entities. Broadly speaking, there
are ve dierent channels of revenue in the UN system:
1) Assessed contributions
2) Voluntary core contributions
3) Negotiated pledges
4) Earmarked contributions
5) Fees
Table 1 outlines the denitions, characteristics, and
burden sharing arrangements, and how decisions are
usually taken in each type of these nancial instruments.
Table 1: The spectrum of UN financing instruments

28
Revenue
Assessed contributions are mandatory membership fees
based on a jointly pre-agreed formula which determines
each member’s fee. For a UN membership, the General
Assembly and the UN Member States determine the
formula for assessed contributions, building on each
Member State’s capacity to pay. Voluntary core
contributions, or what is sometimes referred to as
‘regular resources’, are fully exible non-earmarked
funds. Voluntary core, which is always provided to an
individual UN organisation, is vital for the operations
of many UN entities, but is currently not a revenue
channel for the UN at a system-level. Negotiated pledges
are legally binding commitments, but not a revenue
channel for the UN at a system-level today. An example
of negotiated pledges is the World Bank’s International
Development Association (IDA).
Earmarked contributions are sometimes also referred to
as ‘non-core resources’, or ‘extra budgetary resources’.
These contributions are voluntary for the contributor
but constrained in how they can be used by the recip-
ient, for example, funds can be restricted to a specic
project, theme, region or country. There are many
dierent applications of earmarking, some less stringently
tied, others more tightly earmarked. In 2019, the UN
introduced a 1% levy on tightly earmarked development
funding (for further denitions and applications of the
levy see page 46). Finally, the UN receives revenues from
fees and other revenue streams, linked to public services,
and management and product services.
A deeper look at this category is included further on in
the chapter.
Knowing the denitions helps us in the next step when
looking at the size and mix of these revenue channels
in the UN system for 2017. This is displayed in Figure 1
on the next page which shows that the main channel of
revenue in the UN system is earmarked in some form by
the contributor(s).
In 2017, (the most recent year of available nancial data),
57% of all UN income was earmarked to some degree.
The upward trend in this revenue stream is visible in the
short term; in 2015 and 2016 the share of earmarked
contributions was 54% and 53%, respectively.
The increase of the share of earmarked UN revenue is
part of a long-term trend in UN nancing and forms
part of the changing nancial landscape of the UN
(see Figure 2 on the next page). Figure 2 shows the
distribution over time of the dierent channels of
revenue in the UN system, demonstrating the relative
decline of assessed contributions and voluntary core
contributions combined with the general shift
towards earmarked contributions. Assessed contributions
amounted to 26% in 2017, which was two percentage
points less than in 2016. The voluntary core contribu-
tions decreased by one percentage point to a level of 9%
of the total nancial resources of the UN in 2017.
The remaining revenue stream of 8%, from fees and
other revenues, is steadily rising. Interestingly, the share
of the revenue accrued from these sources almost
equalled the size of the voluntary core contributions in
2017. It is therefore worth taking a closer look at the
types of revenues included in this category. As the word
‘other’ suggests, the category is a broad mix of revenue
streams. It includes fees for management and procure-
ment services as well as nancial revenues accrued from
nancial transactions (interest, foreign exchange gains
etc) and in-kind contributions. In 2017, 70% of the
revenues of this category went to ve UN entities: the
United Nations Oce for Project Services (UNOPS),
the Pan American Health Organization (PAHO), the
UN Secretariat, the World Food Programme (WFP) and
the World Intellectual Property Organization (WIPO).
The almost fully fee-nanced WIPO illustrates an
interesting, although today atypical, UN funding model.
WIPO receives fees for patent services arrangements.
The revenue stream could be characterised as core-like
(as it is presumed to be non-earmarked) even though the
income is likely to uctuate and is tied to a single type
of product – the patent service. WIPO-fees make up
about 9% of the UN’s total revenue in the category of
fees and other revenue. The unique case of WIPO
and other funding models, old and new, are further
elaborated on in Weinlich and Jenks’ article in Part Two
of this report.
29
Revenue
Figure 1: Overview of the total revenue of the UN system by financing instrument, 2017
Source: Chief Executives Board for Coordination (CEB)
For notes – see page 182.
Earmarked contributions
57%
Assessed contributions
26%
Voluntary core
contributions
9%
Fees and
other revenues
8%
Figure 2: Distribution of total UN system revenue, by financing instrument, 2010–2017
Source: Chief Executives Board for Coordination (CEB)
For notes – see page 182.
0%
10%
20%
30%
40%
50%
60%
57%
26%
9%
8%
Assessed contributions
Fees and other revenues
Voluntary core contributions
Earmarked contributions
2016
2014
2012
2017
2015
2013
2011
2010
30
Revenue
Table 2a: Total revenue of the UN system by entity and by financing instrument, 2017
(US$ million)
Source: Chief Executives Board for Coordination (CEB)
For notes - see page 186.
Entity Assessed
Voluntary
core
Earmarked
Fees and
other revenues
Total
revenue 2017
UN Secretariat
2,578 2,279 623 5,480
CTBTO
119 7 2 128
DPKO
7,853 343 79 8,276
FAO
474 751 39 1,264
IAEA
434 260 8 702
ICAO
80 114 22 216
ICC
167 2 0 170
IFAD
306 104 9 419
ILO
370 293 21 683
IMO
41 7 19 67
IOM
49 15 1,450 100 1,615
ITC
35 29 62 1 127
ITU
125 1 10 47 183
PAHO
102 614 716 1,433
UNAIDS
173 52 8 233
UNCDF
10 47 3 60
UNDP
647 4,245 344 5,236
UNEP
199 443 25 668
UNESCO
316 261 71 648
UNFCCC
31 2 38 15 86
UNFPA
350 718 93 1,160
UN-HABITAT
14 3 142 11 169
UNHCR
48 703 3,445 31 4,227
UNICEF
1,278 5,153 146 6,577
UNIDO
80 256 3 339
UNITAR
0 32 0 33
UNODC
31 4 342 15 391
UNOPS
834 834
UNRISD
2 0 2
UNRWA
625 559 55 1,239
UNSSC
4 7 0 11
UNU
49 58 107
UN Women
8 146 214 10 379
UNWTO
16 3 5 24
UPU
37 17 16 69
WFP
391 5,609 431 6,431
WHO
457 81 2,058 179 2,775
WIPO
18 1 11 392 423
WMO
70 5 17 2 94
WTO
200 21 2 224
Total 13,953 4,776 30,035 4,435 53,200
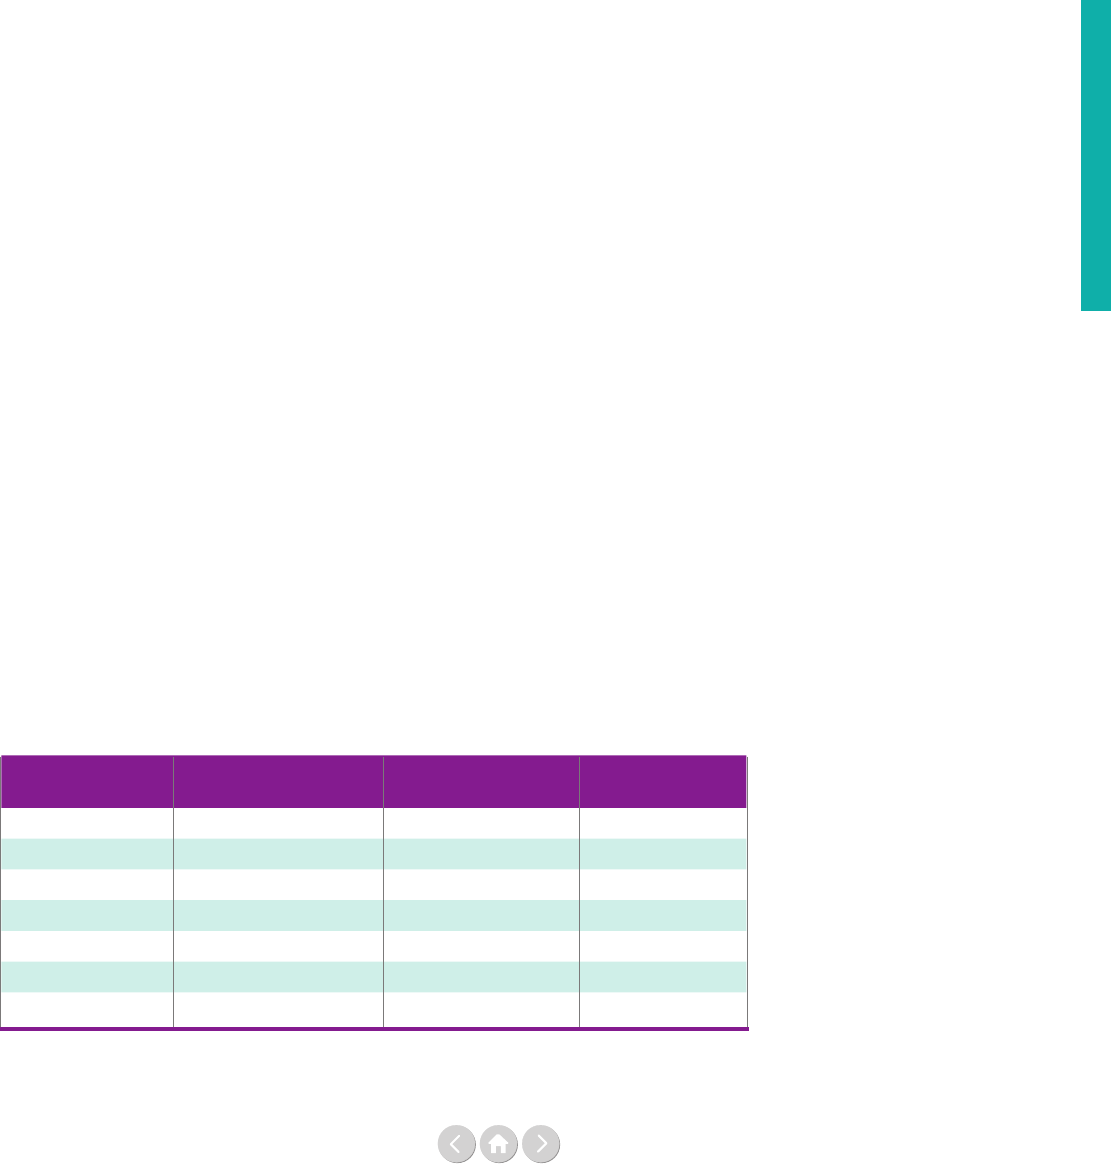
31
Source: UNDP, UNFPA, UNHCR, UNICEF, UNRWA, WFP, and WHO
For notes - see page 186.
Entity Total revenue 2017 Total revenue 2018
Percentage
growth rate
UNDP
5,236 5,517 5%
UNFPA
1,160 1,343 16%
UNHCR
4,227 4,338 3%
UNICEF
6,577 6,675 1%
UNRWA
1,239 1,295 5%
WFP
6,431 7,368 15%
WHO
2,775 2,901 5%
Table 2b: Total revenue of seven UN entities, 2017-18 (US$ million)
Revenue
The total size of UN financing
– a cautionary note
How large is the UN in nancial terms and is it grow-
ing? The total revenue received by the UN in 2017
was US$ 53.2 billion, an increase of US$ 3.9 billion
compared to what was reported in 2016 (according to
the UN System Chief Executives Board for Coordina-
tion (CEB)). Table 2a, on the previous page, shows the
total revenue for each of the 40 UN entities that
reported to the CEB in 2017, as well as the breakdown
of their total revenue between the dierent UN revenue
streams. The total revenue in 2018 of seven of these
entities is presented in Table 2b below. Of these entities,
the United Nations Population Fund (UNFPA) had the
largest growth rate in 2017-2018 (16%) followed closely
by WFP (15%).
When considering the 2017 overall numbers, it is
important to highlight two points.
First, the UN nancial reporting has become more
comprehensive. Six UN entities reported their nancial
data to the CEB for the rst time in 2017 and, therefore,
are newly introduced to this year’s report. These debuting
entities are:
• the Comprehensive Nuclear-Test-Ban Treaty
Organization (CTBTO);
• the International Criminal Court (ICC);
• the United Nations Capital Development Fund
(UNCDF);
• the United Nations Framework Convention on
Climate Change (UNFCCC);
• the United Nations Research Institute for Social
Development (UNRISD); and
• the United Nations System Sta College (UNSSC).
In 2017, the total sum of the revenue for these six
entities was US$ 457 million; of which the ICC and
CTBTO were the largest in nancial terms (US$ 170
and 128 million, respectively).
Second, ‘double counting’ in the UN nancial system
makes the UN total revenue seem larger than it is;
specic instances of where the same nancial ows are
reported by two UN entities to the CEB are analysed in
more detail in the third chapter on data quality.
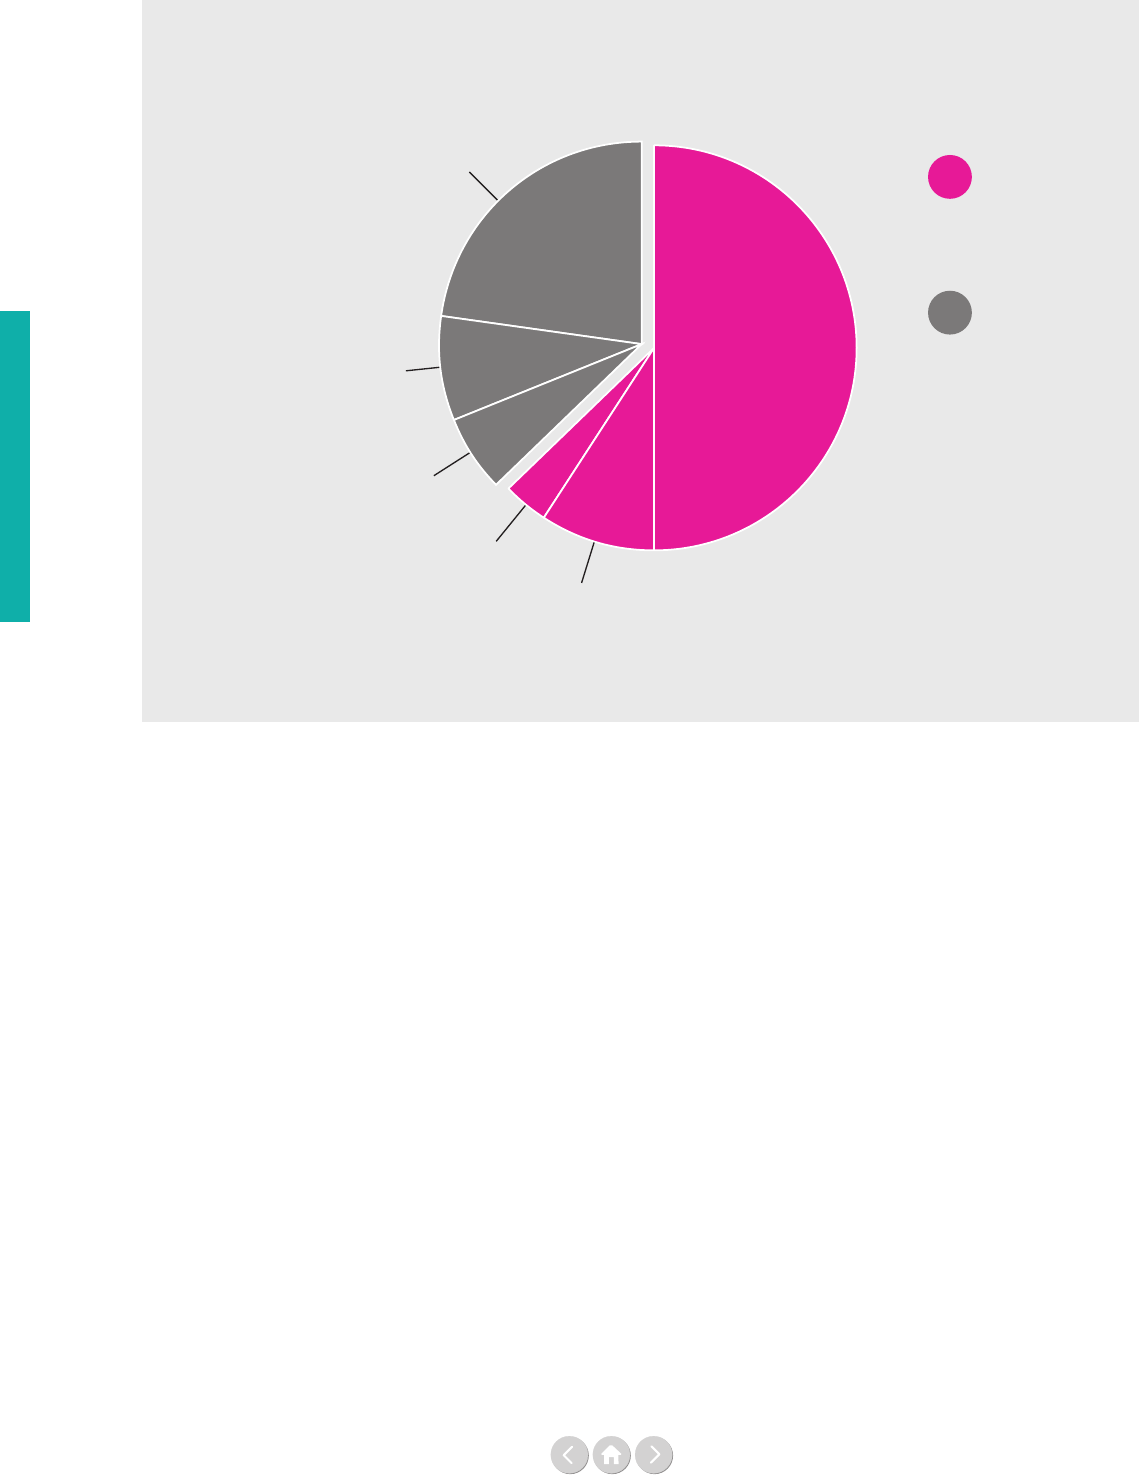
32
Revenue
Figure 3: UN operational activities' share of total revenue of the UN system by
financing instrument, 2017 (Total US$ 53.2 billion)
Source: Source: Chief Executives Board for Coordination (CEB) and Report of the Secretary-General (A/74/73-E/2019/4)
For notes – see page 182.
Assessed non-OAD
US$ 12.1 billion
Earmarked non-OAD
US$ 3.3 billion
Assessed OAD
US$ 1.9 billion
Voluntary Core OAD
US$ 4.8 billion
Earmarked OAD
US$ 26.7 billion
UN non-OAD
US$ 19.6 billion
UN OAD
US$ 33.6 billion
Fees and other revenue
US$ 4.4 billion
Which parts and revenue streams
of the UN are growing?
To answer this question it is important to note that
the UN receives both funding categorised as Ocial
Development Assistance (ODA) as well as revenues for
non-ODA activities. Figure 3 above gives us an overview
of how the UN funds, on the one hand, its operational
activities for development (UN-OAD) and, on the other
hand, all other UN system activities (UN non-OAD).²
The term UN-OAD refers to those UN activities that
are classied as development and humanitarian and
funded by contributions that are ODA-like, that are
carried out by UN entities classied by the United
Nations Department of Economic and Social Aairs
(UNDESA) as being part of the UN development
system. The UN’s overall revenue growth has been
concentrated in UN-OAD. In total, the split of UN
overall revenue between UN-OAD and UN non-OAD
was US$ 33.6 versus US$ 19.6 billion in 2017, a shift
from US$ 29.5 versus US$ 19.8 billion in 2016.
Specically, the earmarked resources for UN-OAD
increased (from US$ 23.1 to US$ 26.7 billion), while
there was a decrease in earmarked funding for UN
non-OAD (from US$ 3.6 to US$ 3.3 billion). Fees and
other revenues, all classied as UN non-OAD, increased
from US$ 3.6 to US$ 4.4 billion.
As seen in Table 3 on the next page, there is a large
variance in the level of predetermined, membership-
based assessed funding received by UN organisations.
Only three UN entities are almost fully funded through
assessed contributions, namely CTBTO, the Department
for Peacekeeping Operations (DPKO) and ICC. For the
International Atomic Energy Agency (IAEA), the Inter-
national Labour Organization (ILO), the International
Maritime Organization (IMO), the International
Telecommunication Union (ITU), the United Nations
World Tourism Organization (UNWTO), the Universal
Postal Union of the United Nation (UPU) and the
World Meteorological Organization (WMO) – these
contributions are the dominating source of revenue
(50-90%) and several other entities, like the Food and
Agriculture Organization of the United Nations (FAO),
the International Civil Aviation Organization (ICAO),
the United Nations Educational, Scientic and Cultural
Organization (UNESCO), UNFCCC and the UN
Secretariat, have a substantial share of assessed funding
(30-50%).
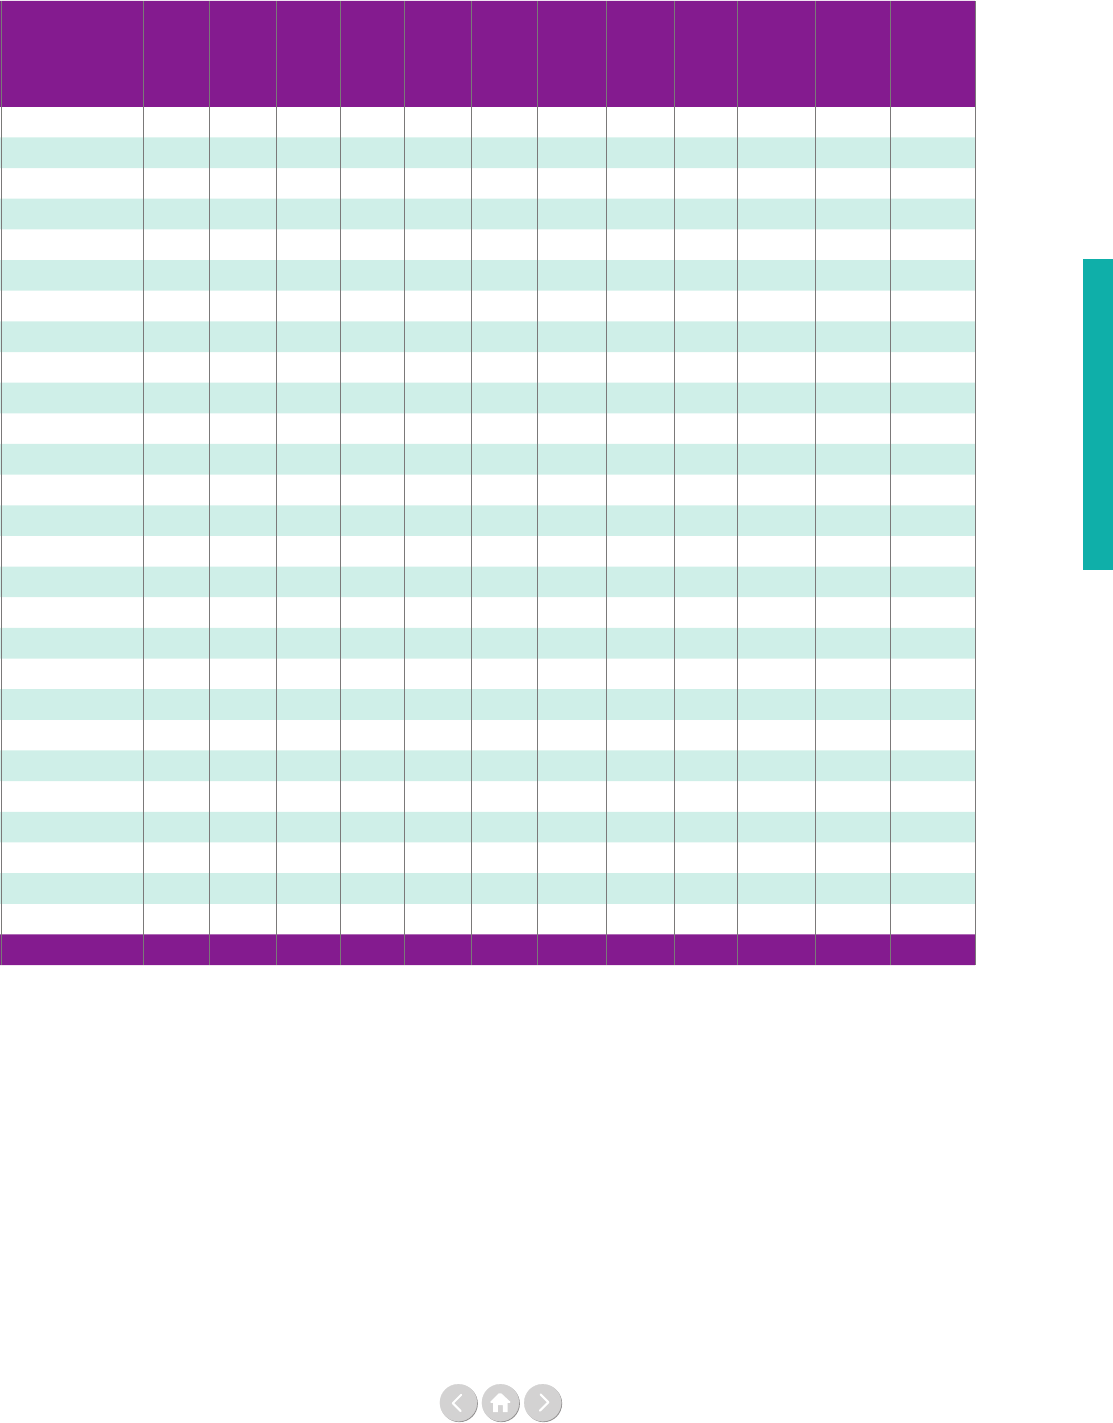
33
Revenue
Source: Chief Executives Board for Coordination (CEB);
General Assembly Financial Report (A/72/5 Vol. II), 2006 and 2011;
and Michael Renner, Peacekeeping Operations Expenditures.
For notes – see page 186.
Table 3: Assessed contributions to the UN system by entity, 1975-2017 (US$ million)
Entity 1975 1980 1985 1990 1995 2000 2005 2010 2015 2016 2017
Percent
assessed
of total
revenue
2017
UN Secretariat
268 510 618 888 1,135 1,089 1,828 2,167 2,771 2,549 2,578 47%
CTBTO
119 93%
DPKO
153 141 141 464 3,364 2,139 4,394 7,828 8,504 8,282 7,853 95%
FAO
54 139 211 278 311 322 377 507 497 487 474 38%
IAEA
32 81 95 155 203 217 278 392 377 371 434 62%
ICAO
14 21 31 34 49 49 59 77 68 78 80 37%
ICC
167 99%
ILO
48 105 127 165 233 234 265 409 401 399 370 54%
IMO
3 10 12 23 27 30 36 43 45 37 41 61%
IOM
29 21 32 38 43 46 49 3%
ITC
17 26 35 37 37 35 28%
ITU
21 44 53 84 107 84 98 135 128 120 125 69%
PAHO
85 92 98 106 102 102 7%
UNEP
44 40 62 221 223 190 199 30%
UNESCO
89 152 187 182 224 272 305 377 341 323 316 49%
UNFCCC
31 36%
UN-HABITAT
6 9 0 17 14 14 8%
UNHCR
6 13 15 20 25 20 39 40 49 37 48 1%
UNIDO
40 90 123 66 91 103 78 71 80 24%
UNODC
14 21 0 29 30 31 8%
UN Women
8 8 8 2%
UNWTO
7 11 16 15 14 16 67%
UPU
4 10 11 19 28 21 27 37 36 35 37 53%
WHO
119 214 260 307 408 421 429 473 467 468 457 16%
WIPO
2 10 10 19 19 11 13 18 18 17 18 4%
WMO
9 17 19 35 41 39 48 66 66 67 70 74%
WTO
72 128 202 198 191 200 90%
Total 822 1,467 1,830 2,763 6,370 5,276 8,668 13,283 14,520 13,972 13,953 45%
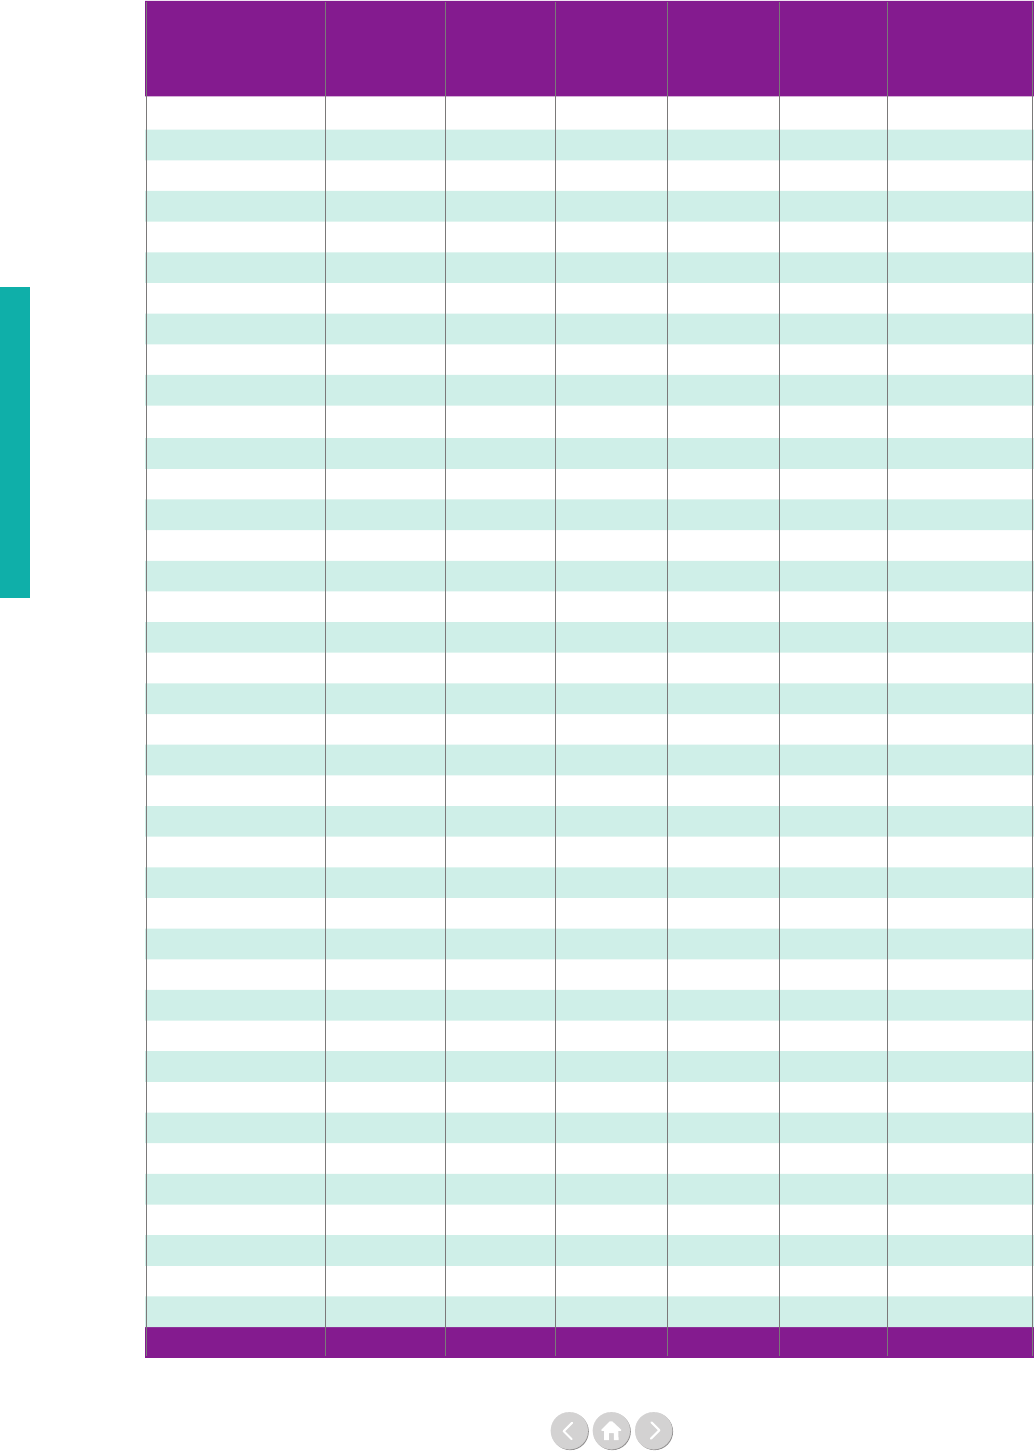
34
Revenue
Source: Chief Executives Board for Coordination (CEB). For notes – see page 186.
Entity 2005 2010 2015 2016 2017
Percent
earmarked
of total
revenue 2017
UN Secretariat
848 1,361 2,094 2,063 2,279 42%
CTBTO
7 5%
DPKO
23 33 195 392 343 4%
FAO
364 891 744 770 751 59%
IAEA
124 202 236 252 260 37%
ICAO
154 129 106 101 114 53%
ICC
2 1%
IFAD
39 80 93 109 104 25%
ILO
179 248 225 252 293 43%
IMO
14 11 8 5 7 11%
IOM
962 1,051 1,397 1,462 1,450 90%
ITC
32 40 25 18 62 48%
ITU
16 12 6 5 10 6%
PAHO
65 741 651 600 614 43%
UNAIDS
26 34 23 44 52 22%
UNCDF
47 78%
UNDP
3,609 4,311 3,726 4,122 4,245 81%
UNEP
79 174 432 499 443 66%
UNESCO
349 323 352 246 261 40%
UNFCCC
38 44%
UNFPA
199 357 581 486 718 62%
UN-HABITAT
125 166 156 208 142 84%
UNHCR
1,089 1,521 2,779 3,208 3,445 82%
UNICEF
1,921 2,718 3,836 3,571 5,153 78%
UNIDO
157 229 250 228 256 75%
UNITAR
16 19 24 23 32 98%
UNODC
124 238 234 297 342 87%
UNOPS
0%
UNRISD
0 12%
UNRWA
528 13 611 601 559 45%
UNSSC
7 59%
UNU
20 37 61 50 49 46%
UN Women
171 180 214 57%
UNWTO
3 8 3 5 3 11%
UPU
6 21 20 17 24%
WFP
2,963 3,845 4,469 5,108 5,609 87%
WHO
1,117 1,442 1,857 1,726 2,058 74%
WIPO
5 10 10 10 11 3%
WMO
19 25 5 5 17 18%
WTO
21 31 21 19 21 10%
Total 15,196 20,298 25,403 26,684 29,834 63%
Table 4: Earmarked contributions to the UN system by entity (US$ million)
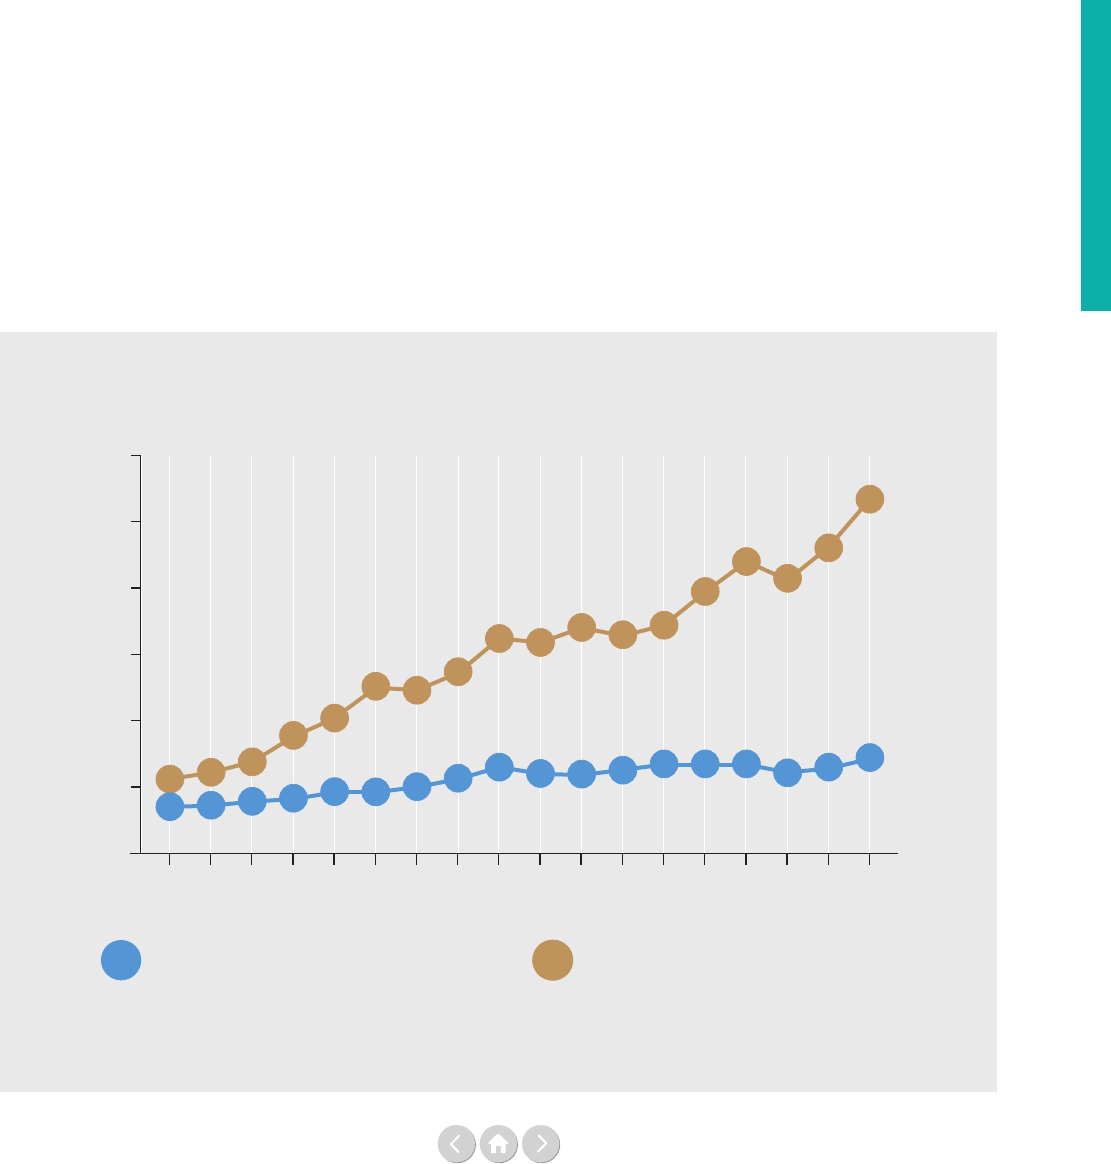
35
Revenue
Figure 4: Total core and earmarked contributions for UN operational activities, 2000–2017
Source: Report of the Secretary-General (A/74/73-E/2019/4)
For notes – see page 183.
US$ billion
0
5
10
15
20
25
30
26.7
6.9
20.6
23.1
22.0
19.7
17.2
16.4
17.0
15.9
16.2
13.6
12.3
12.5
10.2
8.8
6.9
6.1
5.6
3.5
3.6
3.9
4.1
4.6
4.6
5.0
5.6
6.5
6.0
5.9
6.3
6.7 6.7 6.7
6.1
6.4
Earmarked (development and humanitarian) Core (development and humanitarian)
2016
2014
2012
2010
2008
2006
2004
2002
2000
2017
2015
2013
2011
2009
2007
2005
2003
2001
Meanwhile, a large number of UN agencies rely almost
exclusively on voluntary core and earmarked contribu-
tions, like the New York based UN funds and
programmes of the United Nations Development
Programme (UNDP), the United Nations Children’s
Fund (UNICEF), UNFPA and the United Nations
Entity for Gender Equality and the Empowerment of
Women (UN Women). In Table 4 on the previous page,
the percentage of earmarked funding for each UN entity
is shown. In 2017, seven UN entities, the International
Organization for Migration (IOM), UNDP, the United
Nations Institute for Training and Research (UNITAR),
the United Nations Human Settlements Programme
(UN-HABITAT), the United Nations High Commis-
sioner for Refugees (UNHCR), the United Nations
Oce on Drugs and Crime (UNODC) and the WFP
received over 80% of their funding as earmarked.
We now turn to the nancing of UN operational activi-
ties for development, ie those activities that are classied
under development and humanitarian assistance, and
funded by contributions that are ODA-like. A close look
reveals a trend of strong growth in earmarked revenue
in the last decade(s) combined with, in nominal terms,
rather stagnating core resources; with core resources
being the total of assessed contributions and voluntary
core contributions. The nancial data of the UN
operational activities in Figure 4 below shows this. The
two co-existing trends of growth and stagnation are
widening the gap between exible core resources and
restricted earmarked resources.
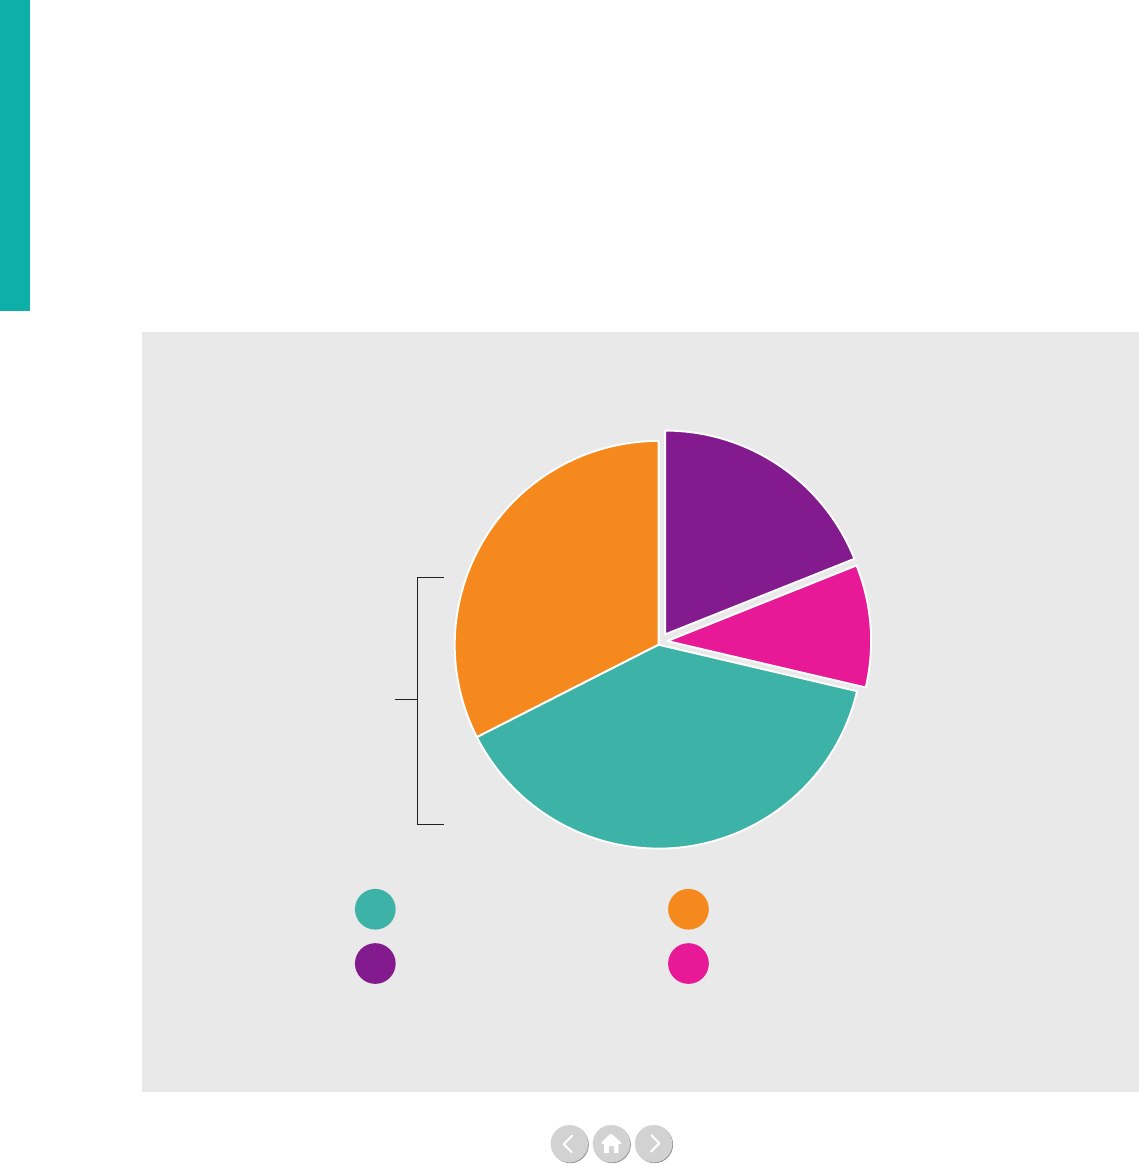
36
Revenue
Revenue
Figure 5: Funding of UN system-wide activities, 2017
Source: Report of the Secretary-General (A/74/73-E/2019/4)
For notes – see page 183.
What does the UN fund?
Having looked at the dierent funding instruments
available to the UN, we now move into examining what
is being funded by the UN. In Figure 5 below, the total
funding of UN activities is divided into four areas:
development assistance and humanitarian assistance
(which together are the UN operational activities for
development), peacekeeping and a fourth area that
covers all other activities – global norms, standards,
policy and advocacy. There has been a recent increase
in humanitarian assistance: the humanitarian sector has
grown by four percentage points in size relative to the
other sectors, from 28% of the total in 2016 to 32% in
2017. The relative share of funding for development and
peacekeeping remains stable (+/- 1%), while the relative
drop visible here is within the category of global norms,
standards, policy and advocacy that decreased by four
percentage points compared to 2016. A note of caution
though before drawing too many conclusions from these
numbers; as elaborated in Chapter Three on data quality,
the drop in the share of funding for the normative
work of the UN has more to do with denitional and
methodological issues than with the UN investing less
resources in its normative mandates.
Operational activities
for development 71%
19%
32%
39%
10%
Development assistance Humanitarian assistance
Peacekeeping Global norms, standards,
policy and advocacy
Taking a closer look at development and humanitarian
assistance, ie the two major functions of the UN that
make up the Ocial Development Assistance through
the UN, can help further understand the major trends in
UN nancing for operational activities in recent decades.
In Figure 6 on the next page, we can see the growth in
nominal nancial contributions to both functions and,
over time, the narrowing relative gap between them.
Also visible is the higher growth in contributions to
humanitarian assistance, in particular after 2012. This
can be seen even more clearly in Figure 7 (also on next
page) that looks into the accumulative growth (adjusted
for ination) of UN-OAD (including a breakdown of
humanitarian and development assistance) and compares
it to the growth of overall Ocial Development
Assistance. It shows that real growth in UN-OAD has
been strong since 2011, while ODA funding has grown
less in real terms and has even stagnated in the last
couple of years. While UN development assistance
funding and overall ODA have followed a fairly similar
path, it is the UN’s humanitarian funding that has grown
the fastest of all.
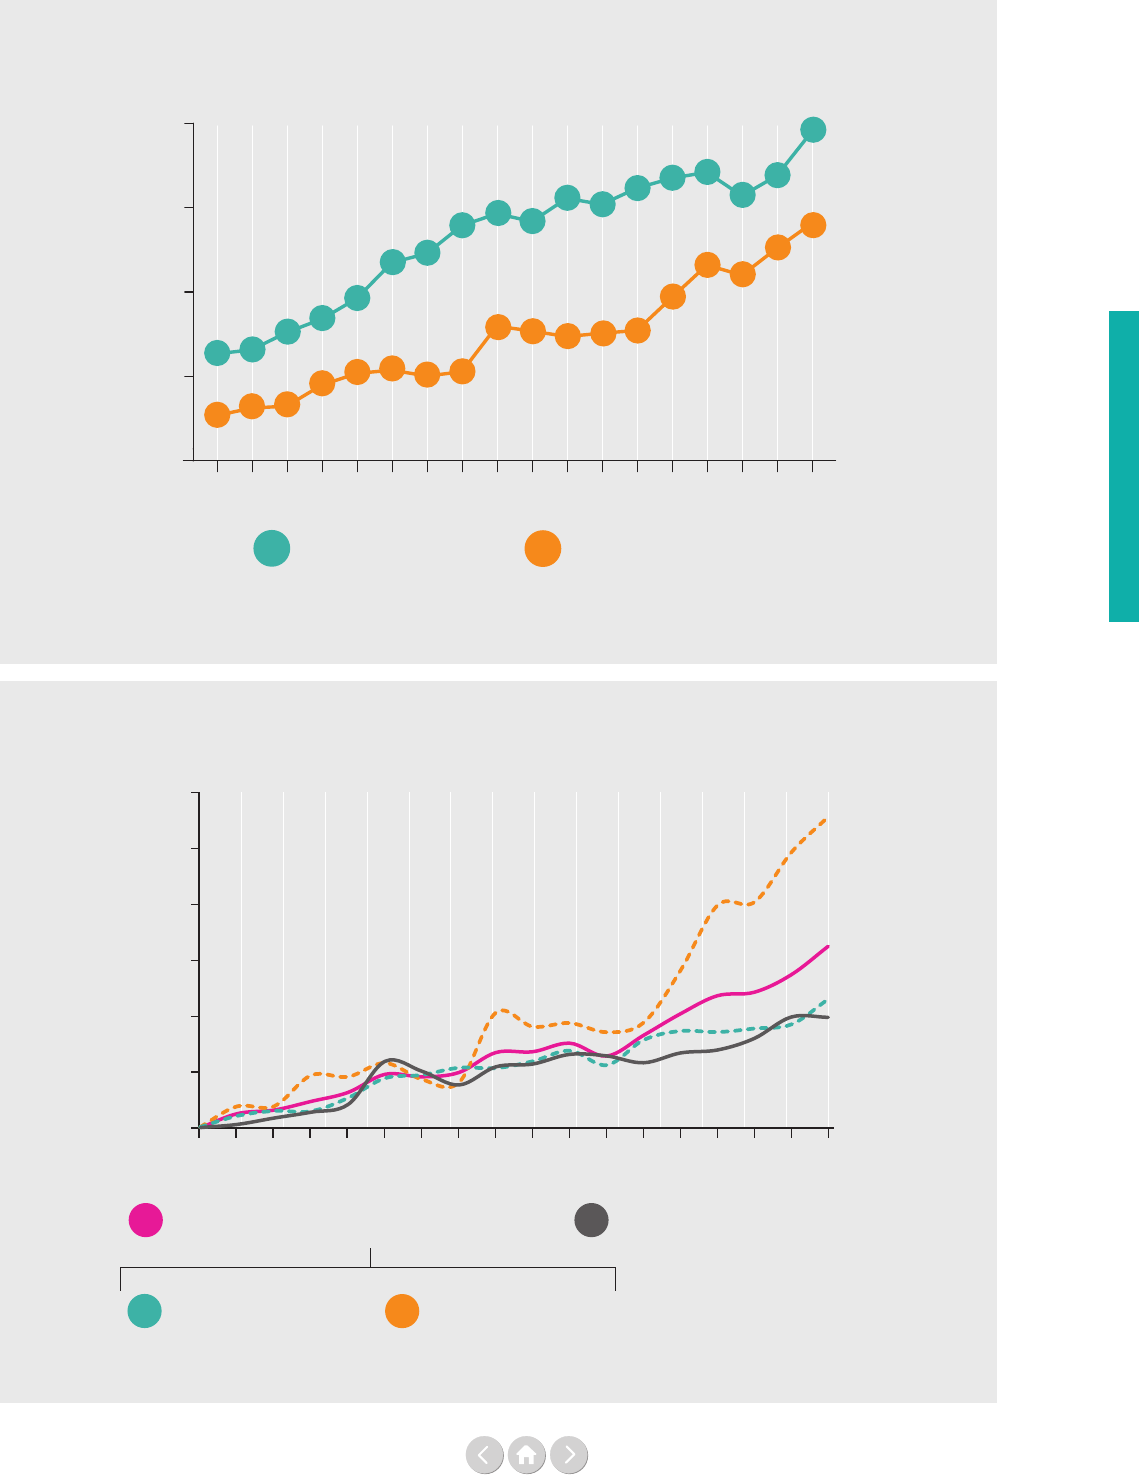
37
Revenue
Figure 6: Total contributions for development and humanitarian-related
UN operational activities, 2000–2017
Figure 7: Real growth of ODA and of funding for UN operational activities
for development, 2000-2017
Source: Report of the Secretary-General (A/74/73-E/2019/4)
For notes – see page 183.
Source: Report of the Secretary-General (A/74/73-E/2019/4)
For notes – see page 183.
US$ billion
Humanitarian assistanceDevelopment assistance
0
5
10
15
20
6.3
6.6
7.6
8.4
9.6
11.7
12.3
13.9
14.2
15.5
15.2
16.2
16.8
17.1
15.7
16.9
2.7
3.1
3.2
4.5
5.2
5.4
5.0
5.3
7.7
7.4
7.6
7.7
9.7
11.6
11.0
12.6
14.6
8.0
19.5
14.1
2016
2014
2012
2010
2008
2006
2004
2002
2000
2017
2015
2013
2011
2009
2007
2005
2003
2001
100%
150%
200%
250%
300%
400%
350%
2016
2014
2012
2010
2008
2006
2004
2000
2017
2015
2013
2011
2009
2007
2005
2002
2001
2003
Official Development Assistance (ODA)
Development assistance
Humanitarian assistance
UN operational activities for development (UN-OAD)
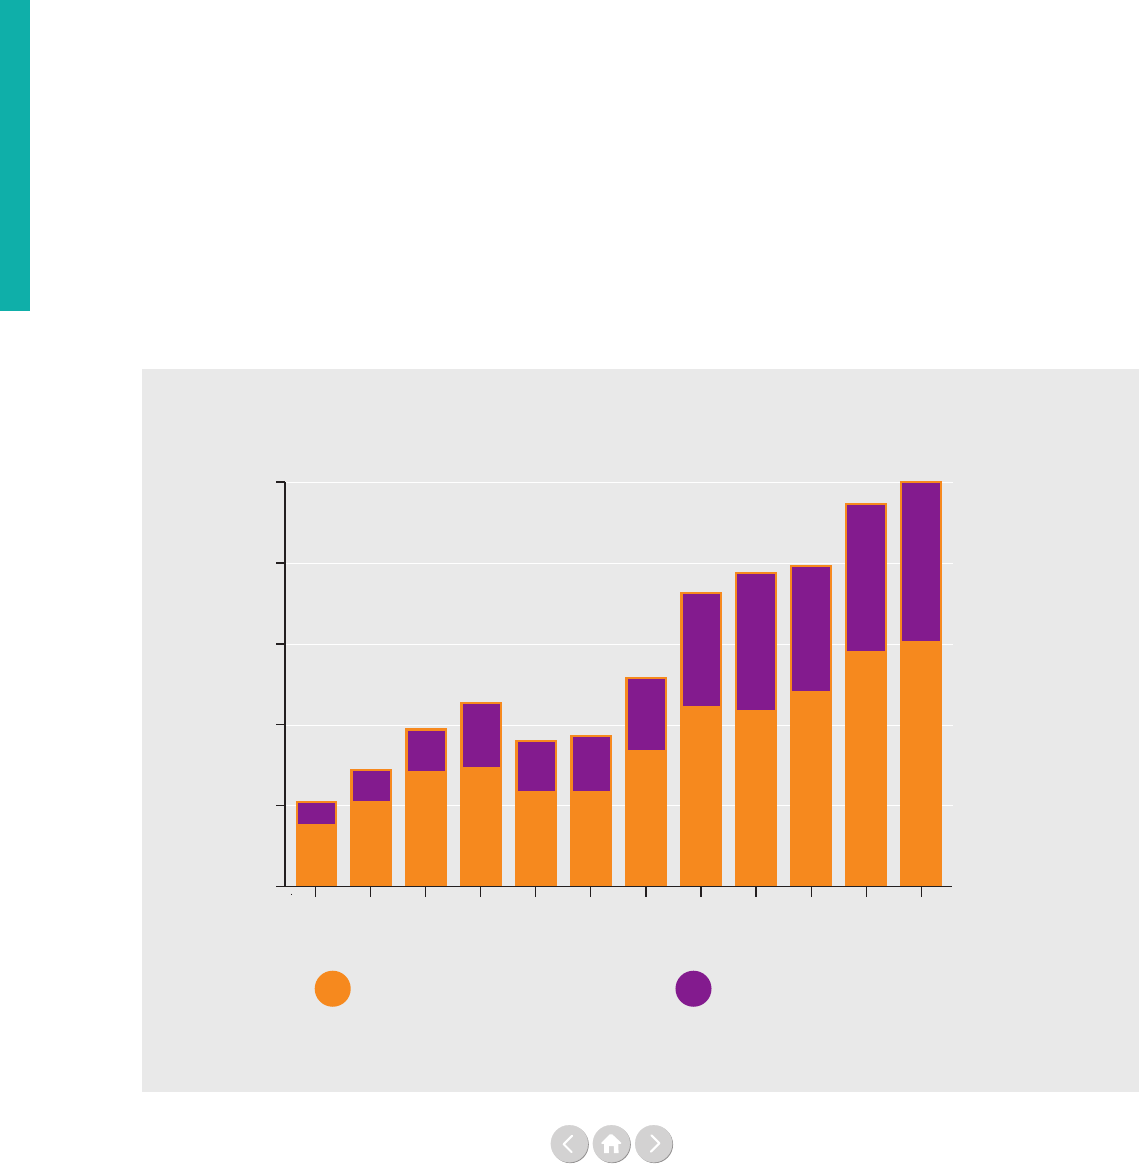
38
Revenue
Revenue
Although funding for humanitarian assistance is expe-
riencing rapid real and nominal growth, humanitarian
needs are still partially unmet, as is visible in Figure 8
below. Throughout the period 2014-2018 around 40%
of the requirements in the humanitarian appeals went
unmet. Consequently, even with growth in nominal and
real terms as seen, the humanitarian crises around the
world remain largely underfunded.
What is being funded in the multilateral system today
and how does the UN t in? The Organisation for
Economic Co-operation and Development’s (OECD)
data on contributions from the OECD’s Development
Assistance Committee (OECD-DAC) members to the
multilateral system demonstrates how important the UN
is as a multilateral channel compared to others.
Figure 9, on the next page, outlines the size of these
contributions to the UN, the Bretton Woods institutions
(World Bank and International Monetary Fund (IMF)),
as well as the EU, regional institutions and other mul-
tilateral institutions. It shows that the UN remains the
largest multilateral ODA channel and the UN system
grew its share in relative terms by two percentage points
from 2016-2017 to 33%. Even if no drastic change
of patterns can be seen over the ve-year period,
gradually more multilateral ODA was channelled
through the EU institutions, while a decreasing share
was channelled through the World Bank Group and
IMF, with the UN’s share staying fairly constant, varying
between 31% and 33%.
While Figure 9 does not capture the whole picture with
regards to ODA funding, contributions from OECD-
DAC members to multilateral organisations represented
around 41% of total ODA in 2016.³ The multilateral
funding trends over the last ve years as reected in the
OECD data can be seen in Table 5 (also on the next
page).
During the period 2013-2017 total multilateral ODA
grew by US$ 10.8 billion. This growth in multilateral aid
was led by a US$ 4.3 billion increase in funding through
the UN development system and a US$ 3.8 billion
growth of aid through European Union institutions,
as seen in Table 5 on the next page.
Figure 8: Global humanitarian assistance flows, 2007–2018
Source: UN Oce for the Coordination of Humanitarian Aairs (UNOCHA)
For notes – see page 183.
US$ billion
0
5
10
15
20
25
Unmet requirements
Response plan/appeal funding
29%
28%
28%
percentage
of unmet
requirements
=
36%
36%
37%
35%
39%
44%
40%
39%
40%
2016
2014
2012
2010
2008
2018
2017
2015
2013
2011
2009
2007
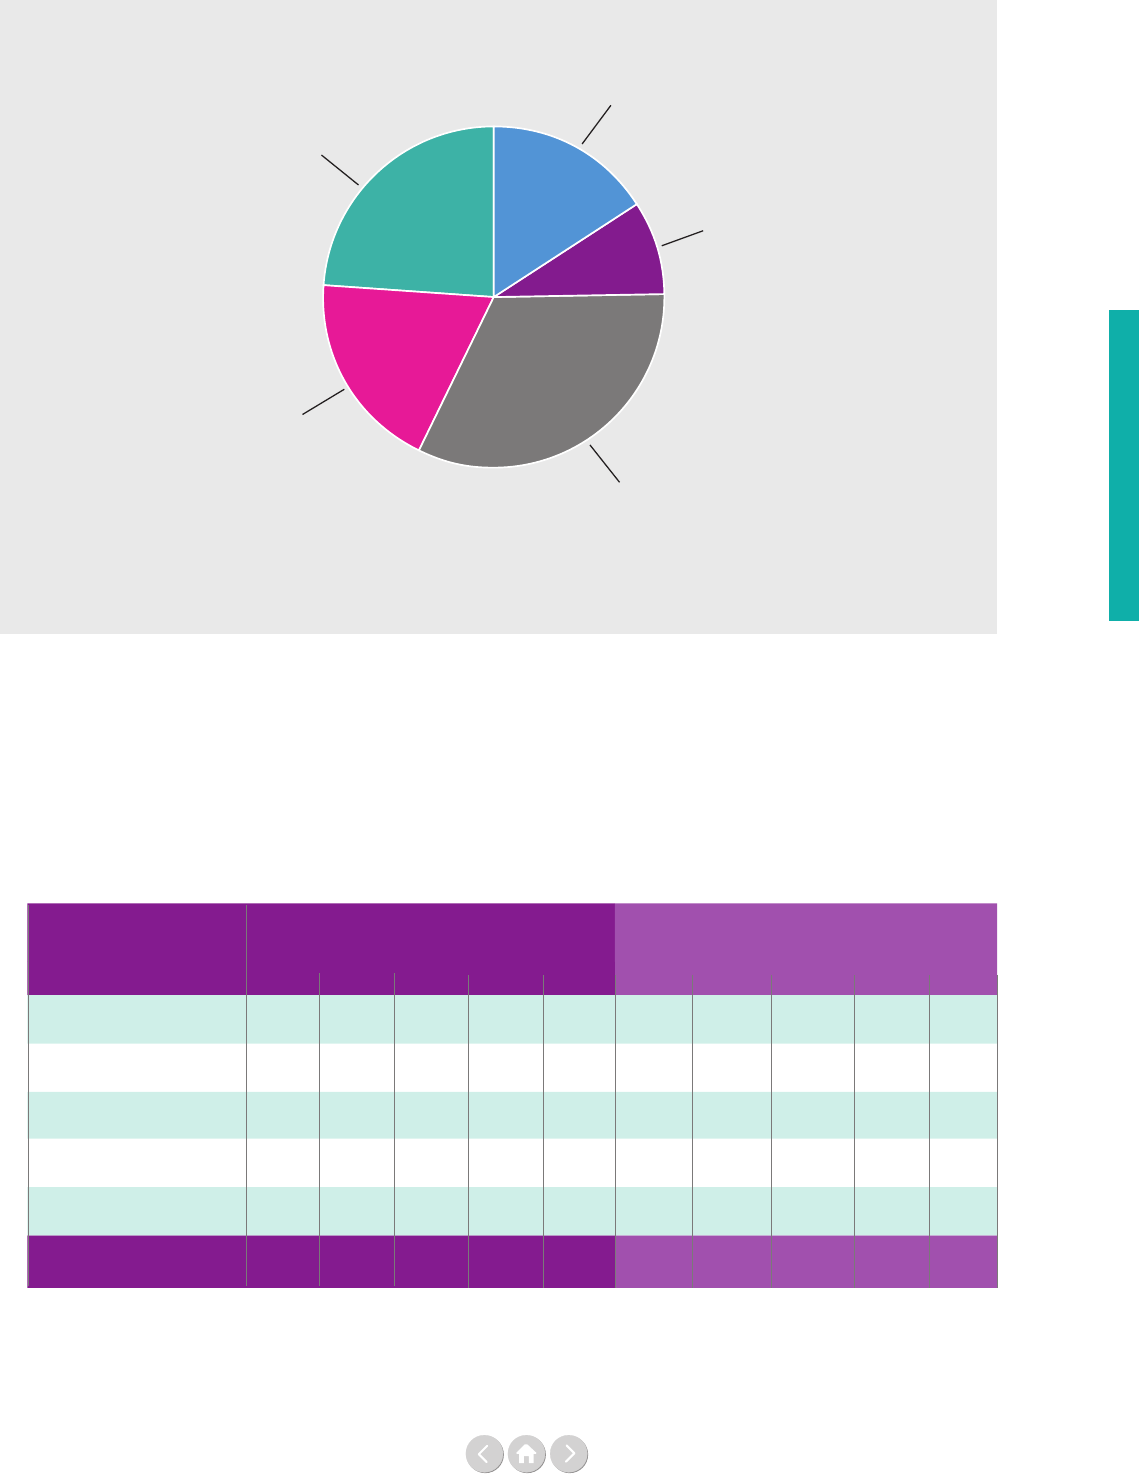
39
Revenue
Figure 9: Channels of total multilateral assistance from OECD-DAC countries, 2017
Source: Organisation for Economic Co-operation and Development (OECD)
For notes – see page 183.
33%
16%
23%
9%
19%
European Union institutions
World Bank Group and
International Monetary Fund
UN development system
Regional development banks
Other multilateral institutions
Source: Organisation for Economic Co-operation and Development (OECD)
For notes – see page 186.
Channel
Total
multilateral aid
Percentage
of total multilateral aid
2013 2014 2015 2016 2017 2013 2014 2015 2016 2017
Other multilateral
institutions
9.0 9.4 9.6 11.1 10.4 17% 17% 17% 18% 16%
Regional
development banks
4.2 4.5 4.4 5.5 5.5 8% 8% 8% 9% 9%
UN development system
16.6 17.8 18.2 19.5 20.9 31% 32% 33% 31% 33%
World Bank Group and
IMF
12.1 12.5 11.1 12.1 12.0 23% 22% 20% 19% 19%
European Union
institutions
11.2 11.5 12.0 14.8 15.0 21% 21% 22% 23% 23%
Total
53.0 55.5 55.3 63.0 63.8
Table 5: Five year perspective of total multilateral aid from OECD-DAC countries
(US$ billion)
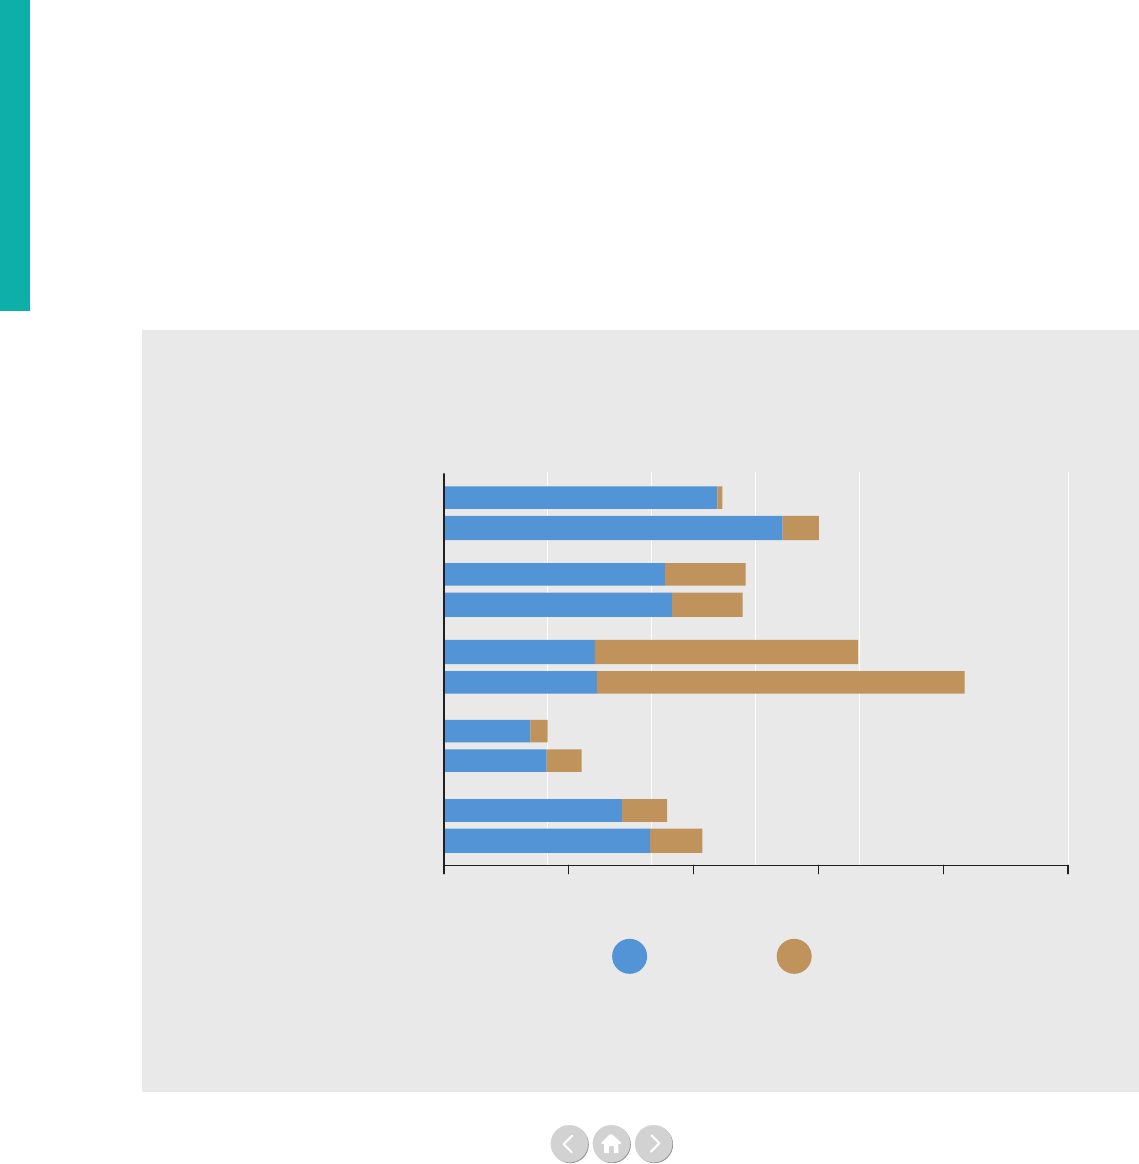
40
Revenue
Figure 10: Channels of total multilateral assistance from OECD-DAC countries,
core and earmarked, 2013 and 2017
Source: Organisation for Economic Co-operation and Development (OECD)
For notes – see page 183.
0 5 10 15 20 25
Other multilateral institutions
Regional development banks
UN development system
World Bank Group and
International Monetary Fund
European Union institutions
15.0
11.2
12.1
12.0
4.2
5.5
9.0
10.4
16.6
20.9
US$ billion
Earmarked
Core
2013
2017
2013
2017
2013
2017
2013
2017
2013
2017
Continuing the multilateral comparative perspective
through the lens of OECD-DAC funding, we do see
major funding dierences and trends between the multi-
lateral institutions. The higher levels of earmarking as
compared to core funding distinguish the UN system in
comparison to other multilateral institutions as is evident
in Figure 10 below. Moreover, the share of earmarking
has increased substantially in the UN in recent years.
In 2017, of the US$ 20.9 billion of multilateral aid
channelled through the UN development system,
71% was earmarked, against 64% of the US$ 16.6 billion
in 2013.
Who funds the UN?
So far, we have looked at what is being funded and how,
but our next question is, who is funding the UN? The
simple answer is that governments still provide the lion’s
share of the funding for the UN development system.
As we can see in Figure 11 on the next page, they
constituted 74% of the direct funding to the UNDS,
not including the indirect funding from, for example,
the 28 EU governments’ funding channelled via the
European Union institutions or the governmental
nancial resources routed through the vertical funds.
EU institutions are almost exclusively nanced by the
EU Member States through a negotiated, in part means-
based, membership fee while the vertical funds are
funded by both governments and, in some cases, non-
state actors such as foundations.
In 2017, 57% of the funding for UN operational
activities came directly from OECD-DAC contributors,
slightly less than the previous year (60%). The European
Union institutions have emerged as a major contributor
to the UN in the last decade; they directly funded 7%
of the total revenue for the UN operational activities in
2017 compared to 9% in 2016.
The non OECD-DAC countries contributed 11%, in
contrast to 12% in the previous year. Global vertical
funds and UN inter-agency pooled funds both contrib-
uted 6% to the UN operational activities (both 5%
in 2016).
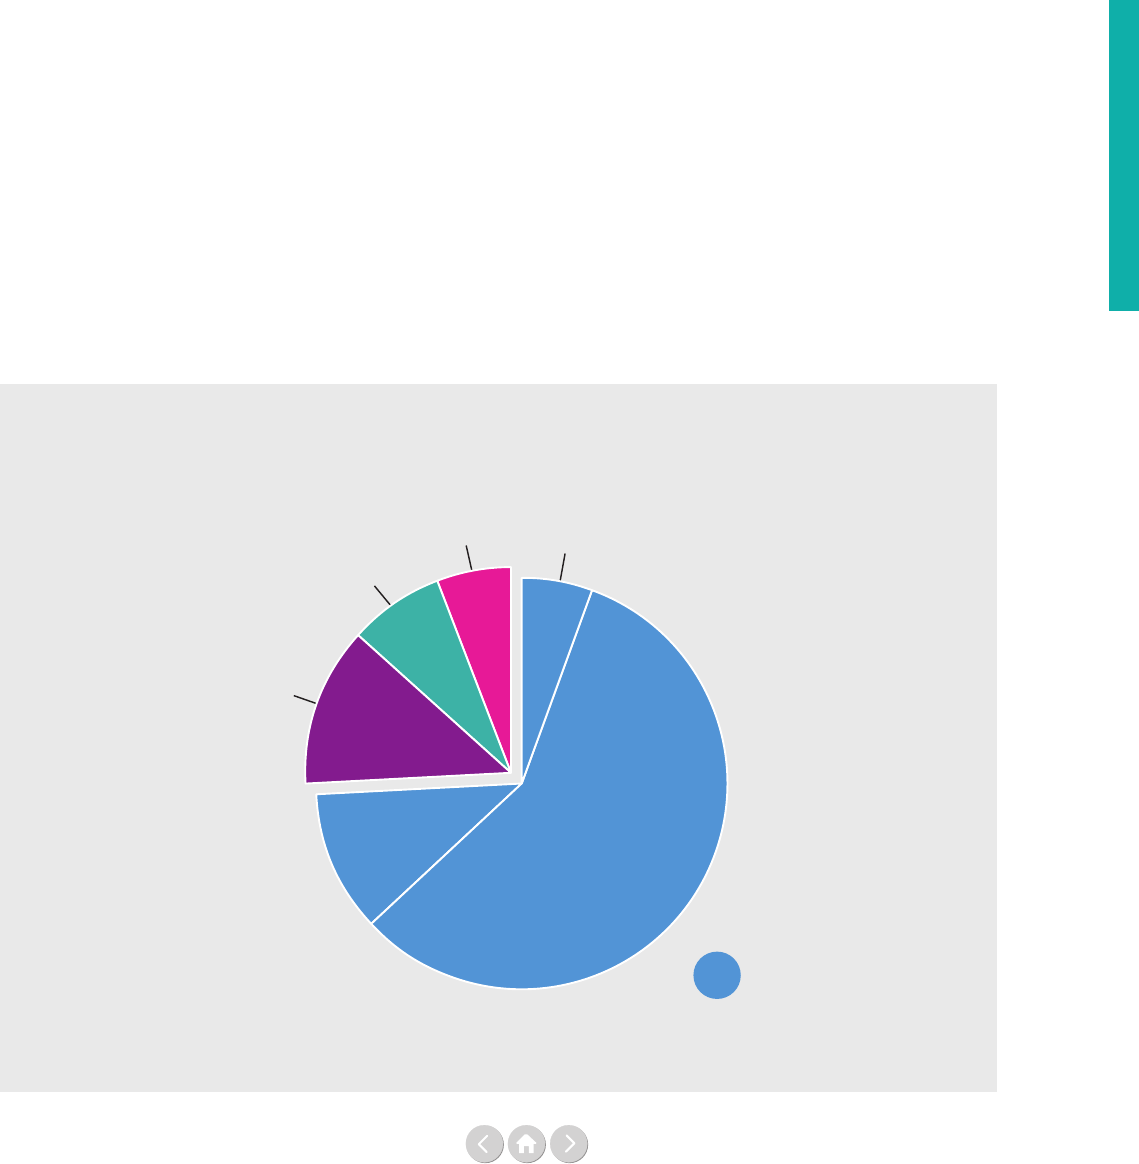
41
Revenue
Even though non-state contributions from non-govern-
mental organisations (NGOs), foundations, the private
sector and others are growing signicantly as sources of
revenue for the UN (from 9% in 2016 to 13% in 2017),
they remain a relatively small source of revenue for most
UN entities. The clear exceptions are UNICEF and the
World Health Organization (WHO), who both
received around 20% of their total revenue from
non-state contributors, and together with UNHCR
accounted for over 80% of the UN’s non-state funding.
Figures 12 through 17 on the next page present a visual
breakdown of the non-state funding by entity for six
UN entities. The largest UN recipient of non-state
contributions was UNICEF, in nominal terms; the second
and third largest in nominal terms, were WHO and
UNHCR respectively.
Figure 11: Funding sources for UN operational activities, 2017
Source: Report of the Secretary-General (A/74/73-E/2019/4)
For notes – see page 183.
Inter-agency pooled funds
6%
Vertical funds
6%
European Union institutions
7%
NGO, private and others
13%
non OECD-DAC
11%
OECD-DAC
57%
Governments 74%
UNHCR disaggregates private sector funding between
‘Individual Giving’ and ‘Leadership Giving’. Donations
from private individuals stood at US$ 276 million in
2017, signicantly larger than the US$ 123 million
received from companies, foundations and philanthropists.
In the case of UNICEF, non-state funding is broken
down into resources from ‘Field oces’, ‘Individuals’
and ‘National Committees’. The National Committees
are a unique feature of UNICEF. Currently there are 34
National Committees established as independent local
non-governmental organisations. In 2017, collectively
they raised US$ 1,270 million which accounted for
20% of the entity’s annual income. This funding comes
through contributions from corporations, civil society
organisations and more than 6 million individual donors
worldwide.⁴
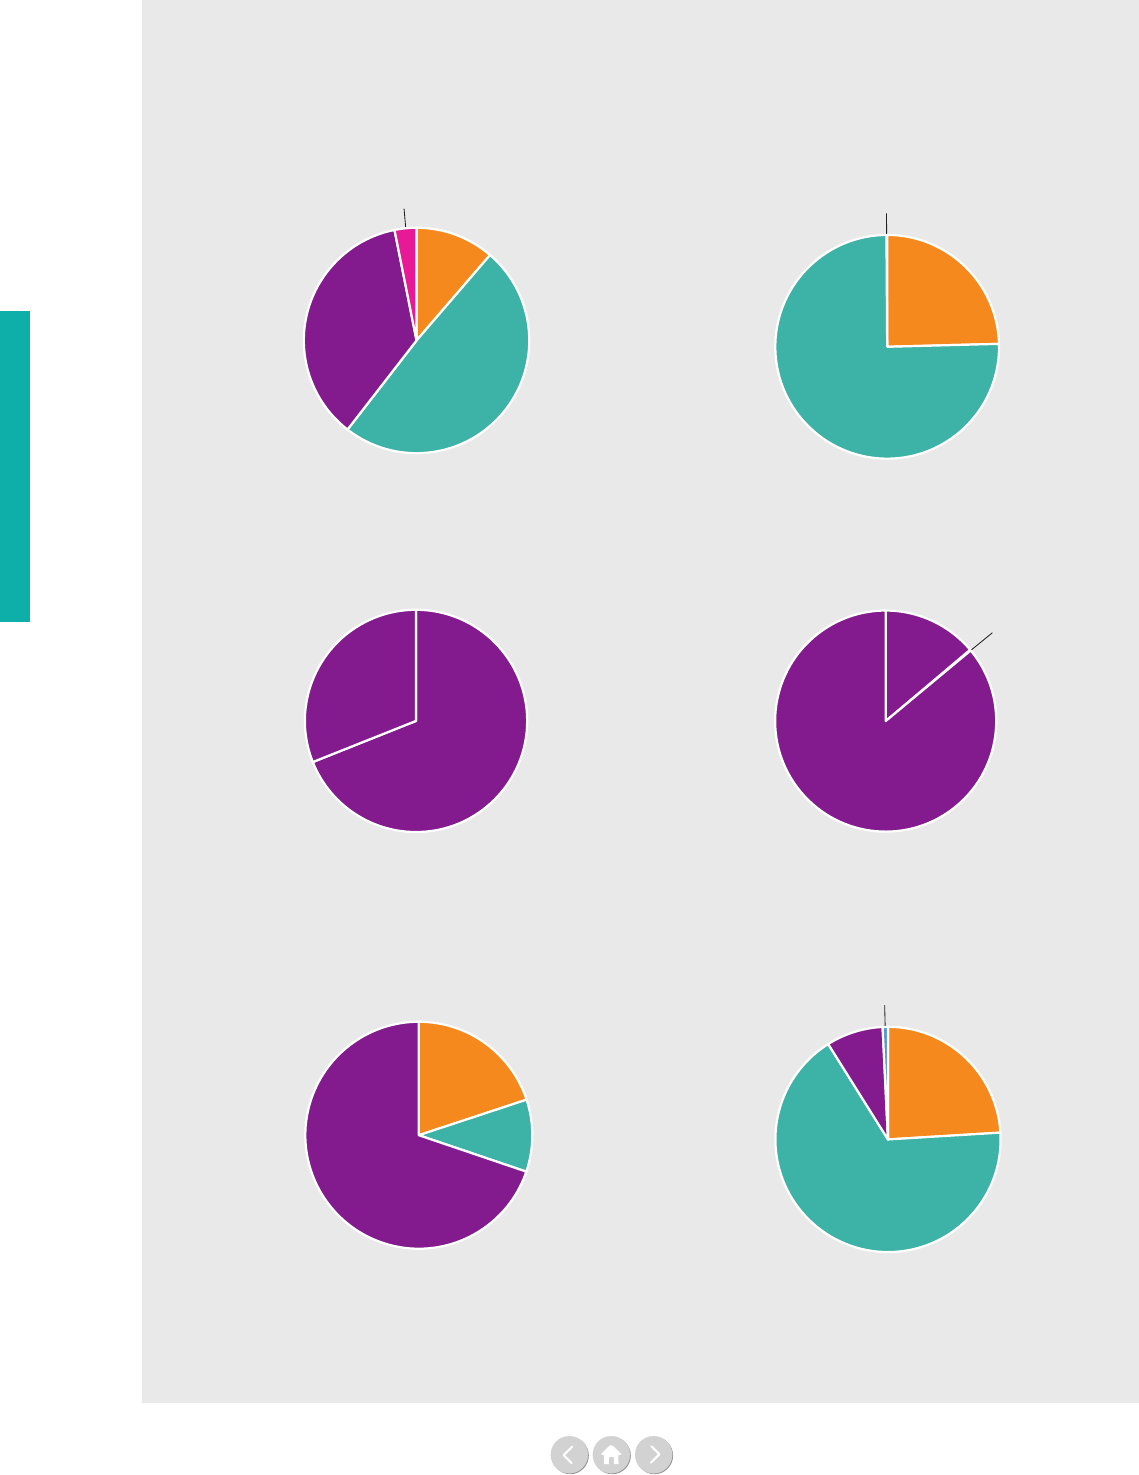
42
Revenue
Figures 12-17: Non-state revenue of six selected UN entities, 2017
Source: UNDP, UNFPA, UNHCR, UNICEF, WFP, and WHO.
For notes – see page 183.
Private sector
55.7 m
NGOs
15.9 m
Private sector
26.7 m
Other
2.3 m
NGOs
8.3 m
Foundations
36.1 m
Private sector
44.3 m
Private sector
0.02 m
Academic training and research
4.1 m
NGOs
130.6 m
Foundations
364.3 m
Private sector -
private individuals
276 m
Private sector -
companies,
foundations and
philanthropists
124.2 m
NGOs
4.7 m
Foundations
14.4 m
Private sector - field offices
204 m
Private sector -
individuals
2 m
Private sector -
national committees
1.270 m
Foundations
8.2 m
UNDP non-state revenue, 2017
WFP non-state revenue, 2017
US$ 73.4 million (1% of total revenue)
US$ 79.8 million (1% of total revenue)
WHO non-state revenue, 2017
UNFPA non-state revenue, 2017
US$ 543.3 million (20% of total revenue)
US$ 19.1 million (2% of total revenue)
US$ 400.2 million (9% of total revenue) US$ 1.476 million (22% of total revenue)
UNHCR non-state revenue, 2017 UNICEF non-state revenue, 2017
49%
11%
36%
67%
8%
24%
20%
10%
70%
25%
75%
31%
69%
14%
86%
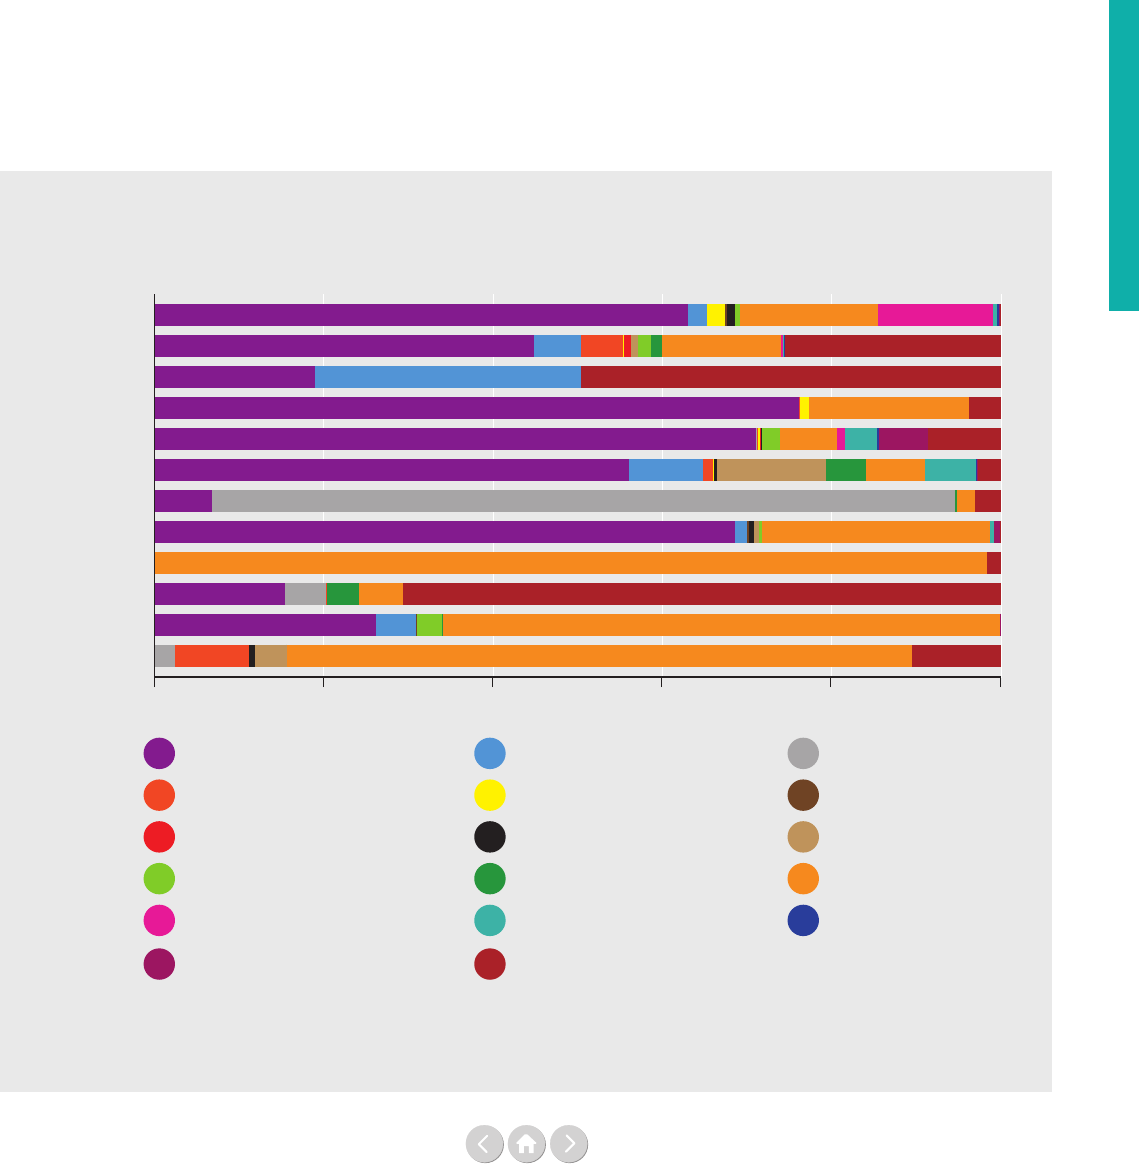
43
Revenue
OECD-DAC governments are still the major contribu-
tors to the UN – but which parts of their governments
are engaging and contributing? Traditionally, ODA and
multilateral aairs have been within the remits of foreign
wand development ministries, and/or development
agencies. Today, we can see a much more mixed picture
of involvement from a wider range of ministries and
other governmental institutions. Figure 18 below shows
a colourful mix of governmental involvement. This is
in line with the Sustainable Development Goals’ prin-
ciples of broader partnership and deeper integration of
policy-making where global issues are local. The border
between domestic and foreign aairs is being eroded,
Figure 18: Sources of ODA within 12 largest OECD-DAC members, as proportion of total, 2017
Source: Organisation for Economic Co-operation and Development (OECD)
For notes – see page 183.
as global and regional integration deepens, and global
discussions take place directly between responsible
ministries and for example a specialised UN agency.
As seen in a few examples in Figures 19-24 (next page),
this departmental integration in a sample of countries
and wider stakeholder interaction is manifested dier-
ently in the funding patterns of dierent administrations.
However, it does not directly suggest that all decision-
making in each of these specic cases is therefore more
decentralised (as it just registers the agency channelling
the ODA), but it represents an interesting trend of a
wider circle of stakeholders potentially interacting with
the UN.
0% 20% 40% 60%
United States
Germany
EU institutions
Japan
United Kingdom
France
Rep. of Korea
Sweden
Netherlands
Italy
Norway
Canada
80% 100%
Other ministries/miscellaneous
Export credit agencies
Local governments
Development finance institutions
Development cooperation agencies
Ministries of labour
Ministries of transport/trade/business
or donor country promotion
Ministries of interior/justice/security/
governance
Ministries of health
Ministries of environment/energy/climate
Ministries of finance
Ministries of education and
other research agencies
Ministries of foreign affairs
Ministries of audit/treasury
Ministries of culture/media
Ministries of defence/police
Ministries of agriculture
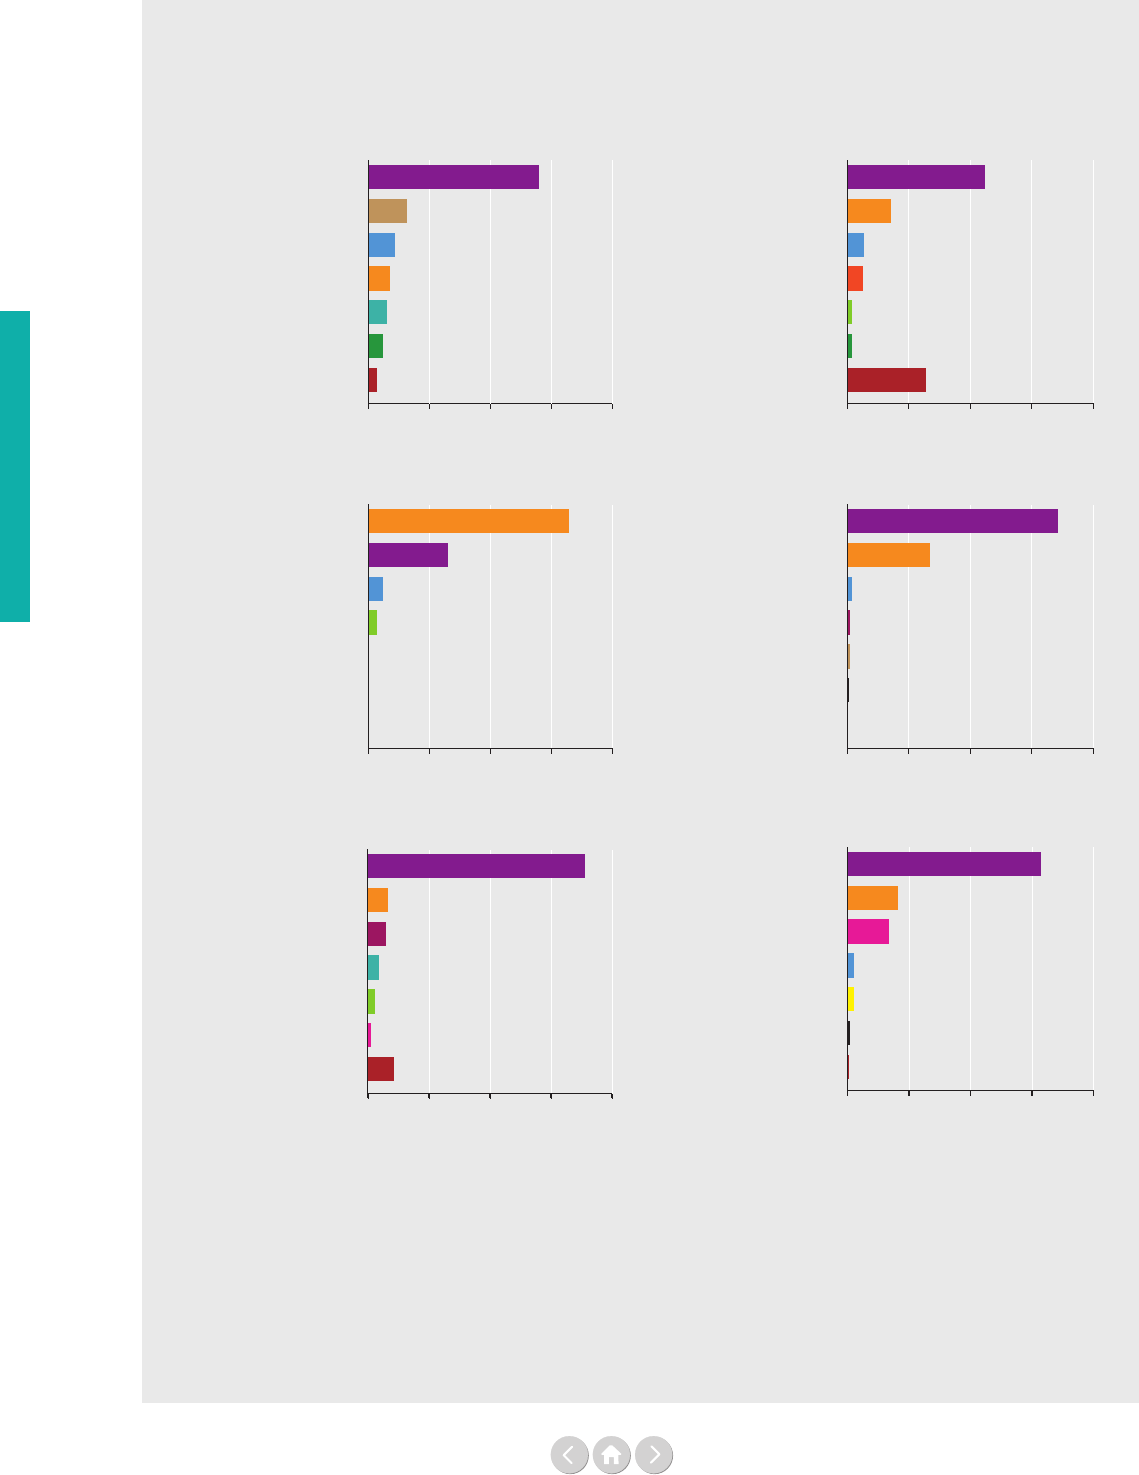
44
Revenue
Figures 19-24: Funding sources within six OECD-DAC contributing countries financing ODA, 2017
Source: Organisation for Economic Co-operation and Development (OECD)
For notes – see page 183.
0% 20% 40% 60% 80%
0% 20% 40% 60% 80%
0% 20% 40% 60% 80%
0% 20% 40% 60% 80%
0% 20% 40% 60% 80%
0% 20% 40% 60% 80%
Other
Ministry of Finance
Ministry of Interior/Justice/
Security/Governance
Ministry of Foreign Affairs
Development finance institutions
Ministry of Education and
other research agencies
56%
12.8%
8.7%
4.8%
2.7%
7%
6%
65.9%
26.1%
4.8%
0.1%
0%
2.9%
0.2%
68.6%
27%
1.4%
0.6%
0.1%
0.7%
0.7%
71.1%
6.7%
5.8%
1%
8.6%
3.7%
2.2%
44.8%
14%
5.5%
1.3%
25.7%
5%
1.5%
63%
16.3%
13.6%
0.9%
0.1%
2.2%
2.2%
Other
Ministry of Finance
Ministry of Environment/
Energy/Climate
Local governments
Development finance institutions
Ministry of Foreign Affairs
Development cooperation agencies
Other
Ministry of Defence/Police
Ministry of Agriculture
Development finance institutions
Ministry of Health
Ministry of Foreign Affairs
Development cooperation agencies
Other
Ministry of Audit/Treasury
Ministry of Finance
Ministry of Environment/
Energy/Climate
Development finance institutions
Development cooperation agencies
Ministry of Foreign Affairs
Other
Ministry of Defence/Police
Ministry of Education and
other research agencies
Ministry of Transport/Trade/Business
or donor country promotion
Development finance institutions
Ministry of Foreign Affairs
Development cooperation agencies
Other
Ministry of Health
Ministry of Environment/
Energy/Climate
Ministry of Interior/Justice/
Security/Governance
Ministry of Transport/Trade/Business
or donor country promotion
Ministry of Foreign Affairs
Development cooperation agencies
France
Norway
Germany
Sweden
United States
United Kingdom
Development cooperation agencies
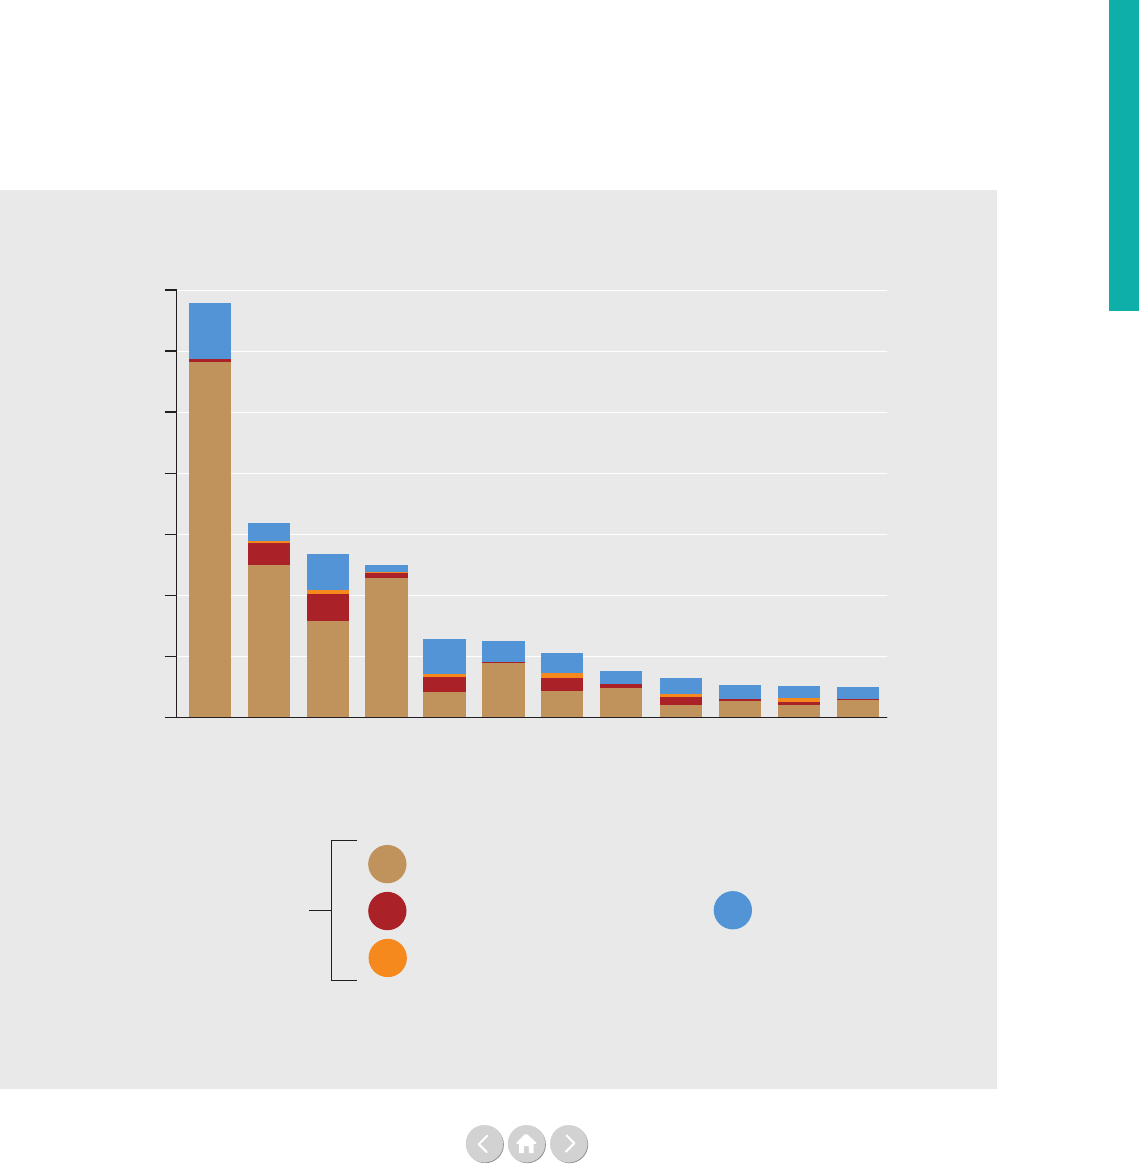
45
Revenue
The majority of contributions to the UN from Member
States are provided by a small group of top contributors.
Figure 25 below shows the funding mix of the top 12
OECD-DAC members to UN-OAD, with contributions
broken down in core, inter-agency pooled funds, single-
agency thematic funds and other earmarked funds.
In 2017, these top OECD-DAC members provided 65%
of the total contributions for UN operational activities.
In the past ve years, this share has grown by four
percentage points (from 61% in 2013). Denmark was
the country amongst the top 12 OECD-DAC contri-
butors that in relative terms increased its funding the
most: Danish funding to the UN went from US$ 307
million to US$ 512 million between 2016 and 2017
(a growth rate of 67%).
The top 12 non-OECD contributors are shown in
Figure 26 on the next page, ranked according to their
total contributions to UN-OAD, excluding local
Figure 25: Funding mix of the top 12 OECD-DAC members to UN operational activities, 2017
Source: Report of the Secretary General (A/74/73 – E/2019/4) and UN Pooled Funds Database
For notes – see page 183.
0
1
2
3
4
US$ billion
5
6
7
= total core
14%
9%
22%
5%
44%
28%
31%
27%
42%
41%
37%
39%
Inter-agency pooled funds
Earmarked excluding pooled
and thematic funds
Single-agency thematic funds
Total earmarked
Denmark
Netherlands
Canada
Japan
United Kingdom
EU institutions
United States
Italy
Switzerland
Norway
Sweden
Germany
Core
resources. However, local resources were added to the
gure after the top 12 contributors had been identied.
These top non OECD-DAC countries funded 7% of
the total of contributions of UN operational activities in
2017, the number in 2016 was 6% and 8% in 2015.
The top ve non OECD-DAC countries, China, Russian
Federation, Colombia, Saudi Arabia and Qatar, contri-
buted 51% of the total funding for UN operational
activities originated from non OECD-DAC countries.
Comparing to 2016, of all other non OECD-DAC
countries, China increased its funding the most in
nominal terms. In 2017, China showed an increase of
US$ 149 million of both core and earmarked contribu-
tions to the UN. Qatar was the country amongst the top
12 contributors that in relative terms increased its fund-
ing the most as it augmented its funding by more than
200% to the UN, with a large portion of this increase
channelled through UN inter-agency pooled funds.
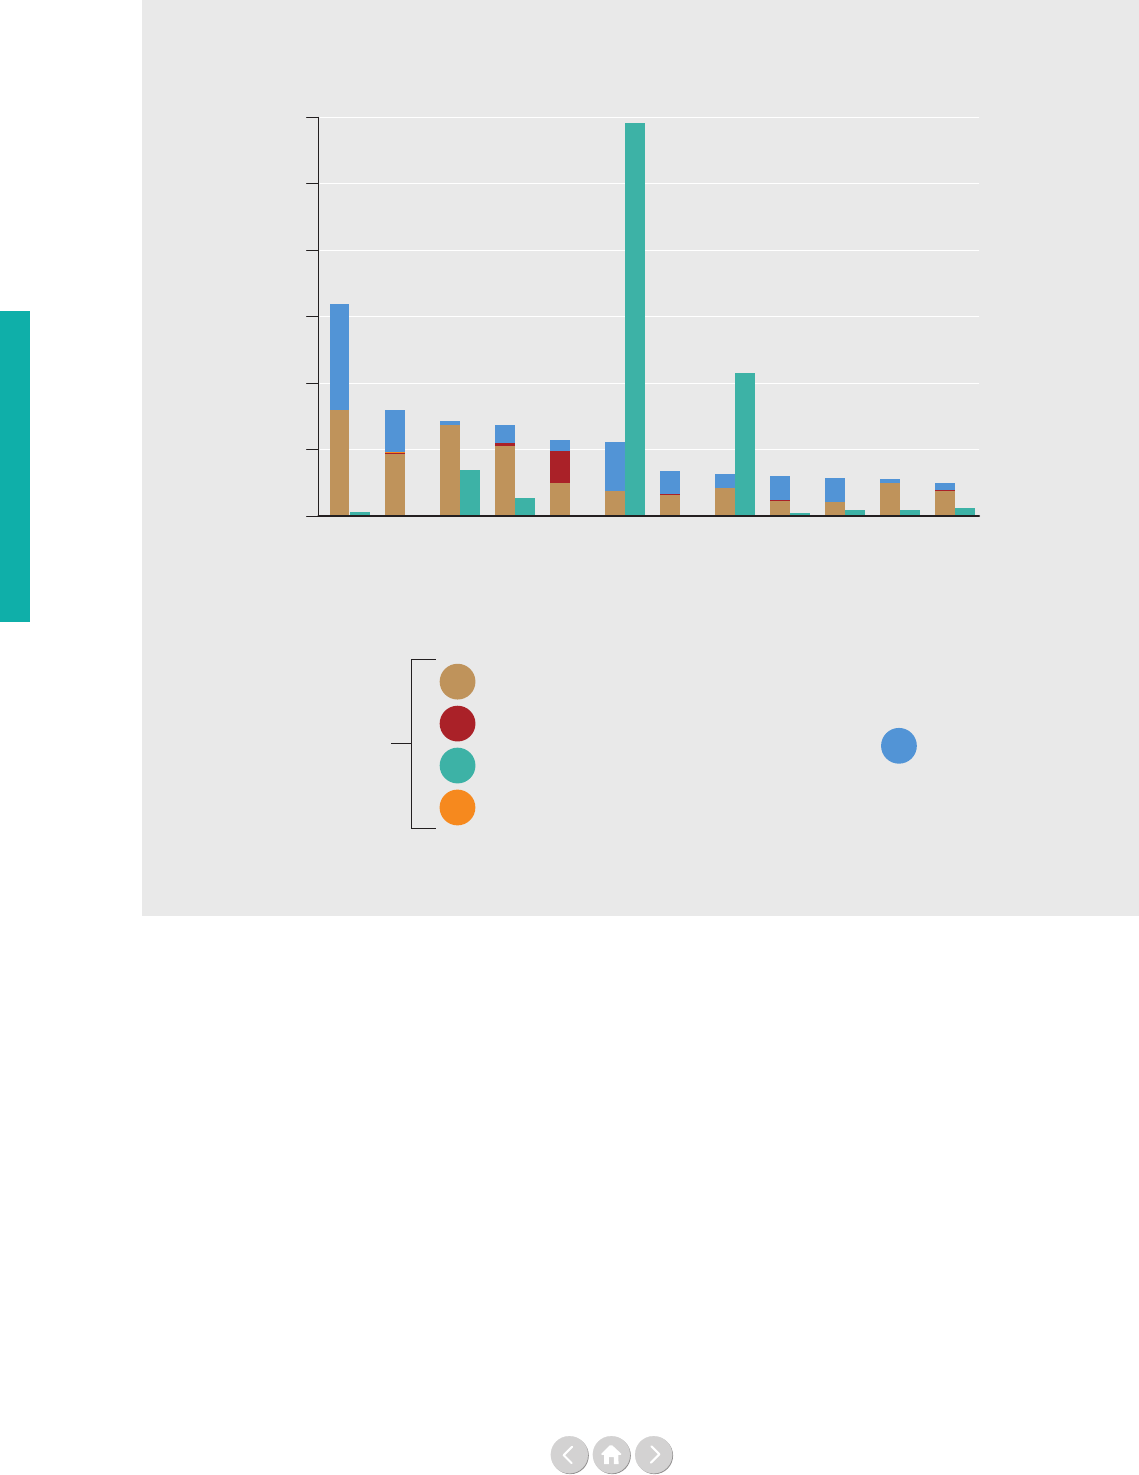
46
Revenue
Figure 26: Funding mix of the top 12 non OECD-DAC countries contributing to UN
operational activities, 2017
Source: Report of the Secretary General (A/74/73 – E/2019/4) and UN Pooled Funds Database
For notes – see page 183.
Single-agency thematic funds
US$ million
Inter-agency pooled funds
Local resources
Earmarked excluding pooled and thematic funds
Total earmarked
Pakistan
India
United Arab Emirates
Qatar
Colombia
China
Kuwait
Mexico
Argentina
Brazil
Saudi Arabia
Russian Federation
0
100
200
300
400
500
600
Core
UNDS reform - new funding initiatives
The 1% levy on tightly earmarked funding
Resolution A/RES/72/279 on the repositioning of the
UN development system was adopted by the General
Assembly on 31 May 2018.⁵ It saw the introduction
of a 1% coordination levy on tightly earmarked
third-party contributions to UN development-related
activities.⁶ This is part of an integrated eort to fund
the new Resident Coordinator system. The levy should
be paid at source by the contributors and not be charged
to local government cost-sharing arrangements or to
cooperation among programme countries. The levy
should, in addition, also have an incentivising eect
and steer contributions more towards exible funding
arrangements.
The levy system was launched in 2019 and operation-
alised by the UN with the following denition of
‘tightly earmarked’ and the below guidance for UN
entities to know when and how to charge the 1% levy.
Operational guidance for the UN on the 1% levy:
• A contribution agreement is potentially subject to
the levy if all the following conditions are true.
• The contribution will fund development-related
activities.
• The contribution is tightly earmarked to a single
entity programme or project.
• The contribution is from a single donor.
There are exemptions to the levy. For a list, please go to
Endnote 6 on page 180.
47
Revenue
A new Funding Compact
between the UN and its Member States
For the UN, its Member States and its institutions, it has
been considered paramount to collectively agree on a
key set of measurable commitments on funding and
system-wide functions so the UN can maximise its
contribution to the achievement of the 2030 Agenda.
Therefore, it was a notable step in July 2019 when the
UN Economic and Social Council (ECOSOC)
resolution E/RES/2019/15 declared that the Member
States of the United Nations welcome the Funding
Compact, and encourage all Member States and entities
of the UN development system to contribute to its full
and eective implementation.⁷
The core idea of the Funding Compact is to give incen-
tives for Member States to contribute more qualitatively,
exibly and predictably alongside incentives to UN
development entities to increase coherence and co-
operation, make full use of eciency gains and increase
transparency, as illustrated in Figure 27.
Figure 27: Why a Funding Compact?
For notes – see page 184.
MEMBER STATES UN DEVELOPMENT SYSTEM
Why a Funding Compact?
A partnership to deliver better results on the ground
A FUNDING COMPACT
makes it possible to
plan strategically
offer coordinated
and integrated solutions
act quickly
leverage development
and climate finance
How do you measure the quality of funding?
The Funding Compact emphasises core, pooled and
single-agency thematic funding modalities. This is to
ensure the UN can operate exibly and coherently, and
to foster results on the ground. It provides for measur-
ability, visibility and a mechanism for follow-up
periodically. A number of key indicators to measure
success is included in the Funding Compact, amongst
them and related to funding of the UN development
system, notably:
• At least 30% of the total funding to the UN
entities of the UNDS should be core funding by
2023 – to improve exibility and delivery of
the UN entities. The commitment is measured by
two separate indicators, one including and the other
excluding assessed contributions. Just like the other
indicators, this only refers to development-related
funding (excluding humanitarian funding).
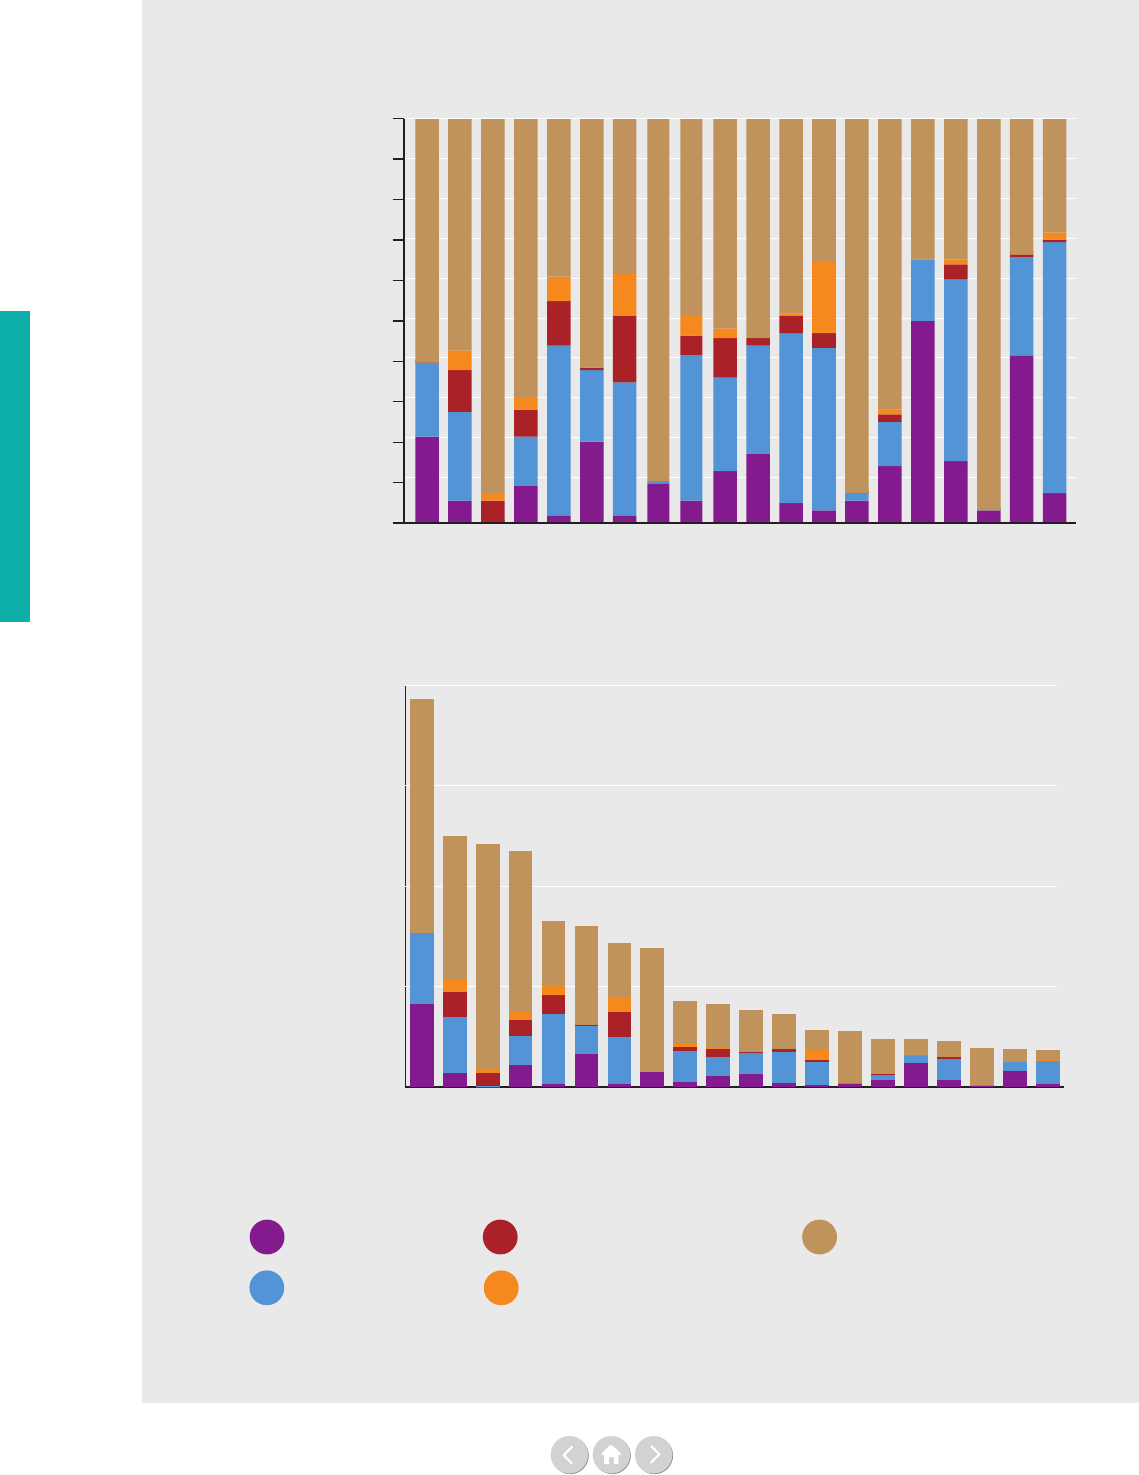
48
Figure 28a and 28b: Development assistance funding mix of the top 20 contributors to the
UNDS, including assessed contributions, 2017
Source: Report of the Secretary General (A/74/73-E/2019/4) and UN Pooled Funds Database
For notes – see page 184.
Voluntary core
Assessed
Inter-agency pooled funds
Single-agency thematic funds
Earmarked excluding pooled
and thematic funds
100%
90%
80%
70%
60%
50%
40%
30%
20%
10%
0%
United States
United Kingdom
EU institutions
Germany
Sweden
Japan
Norway
Brazil
Netherlands
Canada
Italy
Switzerland
Denmark
Argentina
Republic of Korea
China
Australia
Colombia
France
Belgium
500
1,000
1,500
2,000
Voluntary core
Assessed
Inter-agency pooled funds
Single-agency thematic funds
Earmarked excluding pooled
and thematic funds
United States
United Kingdom
EU institutions
Germany
Sweden
Japan
Norway
Brazil
Netherlands
Canada
Italy
Switzerland
Denmark
Argentina
Republic of Korea
China
Australia
Colombia
France
Belgium
US$ million
Figure 28a:
Figure 28b:
500
1,000
1,500
2,000
Voluntary core
Assessed
Inter-agency pooled funds
Single-agency thematic funds
Earmarked excluding pooled
and thematic funds
United States
United Kingdom
EU institutions
Germany
Sweden
Japan
Norway
Brazil
Netherlands
Canada
Italy
Switzerland
Denmark
Argentina
Republic of Korea
China
Australia
Colombia
France
Belgium
US$ million
Revenue

49
Overview
• Double the contributions to UN inter-agency pooled
funding to incentivise UN-wide coherence, scale-up,
results and common delivery. The commitment is
measured by the share of the total contributions to
non-core that is going to UN Pooled Funds – from
5% (2017 baseline) of ear marked funding to 10% in
2023.
• Double the contributions to single-agency thematic
funds. It should be increased from 3% (2017)
to 6% by 2023 to increase exibility and delivery of
UN entities.
• Increase the multi-year commitments to the UNDS
to enable resource planning and give more
predictability.
• Increase the number of contributors to core, UN
inter-agency pooled funds and single-agency
thematic funds, to make the UNDS less reliant
on a few contributors.
The Funding Compact is a collective commitment for
the UN Member States. The funding mix of the top
20 contributors to the development-related activities of
UNDS can be found in Figure 28a and 28b.
Other key commitments of the Funding Compact, such
as transparency and data, are elaborated on in Chapter
Three.
Levels of funding by UN Member States
So far, we have looked into who is funding the UN,
who receives funds and how. In Figures 29-32 (see pages
50-51), the analysis goes one step further and investigates
the levels of funding UN Member States are contribut-
ing to six UN entities: UNDP, UNHCR, UNICEF, the
United Nations Relief and Works Agency for Palestine
Refugees in the Near East (UNRWA), WFP and WHO.
Figure 29 shows the top ten OECD-DAC contributors
and how these Member States contribute core resourc-
es to each UN entity. In Figure 30 we do the same for
the non OECD-DAC countries. The analysis continues
in Figures 31 and 32, looking at the same two sets of
contributors and UN entities but examining earmarked
resources instead.
Together these gures show a range of funding patterns.
All the top ten OECD-DAC countries contribute core
resources to all the six UN entities, to some extent, and
the total portfolio of contributions is not dominated by
one single entity; however, the focus of their funding
varies.
For the non OECD-DAC countries, the pattern of core
contributions is partly dierent. The largely assessed core
funding of WHO dominates with regards to many of
the countries. A regional dimension is also visible in the
relative funding focus on, for example, UNRWA. The
voluntary core funding to UNDP, UNHCR, UNICEF
and WFP is less prominent in the funding mix of the
non OECD-DAC countries.
With regards to earmarked funding, which is shown in
Figures 31 and 32, a higher concentration of funding to
humanitarian-assistance focused entities (UNHCR, WFP,
and, in part, UNICEF) is visible amongst the OECD-
DAC countries, when compared with their core funding
pattern. Amongst the non OECD-DAC countries the
opposite trend and a focus on development focused UN
entities is visible at a glance. In a number of countries,
local cost sharing arrangements through UNDP make
up the larger part of the earmarked contributions. The
picture is, however, varied and for Saudi Arabia, China,
Russian Federation and Kuwait the funding of the UN
entities is more mixed.
Revenue
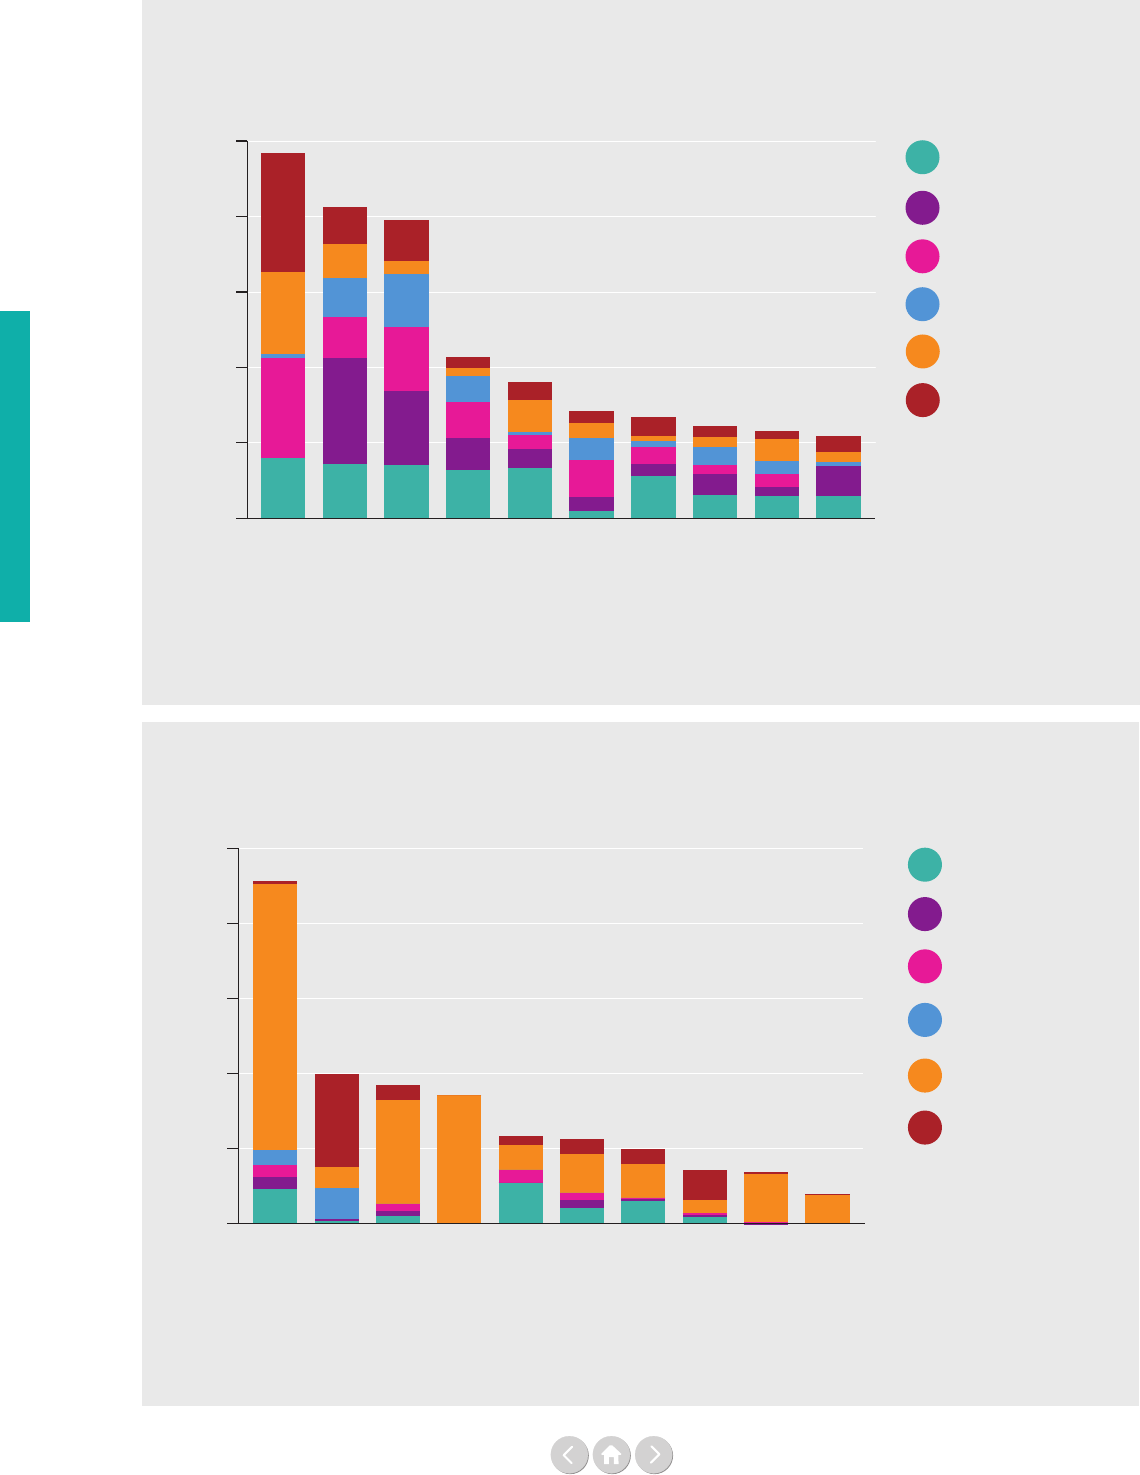
50
Revenue
Figure 30: Total core contributions from the top ten non OECD-DAC countries
to six selected UN entities, 2017
Source: Chief Executives Board for Coordination (CEB)
For notes – see page 184.
United Arab Emirates
Argentina
Mexico
Kuwait
Turkey
Saudi Arabia
India
Brazil
Russian Federation
China
UNDP
UNHCR
UNICEF
WFP
WHO
UNRWA
US$ million
0
10
20
30
40
50
45.7
20.0
18.5
17.1
11.7
11.3
10.0
7.2
6.9
4.0
Figure 29: Total core contributions from the top ten OECD-DAC countries
to six selected UN entities, 2017
Source: Chief Executives Board for Coordination (CEB)
For notes – see page 184.
Netherlands
Germany
Canada
Switzerland
Australia
Japan
Norway
Sweden
United Kingdom
United States
UNDP
UNHCR
UNICEF
WFP
WHO
UNRWA
US$ million
0
100
200
300
400
500
484
413
395
214
180
142
134
123
116
109
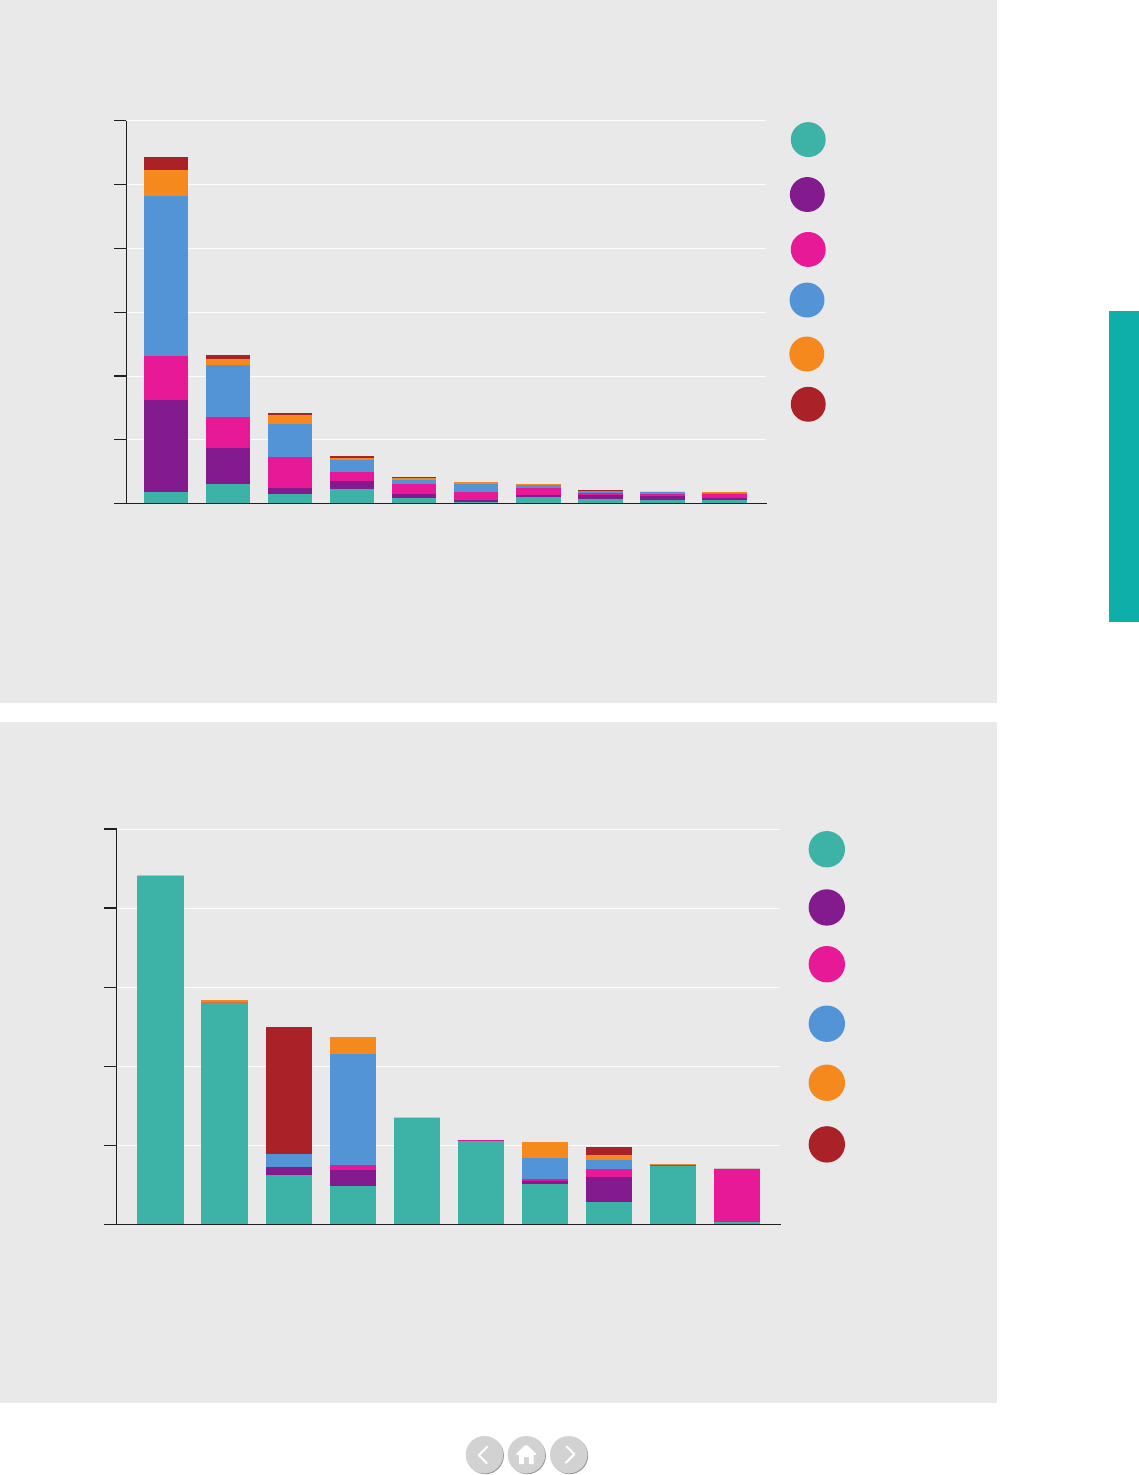
51
Revenue
Figure 31: Total earmarked contributions from the top ten OECD-DAC donors
to six selected UN entities, 2017
Source: Chief Executives Board for Coordination (CEB)
For notes – see page 184.
Figure 32: Total earmarked contributions from the top ten non OECD-DAC countries
to six selected UN entities, 2017
Source: Chief Executives Board for Coordination (CEB)
For notes – see page 184.
Netherlands
Denmark
Italy
Sweden
Canada
Norway
Japan
United Kingdom
Germany
United States
UNDP
UNHCR
UNICEF
WFP
WHO
UNRWA
US$ million
0
1,000
2,000
3,000
4,000
5,000
6,000
184188
208
308
339
414
741
1,410
2,332
5,434
36
38
49
52
53
68
118
125
142
220
Côte d’Ivoire
Panama
Kuwait
Russian Federation
Senegal
Colombia
China
Saudi Arabia
Ukraine
Argentina
UNDP
UNHCR
UNICEF
WFP
WHO
UNRWA
US$ million
0
50
100
150
200
250
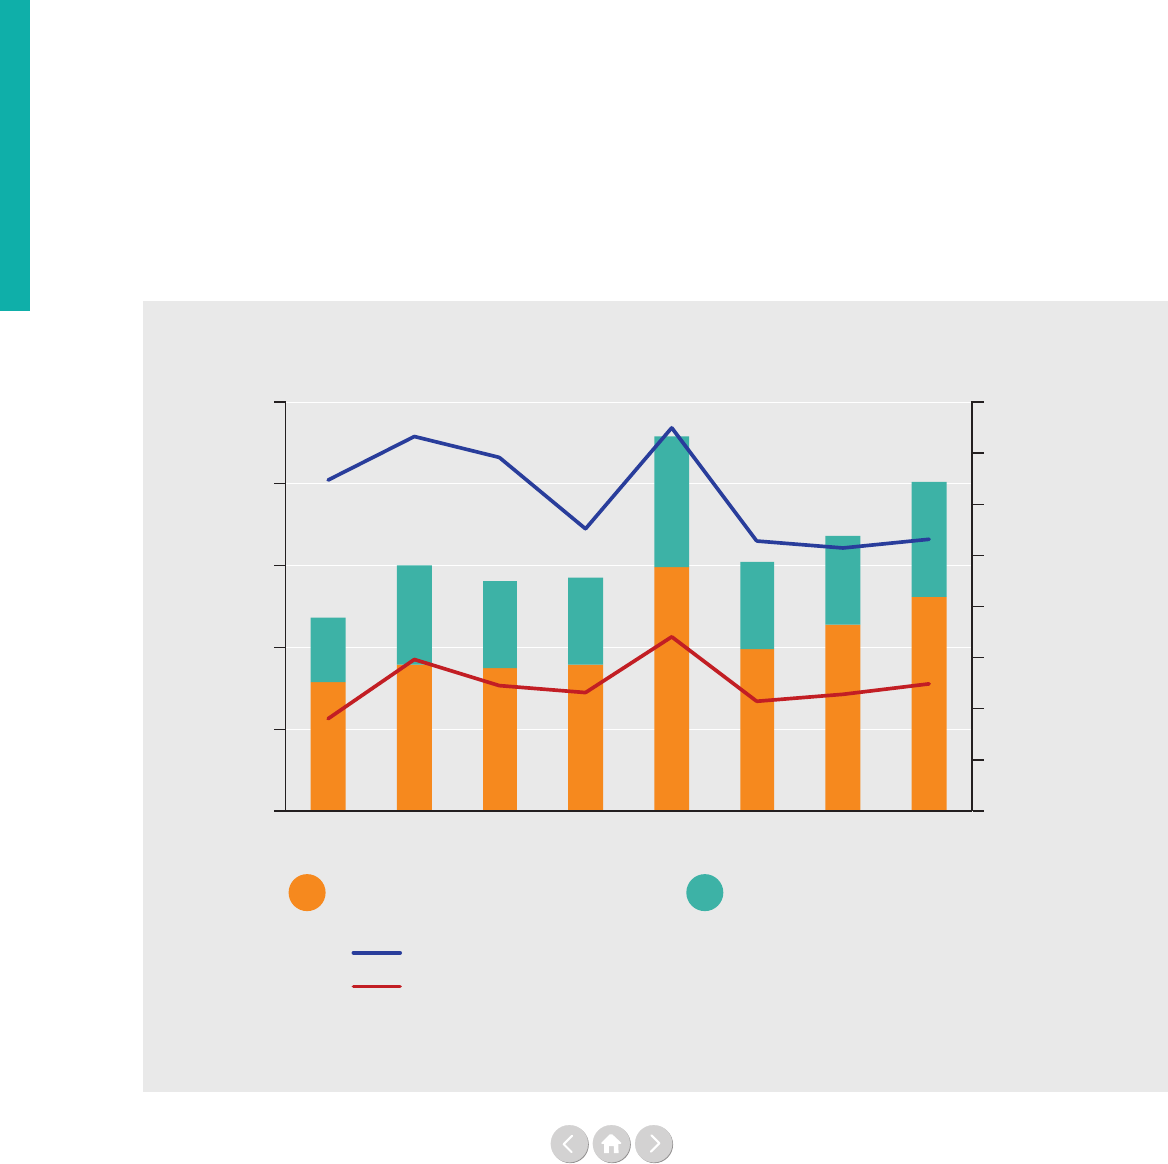
52
Revenue
To complement the analysis on core versus earmarked
funding, we now take a closer look at the use and scale
of UN inter-agency pooled funds. Figure 33 below
shows the deposits into UN pooled fund instruments
between 2010 and 2017. Apart from a spike in 2014, the
numbers have remained relatively stable with an upward
trend in the last couple of years.
The Funding Compact, described earlier in this chapter,
includes a target of doubling contributions to UN
inter-agency pooled funds by 2023. The indicator to
measure this target assesses the share of pooled fund
contributions within the total earmarked development-
related contributions. As seen in Figure 33, this share was
5% in 2017 and the ambition to double it, from the 2017
base-year, would mean a 10% share of UN pooled fund
contributions. In the humanitarian eld, the similar share
of inter-agency pooled funds is today 10% (as shown in
the same gure).
Figure 34 on the next page looks at the top 12
contributors to UN inter-agency pooled funds, and the
percentage represents the share of earmarked resources
they channel through pooled funds. The top ve donors
are all Member States from Europe and together
contributed 69% of the total UN inter-agency
pooled fund contributions. The top 12 list includes
OECD-DAC contributors from beyond Europe
(Canada as number six, and Australia and the United
States are also on the top 12 list). The only non
OECD-DAC member on the list is Qatar – who
contributed 45% of its total earmarked contributions
to UN inter-agency pooled funds.
Analysing the numbers further and disregarding the
absolute size of contribution - Figure 35 on the next
page shows the spread of countries with more than 10%
of their earmarked funding going to inter-agency pooled
funds. Ireland is the Member State with the highest share
of earmarked contributions owing through UN inter-
agency pooled funds in 2017 (50%). The trends of
inter-agency pooled funding are further elaborated on in
Part Two.
Figure 33: Deposits to UN inter-agency pooled funds, 2010–2017
Source: UN Pooled Funds Database
For notes – see page 184.
US$ billion
0
0.5
1.0
1.5
2.0
2.5 16%
14%
12%
10%
8%
6%
4%
2%
0%
20172016201520142013201220112010
Development assistance
Pooled funds % of total earmarked - humanitarian assistance
Pooled funds % of total earmarked - development assistance
Humanitarian assistance
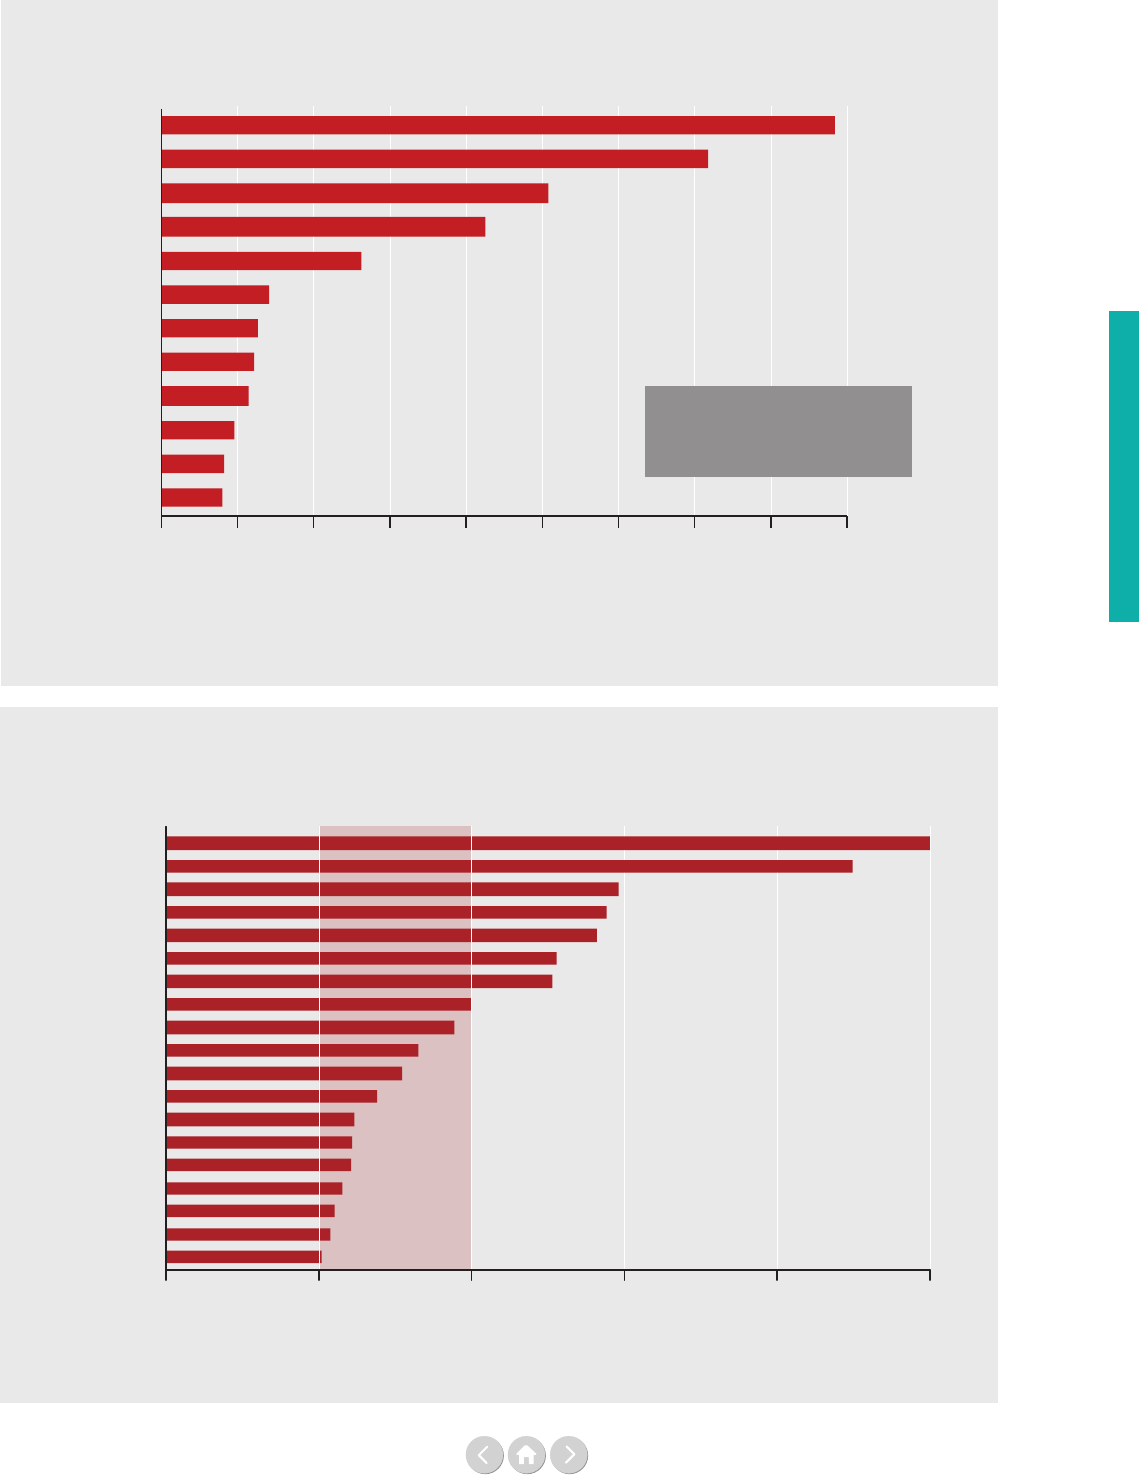
53
Revenue
Figure 34: Deposits to UN inter-agency pooled funds from the 12 largest contributors,
and share of their total earmarked contributions to the UN, 2017
Figure 35: Countries contributing more than 10% of their total earmarked funding to the UN
through UN inter-agency pooled funds, 2017
Source: Chief Executives Board for Coordination (CEB) and UN Pooled Funds Database
For notes – see page 184.
Source: Chief Executives Board for Coordination
(CEB) and UN Pooled Funds Database
For notes – see page 184.
US$ million
0 10050 200150 250 300 400350 450
United Kingdom
Germany
Sweden
Norway
Netherlands
Canada
Ireland
Belgium
Denmark
Qatar
Australia
United States
19%
12%
30%
26%
29%
12%
50%
28%
17%
45%
1%
12%
% = inter-agency pooled fund
share of total earmarked
contributions
50%
45%
30%
29%
28%
26%
25%
20%
12%
12%
12%
12%
11%
11%
10%
17%
15%
14%
19%
10% 20% 40%30% 50%
Ireland
Qatar
Sweden
Netherlands
Belgium
Norway
Malta
Liechtenstein
United Kingdom
Denmark
New Zealand
Iceland
Spain
Australia
Canada
Germany
Slovak Republic
Switzerland
Finland
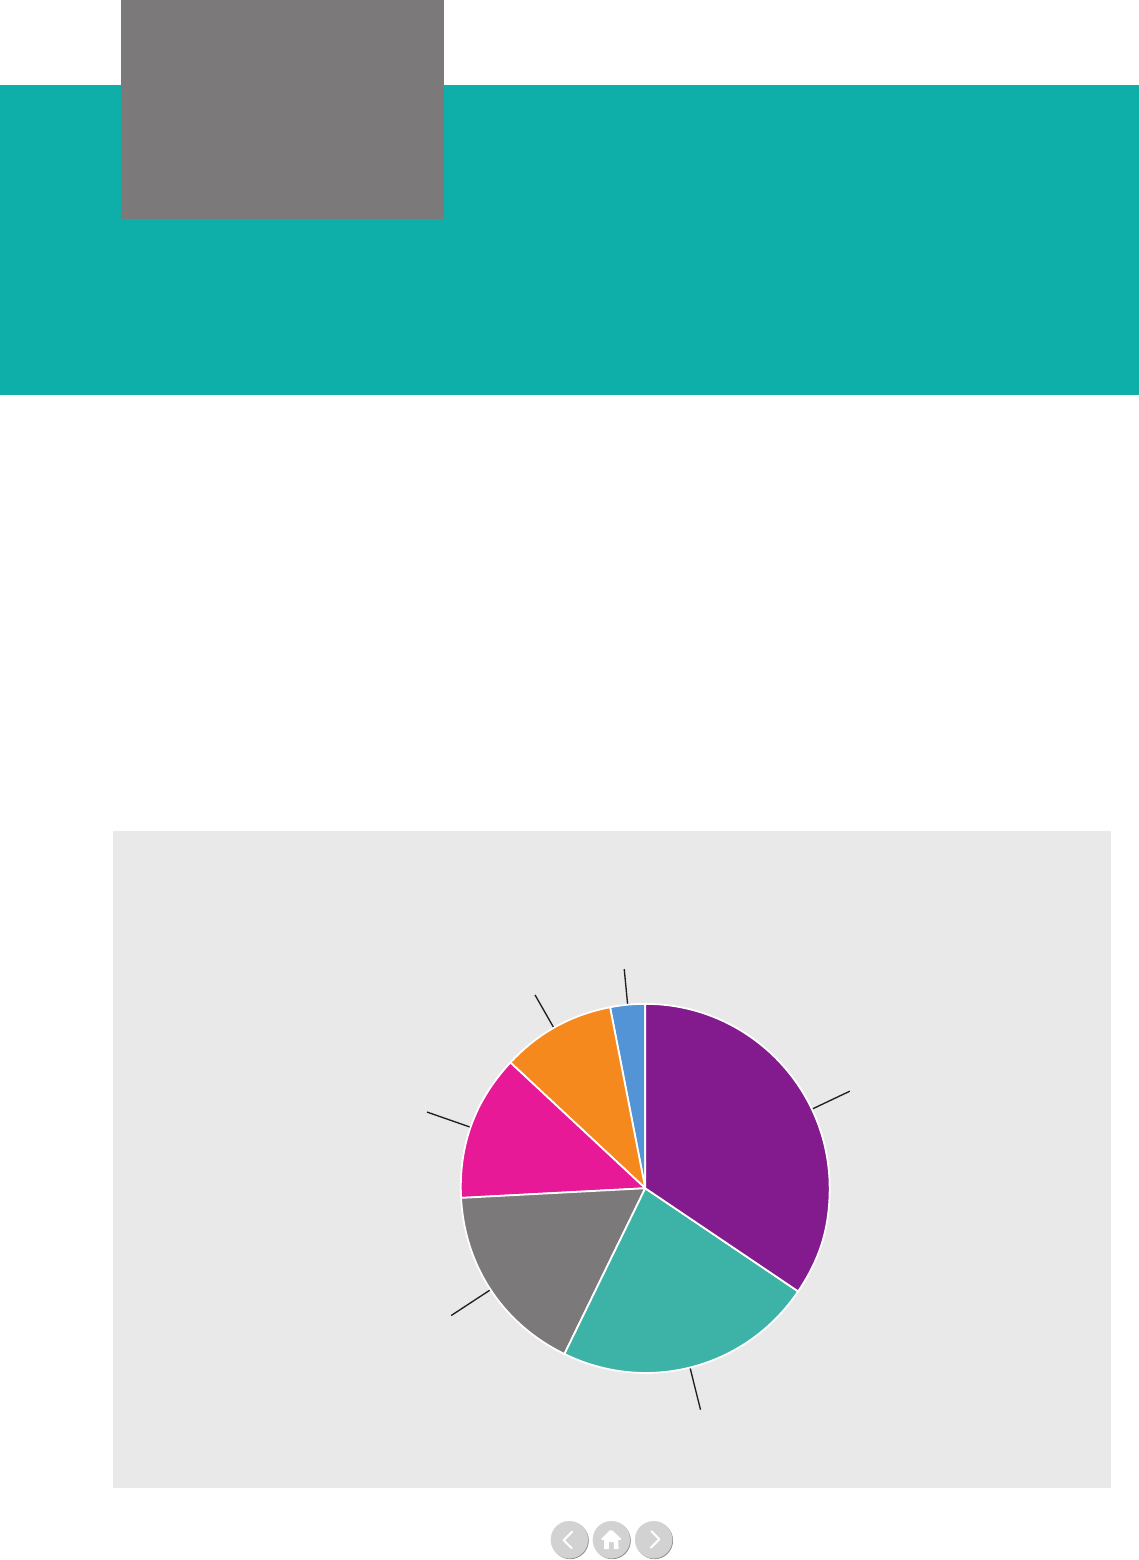
54
Expenditure
PART ONE
Chapter Two
In the rst chapter we examined the how, who and what
of UN funding. We are now going to look at the other
side of the coin – the spending of the UN system.
Where does the UN invest and how is the UN spending
on operational activities? Revenue and expenditures
must balance each other over time, as seen by comparing
the 2017 revenues by UN entity in Table 2a on page 30
with the 2017 expenditures by UN entity in Table 6 on
the next page. Looking at the table with total expendi-
ture numbers for the period 2005–2017 can help to get
a sense of the dynamics of UN nance at the individual
UN entity level and the shifting emphasis of the UN’s
operations. UN entities with strong humanitarian
mandates, such as UNHCR, UNICEF and WFP, have
Figure 36: Expenditure on UN operational activities by region, 2017
Source: Report of the Secretary-General (A/74/73-E/2019/4)
For notes – see page 184.
35%
23%
17%
13%
9%
Western Asia
Americas
Asia and the Pacific
Global and Interregional
Europe
3%
Africa
more than doubled their annual expenditures in the
period since 2005, while the growth in expenditures of
UN entities with a strong development mandate, such as
UNDP, has been more modest.
Figure 36 outlines expenditure on UN operational
activities by region. Africa remains the largest region of
UN investments in nancial terms, followed by
Western Asia and to a signicantly smaller degree
Asia and the Pacic, the Americas and Europe. Global
expenditure, which includes global normative work,
programme support, management and administration,
constituted 17% of all UN expenditure.
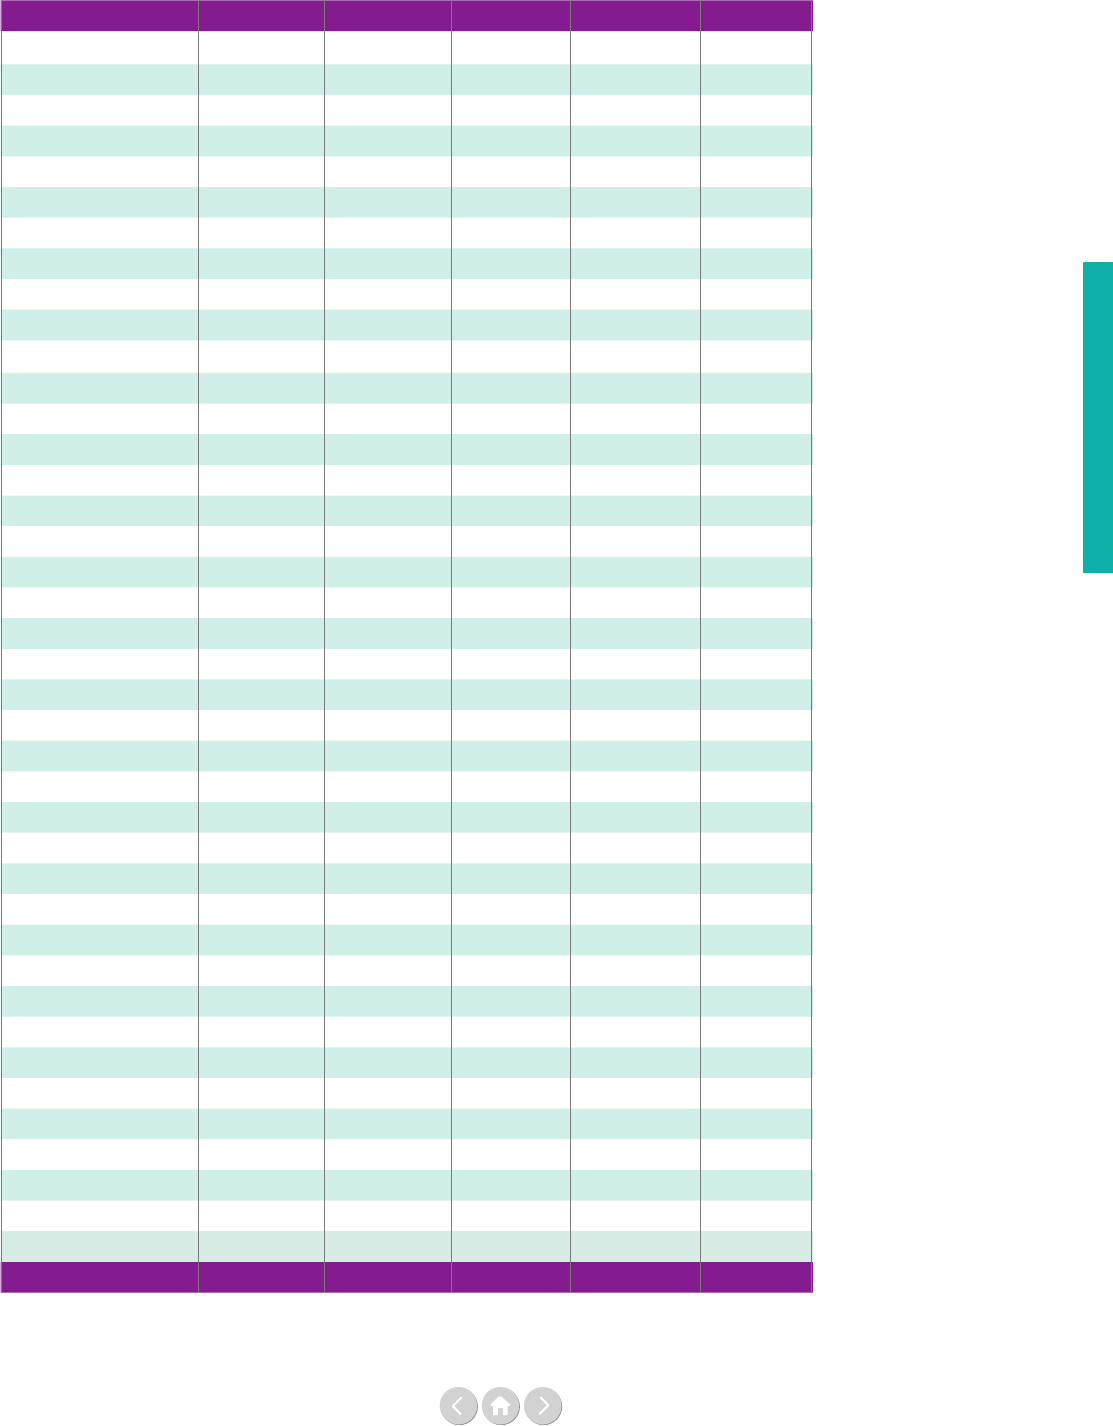
55
Entity 2005 2010 2015 2016 2017
UN Secretariat
2, 659 3,953 5,613 5,713 5,789
CTBTO
103 0 0 0 125
DPKO
4,074 7,616 8,759 8,876 8,264
FAO
772 1,415 1,219 1,202 1,532
IAEA
434 585 571 550 643
ICAO
186 235 195 192 215
ICC
0 0 0 0 187
IFAD
116 784 168 170 189
ILO
454 587 660 675 641
IMO
55 68 68 58 71
IOM
952 1,359 1,594 1,602 1,605
ITC
57 71 103 91 88
ITU
140 193 192 184 200
PAHO
165 927 1,379 1,363 1,435
UNAIDS
158 284 294 182 173
UNCDF
0 0 0 0 65
UNDP
4,573 5,750 5,057 4,660 5,095
UNEP
288 449 560 561 562
UNESCO
688 797 762 664 688
UNFCCC
29 0 0 0 95
UNFPA
523 824 977 923 927
UN-HABITAT
116 201 167 186 197
UNHCR
1,142 1,878 3,279 3,847 3,943
UNICEF
2,191 3,631 5,078 5,427 5,844
UNIDO
209 225 244 236 299
UNITAR
12 20 23 24 28
UNODC
94 211 279 242 309
UNOPS
58 65 672 770 816
UNRISD
0 0 0 0 2
UNRWA
471 555 1,334 1,317 1,310
UNSSC
0 0 0 0 10
UNU
32 60 75 90 108
UN Women
0 0 315 340 339
UNWTO
16 22 27 23 27
UPU
27 50 79 77 83
WFP
3,104 4,315 4,893 5,355 6,224
WHO
1,541 2,078 2,739 2,471 2,681
WIPO
199 324 352 347 404
WMO
73 88 102 98 108
WTO
148 226 247 249 258
Total 26,015 39,847 48,076 48,765 51,578
Source: Chief Executives Board for Coordination (CEB)
For notes – see page 186.
Table 6: Total expenditure by UN entity, 2005–2017 (US$ million)
Expenditure
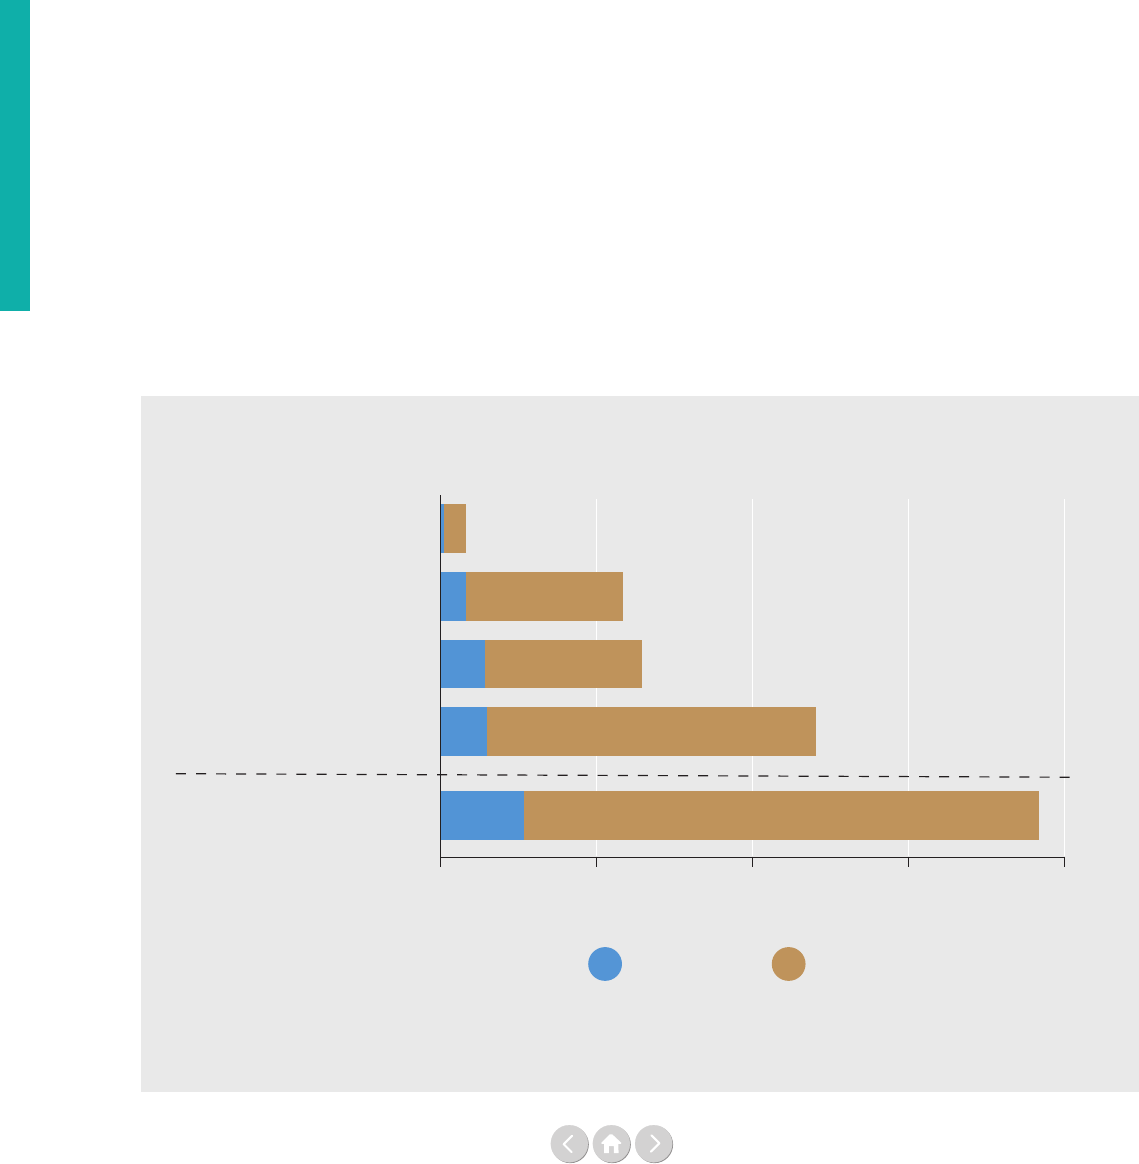
56
Expenditure
Figure 37: Expenditure on UN operational activities by countries’ income status, 2017
Source: Report of the Secretary-General (A/74/73-E/2019/4)
* The 50 crisis-aected countries are drawn from the other country categories.
For notes – see page 184.
High-income (66 countries)
Upper middle-income (56 countries)
Lower middle-income (47 countries)
Low-income (35 countries)
Of which crisis-aected
countries (50 countries)*
US$ billion
0 5
0.8
5.9
6.5
12.0
19.2
10 15 20
Earmarked
Core
When comparing the UN expenditures with previous
years, the share of the Western Asia region has grown the
most, from 17% in 2015 to 23% in 2017.
Meanwhile, Figure 37 below gives us an overview of
UN expenditure on operational activities categorised by
low-, middle- and high-income countries.⁸ The UN’s
expenditure is concentrated in low-income countries,
and 48% of the total country-level expenditure in 2017
took place in this category. Expenditure in the group of
50 countries dened as crisis-aected was in total 76%
of the total country-level operational expenditures the
same year. Crisis-aected countries are countries in the
OECD-DAC list of ODA that fulll one or more of the
following criteria:
a) report expenditure for an ongoing or recently
discontinued peacekeeping mission;
b) report expenditure for an ongoing or recently
discontinued political mission, group of experts,
panel, oce of special envoy or special adviser;
c) report expenditure from the Peacebuilding Fund
higher than US$ 500,000; and/or
d) have had a humanitarian response plan for the
two past years, ie 2016 and 2017.
As the list of countries in each category diers from year
to year a historical comparison is dicult. However, as in
previous years, all the categories of countries in Figure 37
have one thing in common: they are all reliant on ear-
marked funding, especially crisis-aected countries.
Figure 38 on the next page shows UN expenditure at
the country-level in crisis-aected countries. Multiple
datasets have been combined to analyse where (which
countries) and on what (humanitarian, development
and peace operations) expenditures are made. Only the
crisis-aected countries with expenditures over US$ 100
million are depicted in the gure.
The gure shows that South Sudan, Democratic Republic
of the Congo, Lebanon, Somalia and Sudan are the top
ve in terms of UN funding for crisis-aected countries;
together they constituted US$ 9.7 billion in expenditures
or 19% of the total UN system-wide expenditure in
2017. The rst ten represented 31% of UN’s total
expenditure – illustrating the concentration of the
UN’s work.
The placement of some countries in this ranking has
changed rapidly over the past few years due to escalating
humanitarian crisis or the ending of peacekeeping mis-
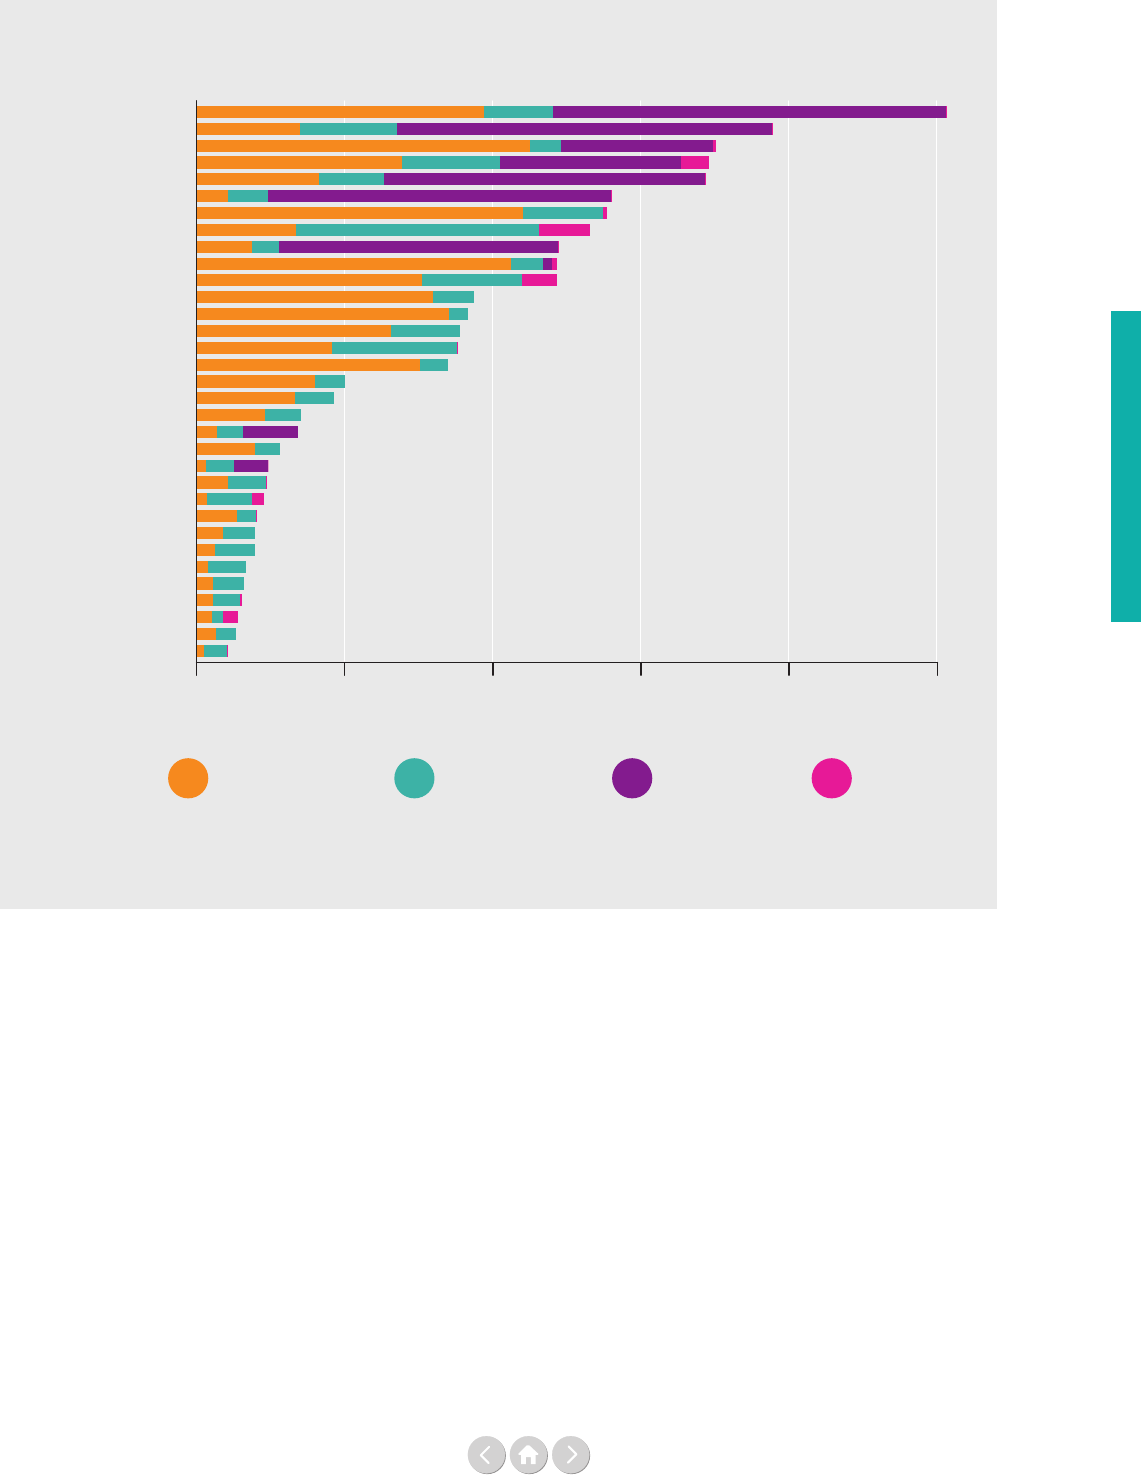
57
Figure 38: UN operational and peace related expenditure in crisis-affected countries, 2017
Source: Report of the Secretary General (A/74/73 – E/2019/4); UN Pooled Funds Database; General Assembly nancial report
A/73/5 (Vol II), 2019; and General Assembly Programme Budget for the Biennium 2018-2019, 2019.
For notes – see page 184.
US$ billion
South Sudan
Dem. Rep. of the Congo
Lebanon
Somalia
Sudan
Mali
Yemen
Afghanistan
Central African Rep.
Syrian Arab Rep.
Iraq
State of Palestine
Jordan
Ethiopia
Nigeria
Turkey
Uganda
Kenya
Chad
Haiti
Niger
Liberia
Myanmar
Colombia
Cameroon
Egypt
Ukraine
Sierra Leone
Senegal
Burundi
Libya
Madagascar
Côte d’Ivoire
0 0.5 1.0 1.5 2.0 2.5
Peace DPAPeace DPKODevelopment
Humanitarian
sions. One example is Yemen, which saw a rapid
increase in overall UN expenditures, from US$ 0.5
billion in 2015 to US$ 1.4 billion in 2017, with most
of the growth in expenditures being for humanitarian
purposes even though development-related expendi-
tures also doubled. As a result, Yemen moved up in this
overview from 17
th
place in 2015 to 7
th
place in 2017.
In the same period, the humanitarian expenditures in
Nigeria grew from 6% of total expenditures in 2015 to
52% two years later, while the overall UN expenditures
almost doubled. A third example is Côte d’Ivoire, whose
expenditures on operational activities stayed constant in
the 2015 to 2017 period, while the closure of the UN
peacekeeping mission in Côte d’Ivoire resulted in an
overall drop of the UN expenditures by about US$ 0.5
billion. The country, which had been in 16
th
place in
2015, moved down to 33
rd
place two years later.
Overall, for the group of 50 crisis-aected countries,
24% of the expenditure is dedicated to development
assistance; 27% is dedicated to peace and security-
related activities; while 49% is dedicated to humanitarian
activities.
Expenditure

58
Moving ahead on data quality
PART ONE
Chapter Three
Introduction
The UN system-wide nancial data is far from perfect.
That is why we introduced a chapter on ‘exploring data
quality’ in the 2018 edition of this report, describing the
key data quality issues facing the UN. This year’s
analysis goes a step further and outlines the current
challenges regarding the denitions and the 2017 nan-
cial data used in the report, as well as the major progress
made in the last 12 months in moving the UN onto a
path to better, cleaner data, enabling improved support
for analysis and decision-making.
9
We will look at the
actions taken towards improving the comprehensiveness,
consistency and comparability of the UN system-wide
data, and outline what more is being planned to improve
data governance and quality of UN system-wide nan-
cial data.
This chapter will also shed more light on some of the
data analysis issues that we have run into, again this year,
as we try to provide some interesting insights into the
nancing of the United Nations development system.
Most of the issues are linked to the limitations of the
two existing UN system-wide datasets used as our main
data sources for Chapters One and Two.
The data comes from the annual nancial statistics pro-
duced by the Chief Executives Board for Coordination,
based on the nancial data submissions received from
UN organisations (the CEB data)
10
and the statistical
annex produced by the United Nations Department of
Economic and Social Aairs for the annual Report of
the Secretary-General on the Implementation of the
Quadrennial Comprehensive Policy Review (the UN-
DESA data).
11
Though these two parts of the UN system work closely
together, they did not – up until recently – share a com-
mon system of data governance or a shared set of deni-
tions. This means that the 2017 data, used for this report
and largely collected in May 2018, has systemic aws:
dierent denitions, no common rules for aggregating
and analysing data, and hence dierent conclusions
depending on which set of data is used in the analysis.
Key issues with the 2017 data
1. Who is part of the UN system?
The rst issue with the 2017 nancial data, and the data-
sets used by CEB and UNDESA, is one of comprehen-
siveness. Without an agreed denition of the UN entities
that together constitute ‘the UN system’ to underpin
data collection, the two datasets reect dierent choices
of which organisations should be considered part of
the UN system. The CEB dataset includes the 40 UN
entities that responded to the 2017 CEB nancial data
collection exercise, with six new UN entities included
for the rst time in the list
12
(and hence in the tables in
Chapters One and Two of Part One). The UNDESA
dataset uses dierent denitions as to which organisa-
tions to include. For example, three related organisations
that together reported a total 2017 revenue of US$ 2.5
billion to the CEB, are not counted as being part of the
UN system, namely the International Atomic Energy
Agency, the International Organization for Migration
and the World Trade Organization (WTO). The overall
expenditure gures for the UN dier from US$ 51.6
billion (CEB data) to US$ 48.1 billion (UNDESA data).
2. Who is part of the UN development system?
The best-known denition for the UNDS is the one
used by UNDESA. For the most recent funding analysis
included in the Report of the Secretary-General
13
, the
UNDS is dened as: ‘UN entities that receive funding
for operational activities for development and are eligible
for Ocial Development Assistance (ODA)’. Since the
three organisations mentioned above are not counted by
UNDESA as being part of the UN system, they are also
not considered part of the UNDS, even though
contributions to the IAEA, IOM and WTO are
(partially) eligible for ODA.

59
Moving ahead on data quality
3. What does the UN spend on normative activities?
The entities reporting to the CEB have, in some cases,
tended to treat ‘normative’ as a residual category,
under which all activities that do not t elsewhere can
be classied. The result of this is not-so-relevant to rather
useless data, especially if this were to be the only basis
for UN strategic decision-making. For example, the
UNDESA data shows a halving of the UN’s normative
expenditures between 2015 and 2017 (from 20% of the
total expenditures in 2015 to 10% in 2017). Over the
same period, the CEB gures show only a two percent-
age point decline in the share of normative expenditures
(from 17% of the total expenditures in 2015 to 15%
in 2017, with the actual US$ amount decreasing only
by 7%).
4. What does the UN spend on development
and humanitarian assistance?
The major problem with comparability and consistency
of the CEB and UNDESA datasets is most evident when
data users compare the 2017 data for humanitarian and
development expenditures quoted by these two sources.
For 2017, the UNDESA data presents the UNDS
development expenditure as US$ 18.7 billion and
humanitarian expenditure as US$ 15.6 billion. Mean-
while, the CEB data shows a reverse picture with the
total UN development expenditure at US$ 13.4 billion
and the humanitarian expenditure at US$ 17.5 billion.
As already mentioned in our analysis from last year, there
are several reasons why these two key UN data sources
come up with such dierent results for 2017. First, as
noted above, CEB and UNDESA have dierent
denitions for which entities are part of the UN system.
Second, CEB and UNDESA do not use the same
denitions for humanitarian and development. The CEB
data reects what UN entities themselves classied as
development and humanitarian expenditures in their
reporting, while UNDESA uses a denition that makes
a direct link to the OECD-DAC denition of ODA.
Third, in the absence of more granular data, UNDESA
classies most UN operational entities as either ‘develop-
ment’ or ‘humanitarian’ for data analysis purposes, even
though an increasing number of UN entities are active
in both domains.
5. Where does the UN spend its resources?
A fair number of UN entities, including the UN
Secretariat, did not provide a breakdown of their 2017
humanitarian and development expenditures by country
in their data submissions to the CEB. As a result, the UN
expenditure at the headquarters and the regional level
are overstated, while the country-level expenditure are
understated. This also means that any of the country-
related graphs included in Chapter Two will system-
atically underestimate how much the UN spends at
the country level, notably on development assistance
activities.
6. Why/for what results does the UN spend money?
Neither the CEB nor the UNDESA dataset provide any
insights into the Sustainable Development Goals (SDG)
or targets, or even the more traditional sectoral
allocations (such as the OECD-DAC sector codes) of
the UN’s development and humanitarian expenditures.
An SDG dimension has been introduced in the CEB’s
2019 data collection process (for 2018 data).
7. Who decides which nancial numbers are ‘the right ones’?
In the absence of a UN system-wide data governance
mechanism, the UN lacks an institutional anchor to
agree on denitions for all UN system-wide nancial
reporting and thereby reduce the risk that dierent parts
of the UN system publish divergent numbers.

60
Moving ahead on data quality
What progress has there been so far on
improving the quality of financial data?
The UN has woken up to the importance of having
good quality system-wide nancial data that is clean,
consistent, comprehensive and current. First, there was
the clear request by Member States for ‘the publication
of timely, reliable, veriable and comparable system-wide
and entity-level data, denitions and classications’,
aligned to the SDGs.
14
Second, UN managers realise that
they also need quality data for eective, evidence-based
decision making, for communicating about the UN’s
activities and evaluating its results. Moreover, better data
will also give UN senior leaders a cross-pillar view on
UN system funding and enable them to meet the Fund-
ing Compact commitments on transparency of nancial
data and reporting against the SDGs.
As part of an emerging ‘nancial data strategy’, the UN
has made major eorts over the past two years to
improve its nancial data through the Data Cube
Initiative, which was jointly led by the CEB’s High
Level Committee on Management and the United
Nations Sustainable Development Group. The main
result was the adoption of a set of data standards for UN
system-wide nancial reporting in the fourth quarter
of 2018. These new data standards cover six dierent
dimensions:
1) The UN Entity Standard denes the
organisations that make up the UN system
(the ‘Who’ dimension).
2) The UN Function Standard provides revised
denitions for the four functions in which the
UN is involved, ie development, humanitarian,
peace operations, and global agenda and
specialised assistance (the ‘What’ dimension).
3) The Geographical Location Standard denes
codes for the global level, regions and countries,
and provides guidance for the allocation
of expenses to these locations
(the ‘Where’ dimension).
4) The UN Grant Financing Instruments Standard
provides denitions for the various grant
modalities through which funds are received by
UN system entities (the ‘How’ dimension).
5) The Sustainable Development Goals Standard
introduces a common UN methodology for
tracking the contribution of UN activities to
the 2030 Agenda for Sustainable Development
and denes how UN nancial information should
be reported against the 17 SDGs and the 169
SDG targets (the ‘Why’ dimension).
6) The Contributor Standard provides coding and
guidance on reporting revenue by contributor
(the ‘Contributor’ dimension).
Secondly, a roadmap for implementing the data standards
was developed. This roadmap has been characterised as
a ‘living document’ that will continue to evolve as new
actions are identied that should make the implemen-
tation of the data standards a full reality. Some elements
of the roadmap have already been implemented, while
others are ongoing or planned for later in 2019. As part
of the roadmap:
• The six data standards have been integrated into
the requirements for the 2018 CEB nancial
statistics exercise, resulting in major adjustments
in the CEB templates used for the data collection
taking place in 2019. Moreover, UN entities have
received face-to-face training and detailed
guidance on how to report against these data
standards.
• The idea of a minimum nancial dataset has been
developed that could build on the UN data
standards and ensure harmonised UN reporting
to the International Aid Transparency Initiative
(IATI), while being appropriate as well for reporting
to the OECD (see box on TOSSD on page 61 as
well as Figure 41 on page 63).
• The questions and answers, and guidance sections
of the data standards are continuously being
updated, with further guidance planned on a
variety of topics including double counting
(see the box on page 62) and the allocation of
operating costs across the four functions.
The deliverables of the Data Cube Initiative have also
informed a number of UN commitments around
transparency and accountability in the Funding Compact
(detailed in Part One, Chapter One). This includes
specic commitments on reporting expenditures
disaggregated by SDG and by country. The introduction
of the data standards is also expected to have a positive
impact on the access to quality nancial data at the
headquarters level, through an online data platform, and
at the country level through UN Info, a country-level
tool that the UN can use to report to host governments.
The link between the UN data standards, the broader
nancial dataset and the related commitments in the
Funding Compact are graphically depicted in Figure 41.
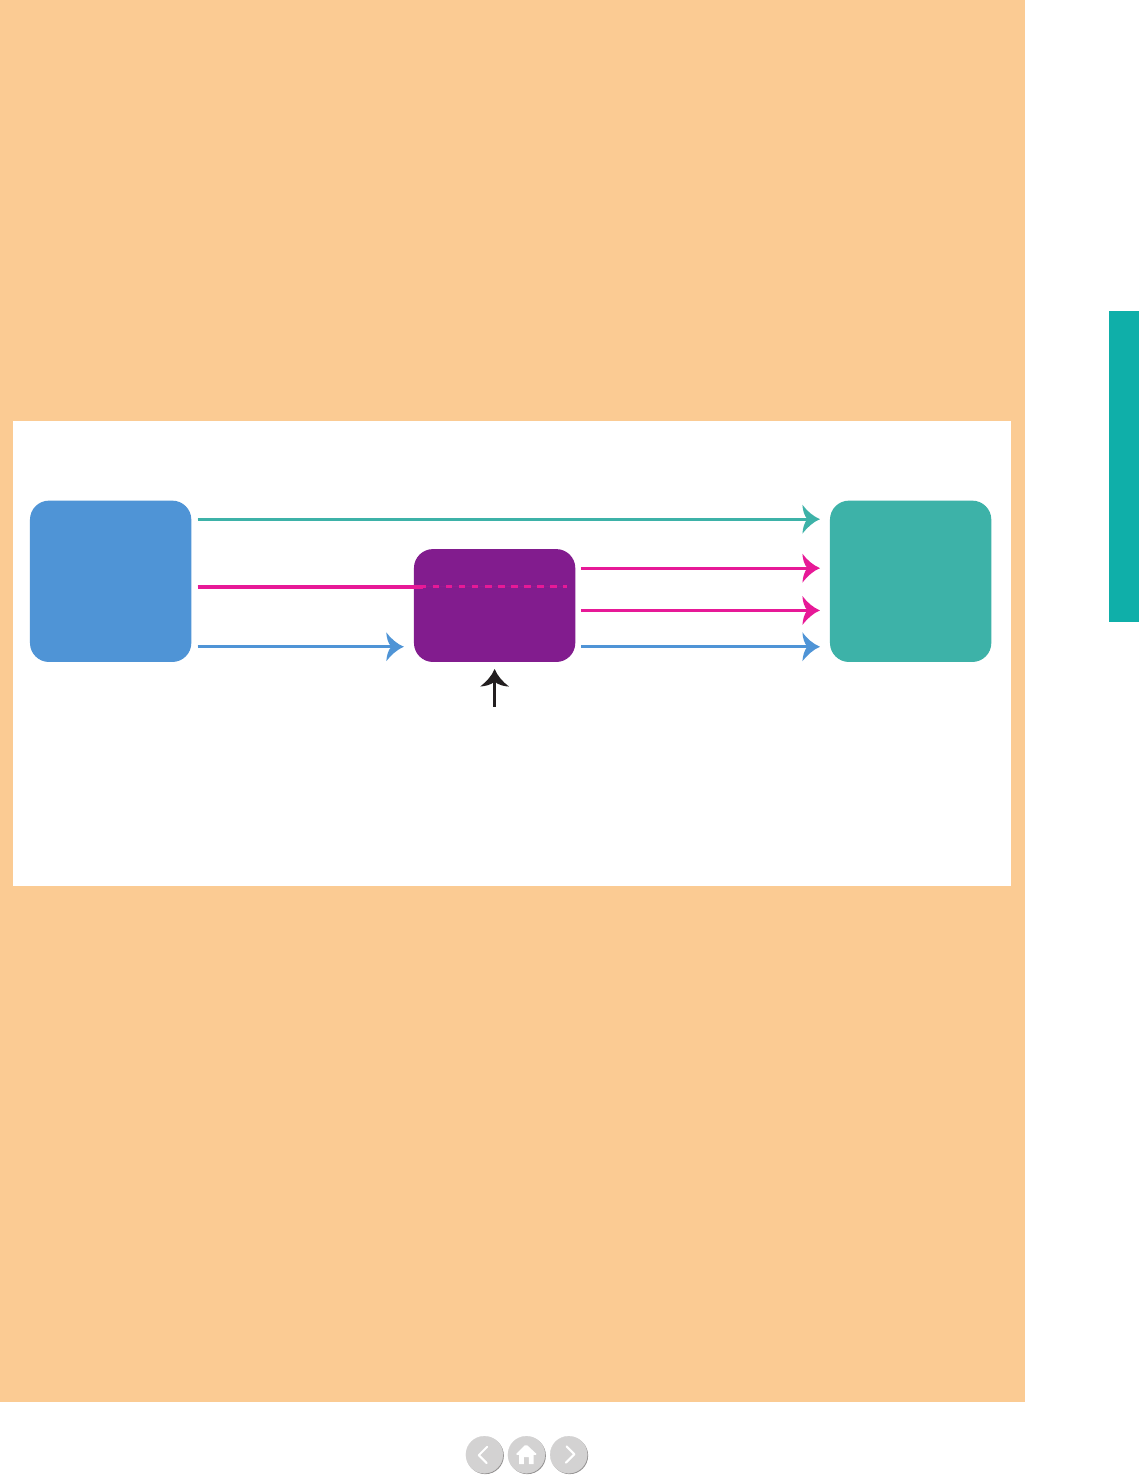
61
The current Official Development Assistance (ODA) statis-
tical system measures the efforts of countries in providing
development cooperation. As such, the ODA data includes
both contributions to the multilateral system (core or
non-earmarked funds) and through the multilateral organi-
sations (activities implemented by them with earmarked
funds). Multilateral organisations receiving ODA are
encouraged to report to the OECD on the use of the core
funds they receive from provider countries. Currently, 42
international institutions, including 17 UN entities, do so.
This reporting by UN entities is essential for establishing a
complete picture of the ODA channelled through the multi-
lateral system to ODA-eligible, recipient countries.
Towards better tracking of the UN’s contribution to the implementation of the 2030 Agenda:
The Total Official Support for Sustainable Development (TOSSD) framework
The new statistical framework of TOSSD
15
, for which the
OECD hosts the interim secretariat, will include a broader
spectrum of activities of multilateral institutions that
promote sustainable development in developing countries,
support development enablers and address challenges at the
regional and global levels. It will include all types of finance
in support of the SDGs, whatever the instrument used
or the level of concessionality. In comparison to the ODA
system, it will record the activities (outflows) of multilat-
eral institutions funded by both core and earmarked funds,
rather than just the funds provided (inflows) to them (see
Figure 39 below).
Figure 39: Simplified representation of flows reported by multilateral institutions
in ODA and TOSSD
PROVIDER
COUNTRY
MULTILATERAL
AGENCY
Funds raised from
private sources
(A) Bilateral flows
(D) Provider-based allocation
(E) Agency-based allocation
(F) Multilateral flows
(B) Earmarked contributions
(C) Core contributions
PARTNER
COUNTRY
Note: in the ODA system, bilateral provider countries report (A), (B) and (C) and multilateral institutions report (F).
In the TOSSD System, the focus is on multilateral outows, ie multilateral institutions will report on (D), (E) and (F),
which will provide greater visibility on their activities. In the TOSSD system, bilateral provider countries will only report on (A).
TOSSD can thus measure the UN’s contribution to sustain-
able development in a more comprehensive manner, and
thereby help to fill key information gaps on resources
supporting the implementation of the 2030 Agenda. For
example, TOSSD will provide additional information on
the normative or standard setting activities of multilateral
institutions in support of sustainable development. These
activities are currently not fully captured in ODA statistics,
as they do not completely comply with the ODA definition,
even though this information is relevant in the context of
the 2030 Agenda. UN specialised agencies, such as the ILO
and the WHO, conduct normative work at the headquarters
level, while their current reporting to the OECD only relates
to activities conducted directly with or benefiting ODA-eli-
gible countries. Another example is the UN Convention on
Biological Diversity, which has core funding that is cur-
rently not ODA-eligible, but which has a prominent role in
supporting the implementation of SDG 15. TOSSD will also
include more comprehensive information on multilateral
organisations’ activities funded from flexibly earmarked re-
sources. For example, while current OECD statistics include
contributions to UN pooled funds, they do not cover out-
flows from these pooled funds and therefore do not reflect
the actual use of money by country or sector.
With TOSSD, activities carried out by, for example, the
Peacebuilding Fund or the Central Emergency Response
Fund can be captured and will thus be much more visible.
The 2030 Agenda for Sustainable Development marks a
shift to a universal agenda with far-reaching aspirational
goals. With TOSSD, the international community, including
developing countries, traditional donors, South-South and
emerging providers and multilateral institutions, are work-
ing together to promote better standards for monitoring
resource flows in support of the 2030 Agenda. The develop-
ment of the TOSSD framework and the current efforts by
the UN to implement data standards for UN system-wide
reporting of financial data can complement each other to
improve transparency and data quality on development
finance. While reporting by all relevant UN entities in
the current ODA statistical system remains desirable, the
TOSSD framework could provide a possibly less burden-
some opportunity for UN organisations to report on their
contributions to the 2030 Agenda. UN organisations would
only report once for TOSSD and ODA, and would no longer
have to filter out their expenditures funded through non-
core resources before reporting, as is currently the case in
the ODA system.
Moving ahead on data quality
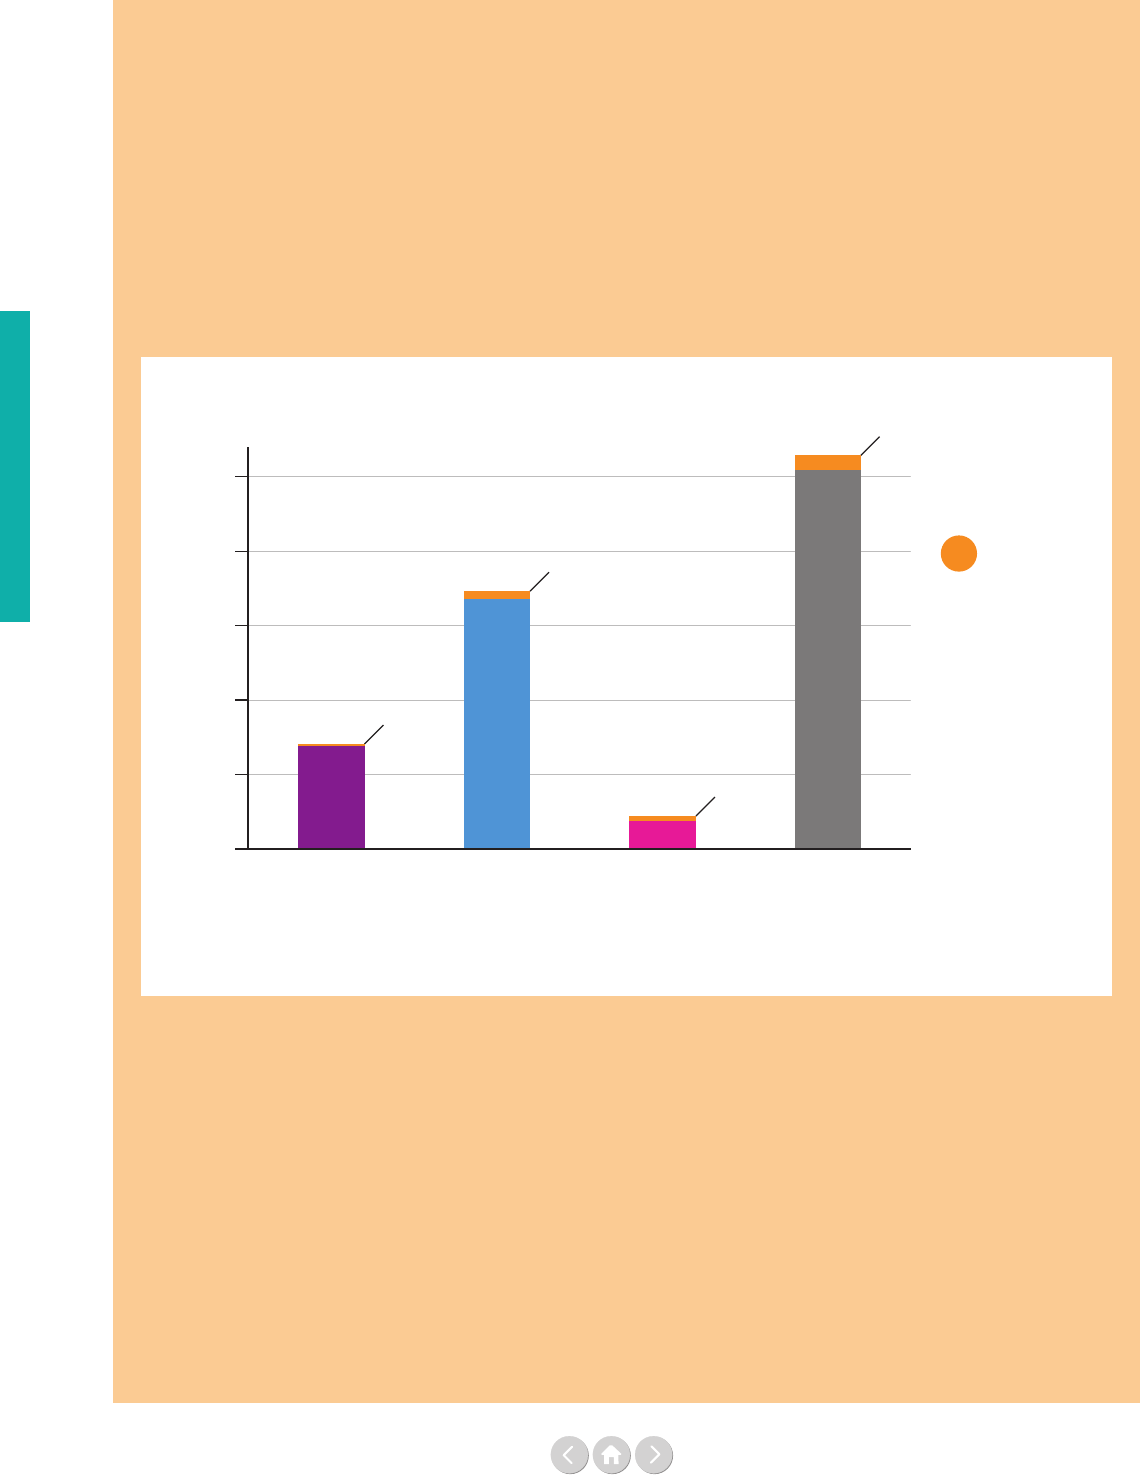
62
PART TWO
In 2017 and 2018 important steps were taken to enhance
the quality of the UN system consolidated financial data.
In addition to aligning data standards across all UN system
entities, efforts were made to understand, quantify and
consequently reduce ‘double counting’. In 2019, as part of
the implementation of the roadmap for the data standards,
the CEB is expecting to finalise guidance on this very topic
in order to eliminate, to the extent possible, double-count-
ing of revenues and expenses in its UN system-wide
financial reporting.
Double counting
‘Double counting’ explained
One speaks of ‘double counting’ whenever the same
financial flows (revenues or expenses) are reported by
two UN entities to the CEB. For instance, a donor country
may provide voluntary resources to a UN entity, which
then transfers funds to another UN entity, eg to implement
part of a project or as a payment for services. Typically,
this revenue and associated expenses will be reflected in
the audited financial statements of both UN entities, as it
should be. However, if both UN entities report this flow to
the CEB, the total UN system-wide revenue (or expense) is
partly overstated.
Figure 40 provides an overview of the estimated level of
double counting per major UN revenue stream, combining
voluntary core and earmarked into one. In 2017, entities
received US$ 136 million out of US$ 14.0 billion in total
‘assessed’ funding through the Secretariat, which
classifies as double counting. In ‘voluntary’ contributions,
about 3% double counting is expected (US$ 1.1 billion out of
US$ 34.8 billion). This consists of an estimated US$ 500
million in contributions to UN pooled funds, since not all
fund administrators have excluded these flows from their
CEB reporting; and US$ 627 million voluntary revenues
which entities label as originating from a UN internal
source, for instance, through UN-to-UN transfers for im-
plementation support, management fees or procurement
services.
Additionally, some entities used the ‘other’ revenue
category to reflect such UN internal flows in 2017. Although
less detail was collected by the CEB in this category, double
counting was found to be at least US$ 250 million, but no
more than US$ 750 million, after studying the majority of
individual financial statements. In summary, out of the
US$ 53.2 billion in total UN system 2017 revenue,
approximately US$ 1.5 to 2.0 billion (which is less than 4%)
should be excluded in consolidation.
Conclusion
Double counting poses a challenge for high-quality UN
system-wide consolidated financial reporting. Although
not to be trivialised, we estimate potential double counting
to be less than 4% of the 2017 total revenue. With clear
guidance on double counting under preparation, the CEB
should be able to improve the quality of consolidated data
even further in the near future, so that the consolidated
numbers used for UN system total revenue (and expense)
exclude double counting.
Figure 40: Estimates of double counting in the UN system's total 2017 revenue
Source: Chief Executives Board for Coordination (CEB); UN Pooled Funds Database;
2017 Audited Financial Statements for DPKO, IOM, PAHO, UN, UNDP, UNESCO, UNFPA,
UNICEF, UNOPS, UNRWA, UNU, WFP, WHO and WIPO
For notes – see page 185.
Potential
double counting
US$ billion
0
10
20
30
40
50
13.8
33.7
3.68
51.2
14.0
34.8
4.4
53.2
Assessed Voluntary core
and earmarked
Fees and
other revenues
Total
1%
3%
<17%
<4%
Moving ahead on data quality
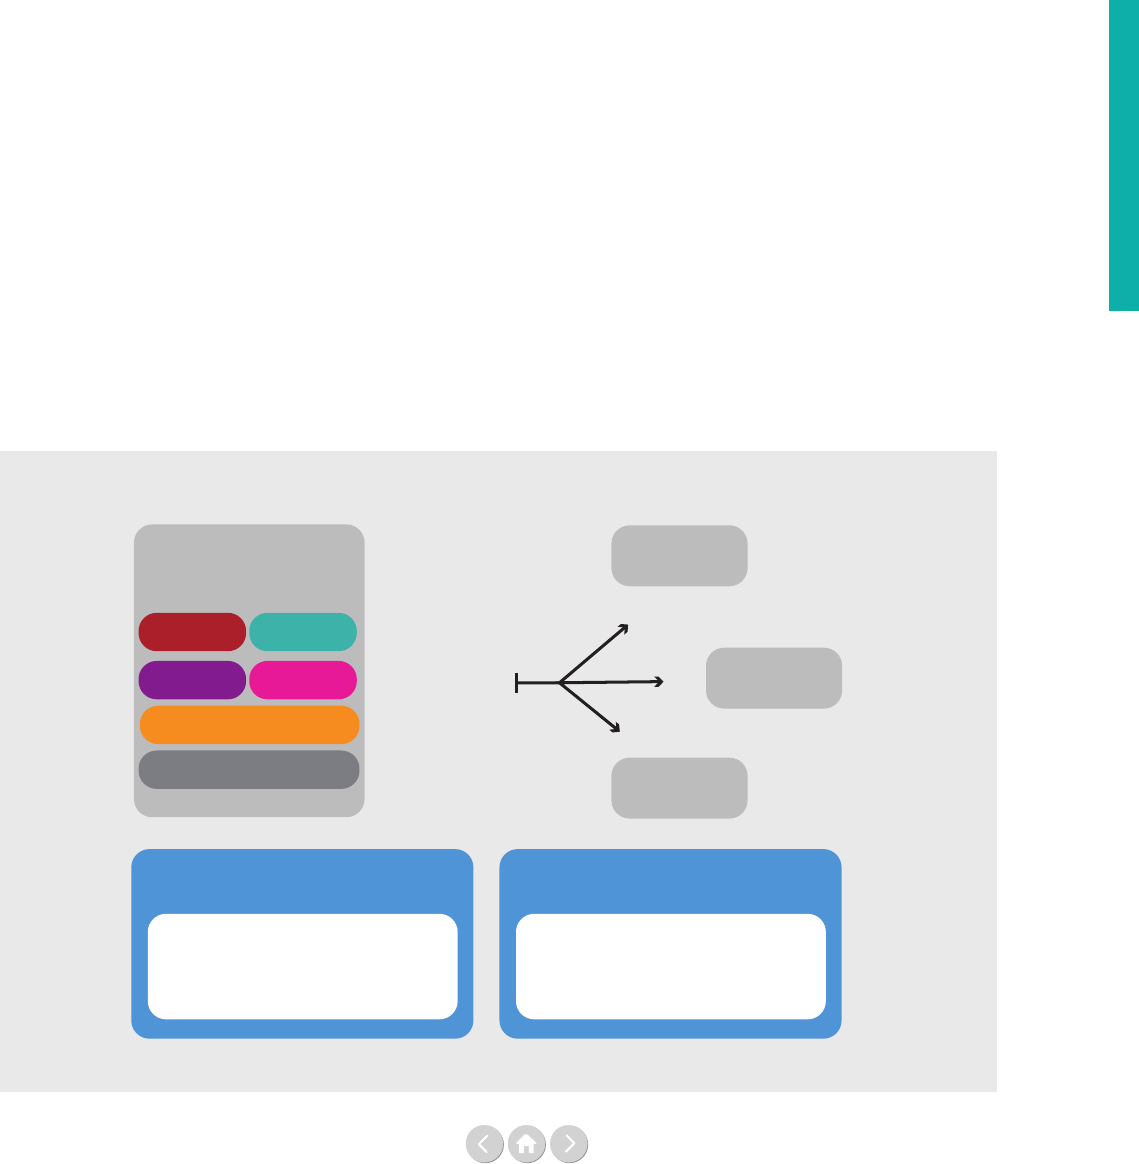
63
What else needs to be achieved?
The introduction of data standards is not the end, but
rather the beginning of a longer process of improving
the UN’s system-wide nancial data. Much more will
need to be done, including:
• Adjusting Enterprise Resource Planning (ERP)
systems: UN entities need to do the hard work
of integrating the UN data standards into their
ERP standards. For some of them this will require
major investments, notably to be able to
automatically generate the data on the geographic
location and SDG linkage, which are the two data
standards that do not become mandatory for
reporting until 1 January 2022.
• Disaggregated data: The data standards enable UN
organisations to work towards having one
common minimum nancial dataset for disaggre-
gated data, ie nancial data below the level of the
nancial statements. This minimum dataset could
then be used not only for reporting to the CEB,
but also for publishing to IATI, and the OECD
(see box on TOSSD on page 61 and Figure 41
below). This should ease the reporting burden for
all organisations and ultimately enable the UN to
have one ‘data cube’ with disaggregated data across
multiple dimensions.
Figure 41: UN Data Standards and the Funding Compact
Source: Multi-Partner Trust Fund Oce (MPTFO)
UN minimum dataset that
builds on UN data standards
is used by each UN entity
Who What
to report to
Where How
Why SDG targets
Revenue by contributor
UN CEB
IATI
OECD
Meeting funding compact
reporting commitments (2021)
- CEB reporting = 100%
- IATI reporting = 100%
- Where = 100%
- Why = 100%
- Better financial data for UN Info
... and paving way for the funding
compact commitment (2020):
A centralised, consolidated and
user-friendly online platform with
disaggregated data on funding flows at
entity and system-wide level in place.
• Linking the headquarters and country-level data: The
planned common minimum nancial dataset with
disaggregated data at the headquarters level will
need to be linked to nancial data required at the
country level, notably key data captured in UN Info.
• Measuring normative: With the redenition of
the UN functions, there is no longer a system-
wide denition that seems to ‘measure’ the UN’s
investment in normative work. Alternative ways
for calculating the UN’s normative expenditure
need to be conceptualised and implemented.
• Bridging the CEB – UNDESA data dierences:
The data standards should ideally ensure that
the CEB and UNDESA have a joined-up dataset
that underpins their reporting. However, it remains
to be seen how UNDESA integrates the new data
standards in next year’s report on the implemen-
tation of the Quadrennial Comprehensive Policy
Review (QCPR). If it uses the data standards in
exactly the same way as the CEB, then the major
gaps between their two datasets in terms of ‘who is
part of the UN system?’ should be an issue of the
past. Depending on how ‘the UN development
system’ is dened for the 2018 UNDESA dataset,
the dierences in CEB and UNDESA reporting on
‘development assistance’ and ‘humanitarian assistance’
could also be substantially reduced.
Moving ahead on data quality

64
Moving ahead on data quality
• Continuity in data analysis: Part One of next
year’s Financing the UN development system
report will be based on the new set of CEB and
UNDESA data that may be dierent from what
has been used in the 2010-2017 period, and may
not be 100% comparable.
How is the UN steering this process forward?
The UN is working on institutionalising the Data Cube
Initiative – that formally ended in December 2018 –
through the following three elements:
1) A data strategy: A multi-year strategy is being
developed to achieve quality UN system-wide
nancial data that is comprehensive, timely and
disaggregated. This strategy will take into
account the various ongoing initiatives,
including the roadmap for the implementation of
the data standards. It should also ensure that the
UN can meet the key data-related commitments
of the Funding Compact, including for reporting
to CEB and IATI, and the minimum nancial
data requirements of UN Info and the OECD.
Importantly, it should also help reduce the
reporting burden for individual UN entities.
2) A data governance mechanism: This is bringing
together the representatives of key UN data
actors (data users, data producers and data
consolidators) who will contribute to the design
and oversee the implementation of the data
strategy. They can also launch joint data-related
activities where relevant and, in case additional
resources are available, help to prioritise funding
needs.
3) A multi-partner pooled nancing mechanism for
system-wide data: This would consolidate
exible, earmarked funding in one pool, to be
allocated to data improvement initiatives in line
with the data strategy.


66
Part Two of this report is organised into four chapters in
which guest contributors discuss some of the key chal-
lenges facing development nance today.
In Chapter One, contributors were invited to take a big
picture view on development nance against the back-
drop of the 2030 Agenda.
Homi Kharas provides an overview of the state of
cross-border nancing of the Sustainable Development
Goals (SDGs), dened as the nancing ows to develop-
ing countries that likely nance SDG investments. He
sees a signicant increase, largely due to private ows,
and notes that, broadly speaking, current conditions
provide a favourable context for developing emerging
market economies to borrow internationally. He warns
of the dangers of a funding pile up as a number of large
agencies will be competing for funds in their replenish-
ment cycles, coming up for negotiation over the next
18 months. This could make it harder to increase core
funding for a number of multilateral agencies already
under nancial pressure. His concluding analysis looks at
the net impact of nancial inows and outows together
and notes that the International Monetary Fund’s (IMF)
most recent forecast for net ows to developing coun-
tries in 2019 is actually zero.
The contribution from Fiona Bayat-Renoux is next, and
outlines the Secretary-General’s strategy for nancing
the 2030 Agenda. She sees a mixed picture, but stresses
that the resources and capacity available today could
close the investment gap. She notes that the UN has a
long history of supporting Member States on nancing
for development. The Secretary-General’s strategy
focuses on three objectives: aligning global nancial
and economic policies with the 2030 Agenda;
enhancing sustainable nancing strategies and invest-
ments at regional and country levels; and seizing the
potential of nancial innovation, new technologies and
digitalisation to provide equitable access to nance.
Navid Hanif and Philipp Erfurth focus on the need to
change the narrative from identifying investment gaps to
promoting investment opportunities, seeing investment
in sustainable development as an exercise in matching in-
vestments with investors. They argue that there is a need
to change mindsets and perceptions both on the supply
and the demand sides. Like other contributors, they
emphasise the need to deepen dialogue with institutional
investors who have a major contribution to make. They
also remind us that investment takes place at the national
level and that requires an enabling domestic environ-
ment. Developing national nancing strategies is another
key component. The implication of this new narrative is
that the role of the UN moving forward should be inter-
preted as a match maker and knowledge broker rather
than as a gap ller.
For Ambassador E. Courtenay Rattray, achieving the
objectives of the 2030 Agenda and the targets of the
Paris climate agreement requires a massive, global pro-
gramme of investment in real assets and sustainable infra-
structure. Beyond establishing new partnerships between
the public and private sectors, he stresses the critical
engagement needed by institutional investors.
He is committed to creating a mechanism that will bring
together buyers and sellers, a theme we have encoun-
tered in previous papers. He wants to see Member States
taking concrete action and in this regard he describes the
launch of the Closing the Investment Gap initiative
(the CIG initiative). His paper provides details on the
process underlying the implementation of the CIG.
John W. McArthur takes us back to the country level in his
paper entitled ‘Bye-bye, billion to trillions’. He argues that
if normal trends of global economic growth continue
Overview of Part Two
PART TWO

67
until 2030, SDG government spending will grow by
US$ 10 trillion per year, which more than covers the
necessary incremental investment cited in the SDG con-
text. Bearing this in mind he argues that the focus needs
to shift from volume to purpose and distribution. He
warns against discussing nancing needs at the aggregate
level and he highlights the need to be more specic,
with a focus on country level needs. He particularly
emphasises the need to dierentiate and analyse needs in
the poorest countries.
‘How does science and technology policy shape in-
equality?’… so begins the title of Pedro Conceição's
exploration into the relevance of science, technology and
innovation policy to the 2030 Agenda and how they will
shape inequality. Far from neutral, they may emerge as
one of the most consequential policy areas for inequality
because of the impacts of the incentives that exist to
foster innovation. This leads to the proposition that
science and technology policy need to nd the right
balance between public support on the one hand and
incentives for private investments in innovation. The key
idea here is that this area has little to do with mobilising
resources as such and more to do with the incentives
that shape creativity and innovation to advance science
and technology in a way that generates widely shared
benets. John W. McArthur’s tale of ‘Bye-bye, billions to
trillions’ and Pedro Conceição’s ‘How does science and
technology policy shape inequality?’ provide a tting
ending to this rst chapter on the big picture.
Chapter Two features a number of contributions that
explore approaches that seek to go beyond the core vs
non-core conundrum.
The rst paper in this section by the UN Multi-Partner
Trust Fund Oce (MPTFO) provides an overview of
UN pooled funding. The paper discusses some of the
advantages that pooled funding has to oer. These in-
clude improved aid coordination and coherence, better
risk management and providing a broader contributor
base for funding the UN system. It is in this context that
pooled funding has emerged as an important component
in UN reform initiatives and features prominently in the
Secretary-General’s Funding Compact. The paper makes
a persuasive case that pooled funding can provide quality
funding and oers opportunities that might otherwise
not be available to the UN system.
This is followed by a paper by Max-Otto Baumann, Erik
Lundsgaarde and Silke Weinlich that explores in detail
some of the advantages and disadvantages of non-core
funding. Calling for more attention to the best mix of
funding, which allows UN organisations to play to their
strengths, the paper looks at both the consequences of
earmarking on the United Nations development system
(UNDS) as well as some of the challenges presented by
donor earmarking practices. The paper sees the Funding
Compact as providing a much needed systemic approach
that brings together both UN agencies and Member
States behind their respective common obligations.
A paper by Brian Elliott and Maximilian Sandbaek pro-
vides an overview of the World Health Organization’s
(WHO) approach to strengthening its resource mobili-
sation eorts as part of its new ve year strategic plan. It
links WHO’s resource strategy with a range of initiatives,
for example WHO’s rst ever investment case, the formu-
lation of a draft Global Action Plan and the development
of a global draft resource mobilisation and partner-
ship strategy. Overall, the paper stresses the overriding
importance of the quality of funding and in this respect
attaches specic importance to the launch of the WHO’s
inaugural Partners Forum in Sweden in April 2019.
Guido Schmidt-Traub shares lessons learned from setting
up the Global Fund to ght AIDS, Tuberculosis and
Malaria, which was launched in January 2003. His paper
argues that success was largely due to the unique design
principles of the Global Fund. Initial concerns about
how the new Fund would work were warranted since
no resource poor country had undertaken the needed
scaling up of public health interventions. For Schmidt-
Traub, creating quality demand and ensuring eective
use of resources were the greatest challenges in the
health community. The paper details the specic features
integrated into the Fund’s design that were critical to its
success and argues that these features have applicability
and should be of great interest to sector nancing mech-
anisms as a whole.
The paper by Silke Weinlich and Bruce Jenks explores
the implications of the UNDS reform process on the
growth of system-wide funding mechanisms. It argues
that the Secretary-General’s UNDS reform proposals
and the Funding Compact have put system level fund-
ing back on the table as a fundamental component of a
reform agenda. The paper identies ve approaches to
system-wide funding that merit close attention: pooled
funding, funding the revised United Nations Develop-
ment Assistance Framework (UNDAF), fees for
managing globalisation, nancing fulcrums and levers
and resources for institutional strengthening within the
UNDS. It then details the dierent instruments that
comprise the Secretary-General’s Funding Compact.
It identies the establishment of the Joint Fund for
the 2030 Agenda and the levy as instruments that over
the long time may have signicant impact for creating
incentives promoting reform and for the overall sustain-
ability of the nancial architecture of the system.
Part Two: Introduction

68
Chapter Three explores ongoing eorts and innovative
approaches to strengthen nancing for peacebuilding,
sustaining peace, humanitarian assistance and migration
in times of greater needs.
In the rst piece, the Dag Hammarskjöld Foundation,
argues that beyond additional resources for peacebuild-
ing, a radical rethink is needed on how nancing is
structured and how to leverage strong partnerships for
more eective resourcing. The paper outlines ten points
to help frame the issues that require attention and action
by the UN and its Member States in order to allow for
more ecient use of existing funds and to ensure that
sucient resources are available to full the commitment
of sustaining peace over the coming decades.
Franck Bousquet, the World Bank’s Senior Director for
Fragility, Conict & Violence (FCV), highlights the
success of the World Bank’s International Development
Association (IDA18) in addressing fragility, conict and
violence. He explains that the scale-up in IDA18 from
US$ 7 billion to US$ 14 billion for low-income coun-
tries impacted by FCV has proven critical and has helped
the World Bank adapt a more tailored response to diverse
situations of fragility. Laying out concrete examples of
the World Bank’s work in countries like Ethiopia and
Yemen, he goes on to say that IDA 19 will need to put
greater focus on and investment in emerging issues
– such as regional fragility, human capital decits or
gender challenges.
The third piece by Catherine Howell and Henk-Jan
Brinkman explores innovative nancing options for
peacebuilding. They call for caution, noting that inno-
vative nance is unlikely to be a panacea that brings
the ‘quantum leap’ for the Peacebuilding Fund that the
UN Secretary-General has called for or raise the needed
resources for nancing peacebuilding more broadly. They
explain that donor contributions will remain at the heart
of peacebuilding nancing, certainly in the near term.
Ayham Al Maleh looks at 10 years of Ocial Develop-
ment Assistance (ODA) ows to peacebuilding,
updating the ndings of a 2017 report by the Institute
of Economics and Peace and the UN’s Peacebuilding
Support Oce. Looking at the Organisation for Eco-
nomic Co-operation and Development’s Development
Assistance Committee (OECD-DAC) data, the article
notes that peacebuilding expenditures remain a small
and declining proportion of total aid disbursement to all
developing countries, although this trend seems to be
halting in the most recent years.
Building on the conviction that sustaining peace and
sustainable development are complementary and mu-
tually reinforcing, in the fth piece, Laura Buzzoni and
Henk-Jan Brinkman from the Peacebuilding Support
Oce present ndings from a portfolio review of
projects funded by the Peacebuilding Fund (PBF) from
2015 to 2018. It looks at the projects’ contribution to
the Sustainable Development Goals and notes that PBF
has contributed 83% of its total allocations to the SDGs.
Given the importance of overcoming the silos, the UN
Multi-Partner Trust Fund Oce (MPTFO) oers an
insight on a new generation of pooled funds that are
helping to bridge the humanitarian-development-peace
nancing divide. These exible instruments demonstrate
that well-designed pooled funds can quickly pivot when
faced with rapidly changing conditions on the ground.
They combine, blend and sequence development, peace
and humanitarian funding streams in crisis-aected
countries. The article argues that they improve cost-
eciency, transparency and collective outcomes not
only by pooling resources and delivery systems, but also
by sharing, and thereby reducing, the risks that often
arise in highly volatile and unpredictable settings.
Looking concretely at humanitarian nancing and
natural disasters, Ambassador Lana Zaki Nusseibeh
explains the advantages of ‘forecast based nancing’ as
a new preventive tool for humanitarian response to
climate change. The article notes that while it is not
going to eliminate what is often a US$ 10+ billion
annual gap in humanitarian nancing, it could provide,
for the rst time, a very concrete and politically feasible
way to do what the UN and international humanitarian
systems struggle so mightily to grapple with: prevent
rather than react. According to the Ambassador Lana
Zaki Nusseibeh, forecast-based nancing is ready to go
mainstream in the humanitarian system.
Continuing in the area of disaster risk management,
Michael Bennett and Rebeca Godoy point out that the
World Bank takes a multi-layered approach, encompass-
ing technical advisory work, lending and risk transfer.
With regards to risk transfers, the World Bank oers a
unique type of loan to its member countries that is
designed to provide immediate liquidity to countries
following a natural disaster – a catastrophe bond
(Cat bond). In their contribution, they explain the
advantages of cat bonds and how they will expand on
this work in the future.
Lastly, the chapter explores new avenues for migration
nancing. Jonathan Prentice looks at ways in which
the adopted Migration Compact can be realised and
provides details around the US$ 25 million Migration
Pooled Fund. He explains that the aim is to encourage
and support the design of projects which can either be
scaled up and/or replicated as bodies of best practice.
Part Two: Introduction

69
Financing SDGs
Part Two: Introduction
Chapter Four explores new ways to forge a strong multi-
lateral order in times of uncertainty.
Former UN Director General of Geneva, Michael Møller
sees current instability and period of discontent as an
opportunity to revive multilateralism by injecting it with
new levels of agility, inclusiveness and partnership.
He argues this entails breaking down internal and
external silos, forging new and unconventional partner-
ships, increasing public outreach and promoting open-
ness. Next year’s seventy-fth anniversary of the UN is
another opportune moment for Member States to restate
their commitment to the organisation and to multilateral
cooperation, while encouraging new models of inclusive
multilateralism and diplomacy.
In the next piece, Ulrika Modéer states that in order for
the multilateral system to regain trust and bolster the
rule-based and value-driven system, it needs to address
discontent and evolve to be ‘t for purpose’. She calls on
Member States to show their support for and trust in the
ability of the UN development system to meet both the
promises and the responsibilities of achieving the SDGs
and increase the core-share for more predictable funding.
She notes the UN system, however, needs to demon-
strate that it is an eective, reliable and ecient partner
on the road to 2030.
Multilateralism is a hard option argues Bruce Jenks in the
next piece ‘Multilateralism: An instrument of choice’.
To be eective, multilateralism must be a choice that is
made because it is the most eective or ecient instru-
ment available to a government. He notes that countries
should work multilaterally when it is the most eective
way to meet a challenge. It should not become a way of
abdicating leadership, it must be a way of exercising it.
Adriana Erthal Abdenur brings a perspective on multilat-
eralism from the Global South. In her contribution she
highlights that the Global South is increasingly frustrated
that global norms are, too often, set by global powers,
and that – recent restructuring eorts notwithstanding
– deeper reform of the system is hampered by geo-
politics and outdated, unjust power structures that date
back to the post-World War II period. She argues that
three particular steps are needed to boost the engagement
of the Global South in the defense of multilateralism.
In the nal piece Kanni Wignaraja reminds us how
important Millennial Investors are in shaping the next
multilateral order. She notes that the millennial genera-
tion – as leaders, consumers, self-starters and investors –
can dramatically move the needle on inuencing
SDG investments, locally and globally. She highlights
how the UN Development Programme is expanding its
knowledge on Millennial Investors and engaging with
them so they can transition from considering nancing
of the SDGs as fringe philanthropy to being mainstream
better-business for all.
70
Financing the 2030 Agenda:
The big picture
PART TWO
Chapter One
International financing of the Sustainable Development Goals
by Homi Kharas
The United Nations Secretary-General’s strategy for financing
the 2030 Agenda for Sustainable Development
by Fiona Bayat-Renoux
Investment Gapportunities:
Changing the narrative on investment in sustainable development
by Navid Hanif and Philipp Erfurth
Driving development finance to the ground: Closing the investment gap
by Ambassador E. Courtenay Rattray
Bye-bye, billions to trillions
by John W. McArthur
How does science and technology policy shape inequality?
by Pedro Conceição
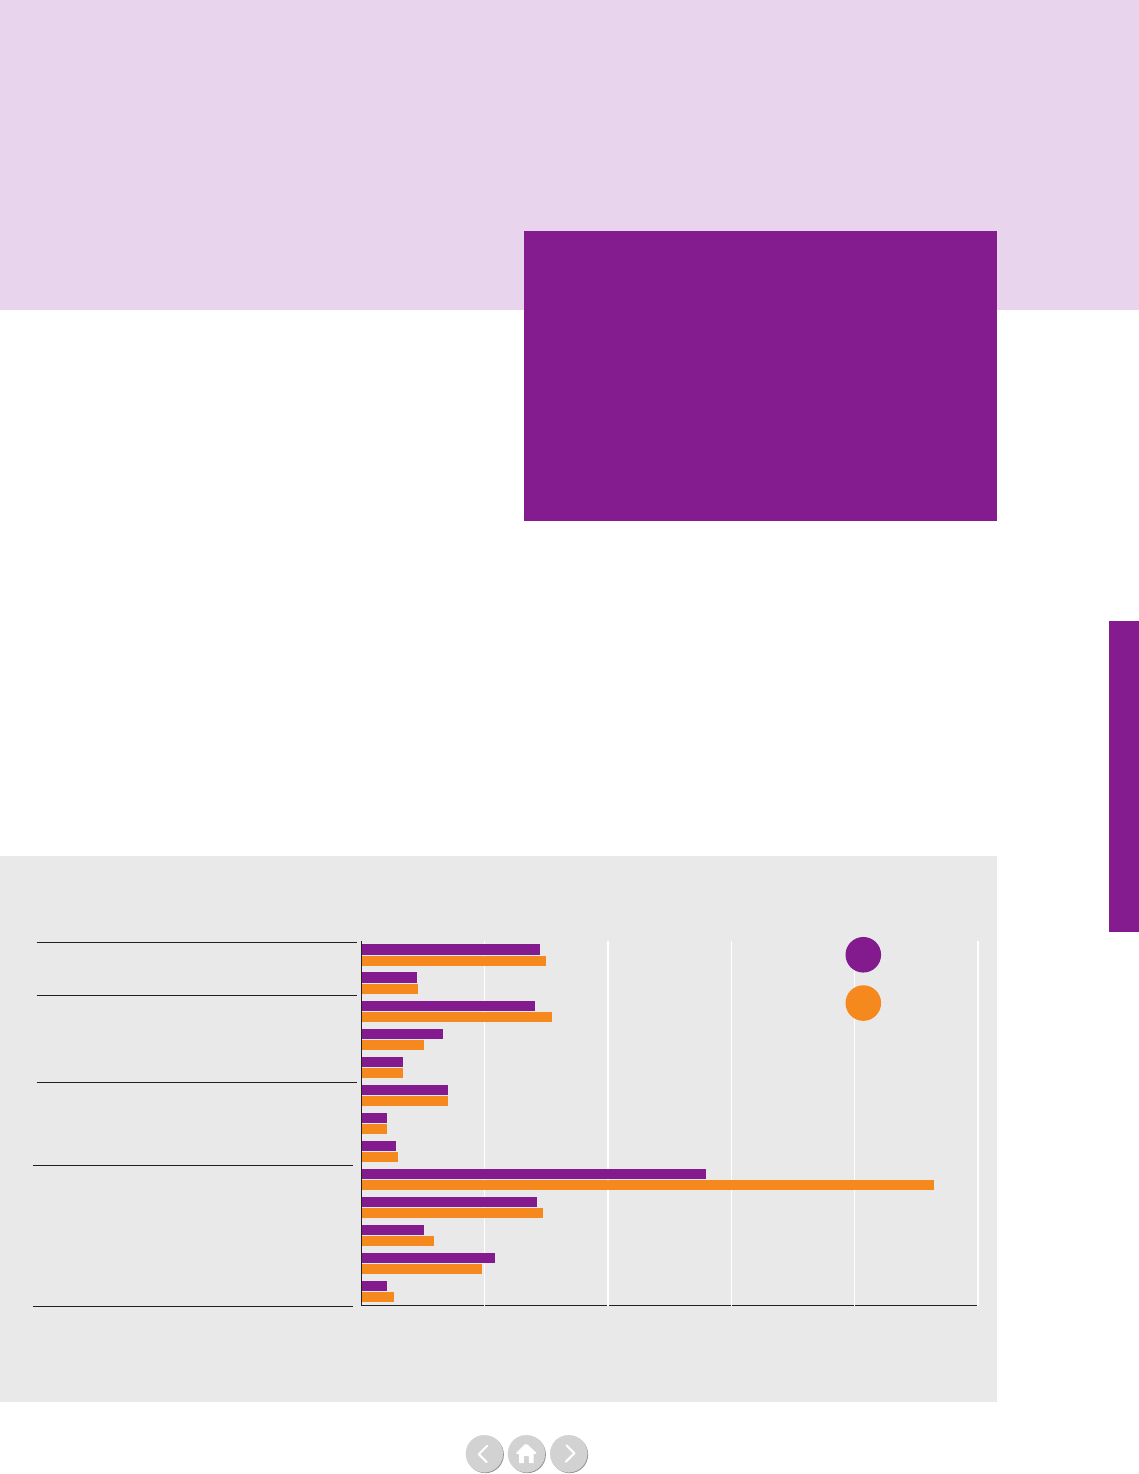
71
The big picture
Homi Kharas is Interim Vice President and Director
at the Brookings Institution, which is a non-
prot public policy organisation that brings
together more than 300 leading experts in
government and academia from all over the
world. Homi Kharas studies policies and trends
inuencing developing countries, including aid to
poor countries, the emergence of the middle class,
global governance and the G20.
International financing of the
Sustainable Development Goals
By Homi Kharas
Private finance is rising
Cross-border nancing of the Sustainable Development
Goals (SDGs), when dened as the ows to developing
countries of nancing that likely nance investments
directly related to the SDGs, rose to US$ 675 billion in
2017, up by 17.1% in nominal terms from 2016. The
increase was largely due to private ows that rose by
almost US$ 100 billion (Figure 1).
Among the various components of private ows, sover-
eign lending had the largest increase. At least 92 develop-
ing countries now have a bond rating from one of the
three major rating agencies. Most countries with ratings
conducted in 2017 or later had stable outlooks, with the
exception of Venezuela, whose rating has deteriorated.
This outlook, combined with low interest rates on world
capital markets, and continued search for yield, provided
a favourable context for developing and emerging market
economies to borrow internationally. This has generated
some concerns about rising debt levels, and the Inter-
national Monetary Fund (IMF) nds that 24 countries,
mostly in Africa, are at high risk of debt distress, while
seven countries are already in debt distress.¹ There is,
however, a marked dierence between the market and
IMF perceptions: the former gives far more weight in
creditworthiness analysis to institutional factors such as
the rule of law and policy space (which are improving
in 2017), while the IMF gives more weight to debt ratios
(which are deteriorating).
Figure 1: Broadly-defined international development contributions (current US$ billion)
0 50 100 150 200 250
2017
2016
Impact investing
Investments in infrastructure
Official mobilised
Philanthropy
Lending to sovereigns
Other grants credits
India
China
Non-ODA GPGs
Loans equity
Grants credits
Loans equity
Grants credits
US$ billion
OECD-
DAC
flows
Multilateral
flows
Non
OECD-DAC
flows
Private
flows
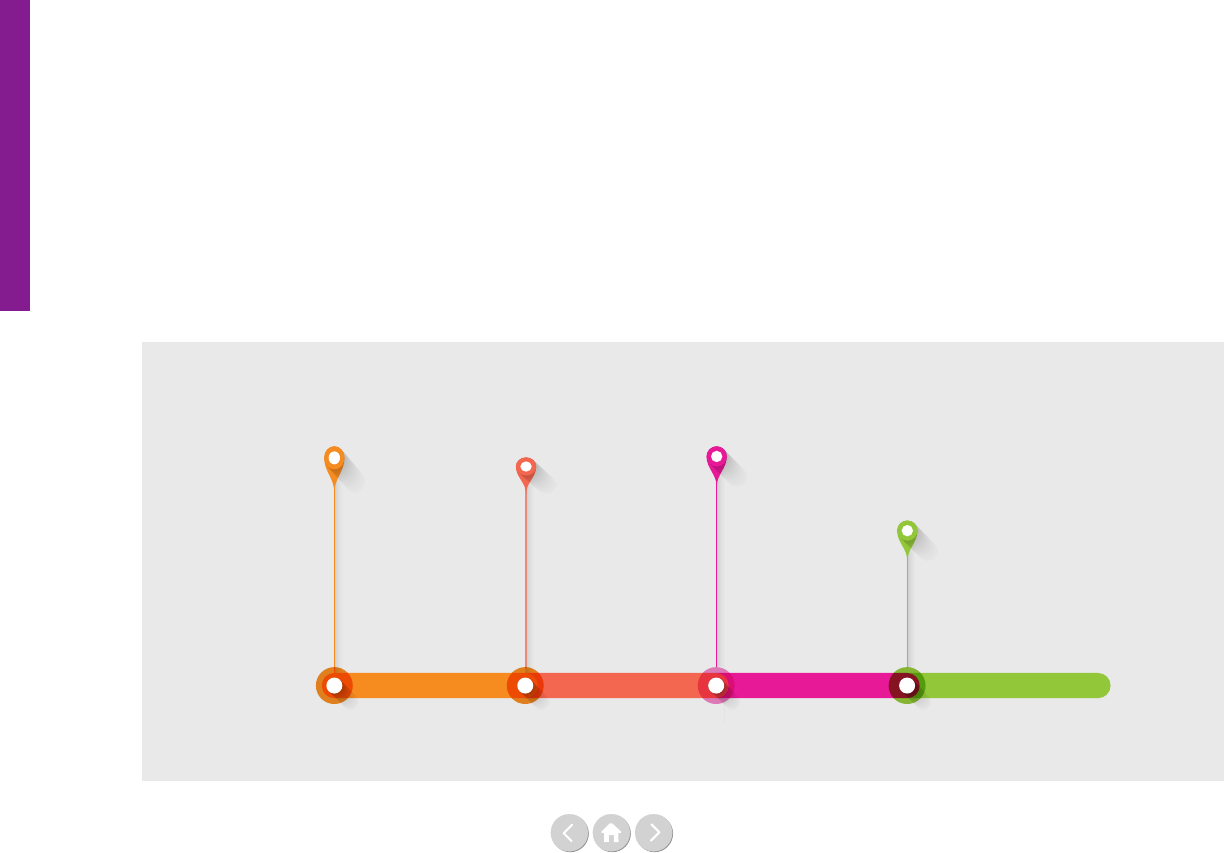
72
The big picture
Aside from sovereign lending, private loans mobilised by
ocial nance (ie where projects are jointly funded by
public and private sources) also recorded rapid growth of
15.6% in 2017, although volumes remain much smaller
at US$ 29.2 billion. The trajectory for private mobilised
nance is upwards, with several leading organisations, such
as the International Finance Corporation, set to receive
a capital increase that will allow it to expand in this area,
and other specic funds like the World Bank International
Development Association (IDA) 18 private sector window
supplying dedicated ocial funding to this purpose.
In the same vein, impact investing into developing coun-
tries had a substantial 27.4% increase in 2017, reaching
a level of US$ 13.1 billion in new ows. Here, too, the
trajectory is positive. Industry reports suggest that impact
investing is becoming mainstreamed, with considerable
demand from institutional investors.
Other components of international nancing for the
Sustainable Development Goals did not fare as well.
Private investments in infrastructure (excluding projects
done jointly with ocial agencies) fell slightly, largely
due to macroeconomic eects in selected countries where
much activity was concentrated, like Brazil and Turkey.
Grants and credits rose by 6%, mostly through multilateral
sources, while bilateral grants and credits were fairly at.
Grants for nancing global public goods, a perennial issue
for organisations that set global norms and standards,
barely changed. Net disbursements on loans from multi-
laterals, mostly to middle-income countries, fell by
US$ 8 billion to US$ 25.5 billion.
There is little fresh evidence on the volume of develop-
ment cooperation from China and India, so in Figure 1
on the previous page the volumes are assumed to be
constant. It is noteworthy, however, that these ows are
far lower than ows from private markets, suggesting that
the rhetoric of China’s contribution to over indebtedness
may be exaggerated. Of course, the aggregate gures may
disguise issues that arise in a particular country context,
but here too, analytical work suggests that China’s Belt
and Road Initiative is ‘unlikely to cause a systemic debt
problem in the regions of the initiative’s focus.’²
The changes in development nancing reect likely
medium-run trends: tight grant budgets with limited
scope for expansion, diculty in raising funds for global
public goods, rising but volatile private ows, and expan-
sion of blended nance and impact investing innovations.
A difficult aid environment
Typically, aid to a particular multilateral agency has been
allocated on a case-by-case basis, dependent on past
giving, burden sharing, t with donor priorities and
institutional eectiveness. Aid budgets would adjust to
these cycles in new aid demands. But in 2019 and 2020,
a period when aid budgets will be tight, the replenish-
ment cycles of several large agencies are overlapping, so
aid for one entity might result in reduced aid for another
(see Figure 2).
The total for these eight institutions approaches
US$ 70 billion. Of course, this gure has to be inter-
preted in proper context. Unlike annual aid ows, the
replenishments are for multiple years. Nevertheless, they
represent a sizable fraction of the aid budgets of individual
countries. Already, donors are expressing preferences as to
what they will or will not fund. For example, the United
States has indicated it will not pledge to the new Green
Climate Fund replenishment (and indeed will not honour
its US$ 3 billion pledge to the initial round), and while
others, including Germany have oered to compensate in
part by doubling their contribution, it is unclear who else
will follow.
Figure 2: The compressed current cycle of replenishments
THE AFRICAN
DEVELOPMENT
FUND
(4th working group
meeting May 22,
2019, hoped for
funding upwards
of US$ 10 billion)
THE
INTERNATIONAL
FINANCE
FACILITY FOR
EDUCATION
(pledging session,
ask about
US$ 2 billion)
2019
2019
2019
April
THE GLOBAL
FUND
(6th replenishment,
funding ask
US$ 14 billion)
October
September
INTERNATIONAL
FUND FOR
AGRICULTURAL
DEVELOPMENT
(12th replenishment
first consultation
session, funding
ask about
US$ 1.4 billion)
2019
May
73
The big picture
THE
INTERNATIONAL
DEVELOPMENT
ASSOCIATION
19th replenishment
- IDA 19
(pledging session,
December 2019,
funding ask upwards
of US$ 23 billion)
3rd GAVI
REPLENISHMENT
(upwards of
US$ 7.5 billion)
2019 2019
THE GREEN
CLIMATE FUND
(funding upwards
of US$ 10 billion)
2020
Autumn December mid-2020
THE GLOBAL
PARTNERSHIP
FOR EDUCATION
(upwards of
US$ 2.3 billion)
2020
Autumn
The choices made by donors on how to allocate their aid
will have a considerable bearing on sustainable develop-
ment. The tight budget envelope will make it harder to
increase core funding for multilateral agencies already
struggling to maintain their daily work on setting norms
and standards. It will also imply more pressure on ad hoc
requests for humanitarian assistance and responses to
natural disasters. New agendas requiring collective action
such as ocean management, migration, refugees or cyber-
security will need to be horseshoed into donor budgets.
The big picture
Low-income countries rely on aid to achieve even mini-
mum public spending levels. A typical Minister of Finance
of a low-income country may have only US$ 100 per
capita to allocate for health, education, water and sanita-
tion, poverty and social assistance, food and nutrition,
security, roads and energy. Unsurprisingly, this does not
permit choices that would meet the SDG needs. This
is one reason why aid is so important for low-income
countries. The private sector is often not a major player in
low-income countries or in fragile states. This is why there
is a special window in IDA18, to encourage more private
sector involvement in these areas. But actual disburse-
ments from this window, specically from the guarantee
mechanism, are moving slowly, showing how dicult it is
to encourage these kinds of ows. Thus, the growing ows
of private funding is of cold comfort to many low-income
and fragile countries who rely primarily on aid.
For these countries, recent news is not very good. The
Organisation for Economic Co-operation and Develop-
ment (OECD) reports that development aid, excluding
in-donor-country refugee costs, was at from 2017 to
2018, and that less aid went to Least Developed Countries
and African countries where it is most needed.³
Even for middle-income countries, private ows are not
a full substitute for aid. They are volatile, and more
experienced middle-income countries recognise they
need to build reserve buers to oset this volatility, or risk
being caught in a crisis. The need to build reserves,
however, osets some of the benets of getting private
sector nancing in the rst place. It means the net ows
available to nance SDG investments are reduced. The
private sector (domestic and international) also shifts
money out of developing countries (the so-called base
erosion and prot shifting issue) and sometimes just takes
money out, regardless of laws against capital ight
(the illicit nancing problem). When all is said and done,
these kinds of outows exactly oset the inows that
developing countries receive from aid and private
nancing. The IMF’s most recent forecast for net ows to
developing countries in 2019 is … zero.
Footnotes
¹ International Monetary Fund, ‘List of LIC DSAs for PRGT-
Eligible Countries As of January 21, 2019’, (list, IMF, 2019).
https://www.imf.org/external/Pubs/ft/dsa/DSAlist.pdf
² John Hurley, Scott Morris and Gailyn Portelance,
‘Examining the Debt Implications of the Belt and Road
Initiative from a Policy Perspective’, (policy paper, Center
for Global Development, 2018).
https://www.cgdev.org/sites/default/files/examin-
ing-debt-implications-belt-and-road-initiative-policy-per-
spective.pdf
³ Organisation for Economic Co-operation and Develop-
ment, ‘Development aid drops in 2018, especially to
neediest countries’, (report, OECD, 2018).
http://www.oecd.org/newsroom/development-aid-drops
-in-2018-especially-to-neediest-countries.htm

74
The big picture
The United Nations Secretary-General’s
strategy for financing the 2030 Agenda
for Sustainable Development
By Fiona Bayat-Renoux
Fiona Bayat-Renoux is a Senior Programme
Ocer on Financing the 2030 Agenda, in the
Executive Oce of the Secretary-General, United
Nations. Prior to this Fiona was the Director of the
Sustainable Digital Finance Alliance and Senior
Advisor to the Deputy Executive Director of UN
Women. Fiona Bayat-Renoux has held various
positions with the United Nations, including in
Sri Lanka, the Democratic Republic of the Congo,
Zimbabwe and Afghanistan.
In 2030 when the world assesses whether the Sustain-
able Development Goals (SDGs) and the Paris climate
agreement should be hailed as multilateralism’s greatest
triumph or failure, achievements will be evaluated in
real terms against SDG indicators, and in nancial terms
against SDG investments. If the world was to measure
progress on key nancial indicators related to the SDGs
and the Paris Agreement today, how would we fare?
Since signature of the Paris Agreement, coal-red
capacity has grown by over 92,000 MW, with another
670,000 MW in the pipeline, driven by investments of
over US$ 478 billion by the nancial industry.¹ Global
ows of foreign direct investment (FDI) fell by 23%
in 2017², and private investments in key SDG-related
infrastructure in developing countries are lower today
than in 2012.³ On a more positive note, sustainable
investing is on the rise – reported at US$ 30.7 trillion
in the ve major developed markets at the start of 2018⁴
– signalling a recognition by the nancial industry of
the value of long-term sustainable investing and the
importance of considering climate risks into investment
decision-making.
However, sustainable investing represents only a fraction
of the US$ 200 trillion in global private sector nancial
assets, and the lack of common denitions, standards and
impact measurement means that such numbers should
be treated with caution. This is particularly evident when
compared against the estimated SDG nancing gaps
– for example – an annual US$ 2-3 trillion investment
gap to achieve the SDGs in developing countries⁵;
an annual US$ 2.5-3.5 trillion infrastructure investment
gap to meet the SDGs and the goals of the Paris Agree-
ment⁶; and over US$ 1.1 trillion of annual investment
needed in clean energy alone.⁷
Closing the investment gaps to create the world envi-
sioned in the 2030 Agenda, a world of prosperity for all
people and safety of our planet is possible given, rstly,
the size, scale and level of sophistication of the
global nancial system.⁸ In 2017, gross world product
and global gross nancial assets were estimated at over
US$ 80 trillion⁹ and US$ 200 trillion respectively.
10
Secondly, investing in the SDGs makes economic sense.
It has been estimated that investing in the SDGs could
open up US$ 12 trillion of market opportunities and
create 380 million new jobs by 2030
11
, and that action
on climate change would result in savings of US$ 26
trillion.
12
Yet, current investment levels are far from the
scale and speed required to realise the SDGs and goals
of the Paris Agreement by 2030, creating an urgent need
for action by public and private stakeholders at global,
regional and country levels.
The UN Secretary-General’s
Financing Strategy
The United Nations has a long history of supporting
Member States on nancing for development. The UN
supports intergovernmental processes at the highest
levels, and provides technical and programmatic exper-
tise on a range of nancing issues, including investment,
trade nance, debt sustainability, public scal manage-
ment and green nance. The UN also plays an important
convening, partnership-building and knowledge
management role, increasingly to strengthen the
engagement of the private sector and nancial industry
in sustainable nance.
To enhance the UN’s support, the Secretary-General
launched his Strategy for Financing the 2030 Agenda for

75
The big picture
Sustainable Development during the UN General
Assembly in September 2018.
13
The Strategy builds on
the Addis Ababa Action Agenda (AAAA), as the global
framework agreed by Member States for nancing
sustainable development, and on the work of the UN
development system. It is designed to address the barriers
and leverage the opportunities to transform the nancial
system from global to local levels in support of
achievement of the 2030 Agenda. The Strategy focuses
on three objectives, namely: aligning global economic
policies and nancial systems with the 2030 Agenda;
enhancing sustainable nancing strategies and invest-
ments at regional and country levels; and seizing the
potential of nancial innovation, new technologies and
digitalisation to provide equitable access to nance.
This chapter discusses each of the Strategy’s three
objectives, highlighting the role of the United Nations
system to accelerate nancing for the 2030 Agenda, in
collaboration with key partners, including the World
Bank Group (WBG), the International Monetary Fund
(IMF), regional development banks and the nancial
industry. The paper concludes by outlining the Secretary-
General’s three-year roadmap and key initiatives to
support execution of his Financing Strategy, notably
within the context of the landmark summits and
mandated high-level meetings taking place during this
year’s 74th session of the UN General Assembly.
Objective one: Aligning global economic policies
and nancial systems with the 2030 Agenda
The current global economic context is characterised by
uneven growth and increasing inequality. Rising public
debt levels constrain governments from undertaking
large-scale scal stimulus measures, while trade tensions
have led to more than half a trillion dollars’ worth of
goods subject to trade restrictions, a seven-fold increase
over last year.
14
The aftermath of the 2008 global nan-
cial crisis, including years of historically low interest rates
and ample liquidity may have created unintended risks
for economic stability and inequality.
15
The post-2008
regulations, including capital requirements, have also
created further disincentives for long-term investing,
notably in infrastructure. Within this context, nancial
markets are susceptible to perceptions of risk, leading to
nancial instability and contagion.
16
At the same time,
the rapid ‘digitalisation of the economy’ is creating new
challenges for international tax cooperation – countries
are unable to tax prots of certain new business models
that do not require a physical presence in that market to
derive such prots. This consequence of the digital
economy has also contributed to falling levels of FDI.
Against this backdrop, the Secretary-General’s Financing
Strategy highlights the critical role that public policies
play in realigning incentives and perceptions of risks,
which in turn inuence the allocation of capital, limit
excessive nancial volatility and encourage the nan-
cial system to strengthen resilience to economic shocks.
Leveraging the UN’s unique role in terms of global
norm setting, the Strategy advocates for embedding the
principles of the 2030 Agenda in global nancial and
economic policies. This includes aligning investment and
trade regimes with sustainable development; promoting
more responsible and transparent borrowing and lending
practices; and encouraging a more inclusive and eective
approach to address fundamental and frontier tax-related
issues in support of the 2030 Agenda (such as taxation of
the digital economy and consideration of the gender and
environmental implications of taxation).
The Strategy also highlights the importance of
addressing barriers related to the lack of globally agreed
denitions, standards and harmonised measurement and
reporting frameworks for sustainable investing. For
example, while green bond issuance has increased
enormously – from US$ 2.6 billion in 2012 to
US$ 167.6 billion in 2018
17
– it represents only about
1-2% of total bonds issued globally.
18
The current lack
of harmonised standards, as well as challenges related
to transparency about the use of proceeds, hampers its
further development.
19
The UN is working with policy-
makers and the nancial industry to frame discussions
around denitions, standards, and measuring and report-
ing methodologies to guide the evolution of SDG-
related nancial instruments and deepen nancial
markets for sustainable development. The UN also
catalyses partnerships across nancial institutions,
nancial markets and corporations to align private
investment policies and practices with long-term invest-
ment in the SDGs and the goals of the Paris Agreement.
Objective two: Enhancing sustainable nancing strategies
and investments at regional and country levels
The Addis Ababa Action Agenda recognises that
signicant additional domestic public resources, supple-
mented by international assistance as appropriate, as well
as private investment, are critical to realising sustainable
development. However, developing country govern-
ments are constrained by limited scal space and insti-
tutional capacity, weak nancial systems, poor pipelines
of bankable SDG-investment projects and illicit nancial
outows. Least Developed Countries (LDCs), graduating
and newly graduated LDCs
20
, countries aected by
conict, and Small Island Developing States (SIDS),
given their vulnerabilities to the impacts of climate
change, face the greatest challenges in terms of mobilising
long-term, aordable nance for sustainable development.
The Secretary-General’s Strategy recognises that
harnessing the nancial system and promoting consistent
levels of long-term investment is essential for developing

76
The big picture
countries to transition to low-carbon, inclusive and
sustainable development pathways. The Strategy empha-
sises the important role of the UN to support countries
to identify and address the barriers and opportunities
for greater alignment of national and regional nancial
systems with sustainable development, including through
regulatory, policy and nancial incentives. Developing
and promoting investment policies that place sustain-
able development at the heart of eorts to attract and
benet from investment is vital. The UN will continue
to strengthen the capacity of national and sub-national
governments to develop SDG-aligned investment
promotion policies and incentives, and formulate a
pipeline of bankable projects. The UN will also step up
eorts with the nancial sector to better align lending
practices, develop nancial products that support the
SDGs, and strengthen credit markets for micro, small
and medium enterprises (MSMEs).
The Secretary-General’s Strategy highlights the impor-
tance of strengthening the eectiveness of tax systems to
generate domestic public resources to meet the SDGs.
The UN will continue to support countries to promote
SDG and gender-responsive tax systems, and strengthen
regional and national capacity to improve tax trans-
parency and reduce tax crime, base erosion and prot
shifting. Recognising the enormous negative impact of
illicit nancial ows, the Secretary-General’s Strategy
puts a spotlight on the need for the UN, in collaboration
with other institutions, to support developing countries
to curb such ows. The UN’s work in this area includes
analysis and advocacy, regional and country capacity
building to tackle illicit nancial ows and corruption,
and support to international cooperation eorts to
facilitate the recovery and return of stolen assets.
In order to enable countries to mobilise sucient
resources from all sources to implement national develop-
ment strategies, the AAAA highlights the need for
integrated national nancing frameworks (INFFs). The
Inter-Agency Task Force on Financing for Development
(IATF), convened by the Secretary-General to follow up
on the AAAA and comprised of over 50 United Nations
entities and other relevant international institutions,
including the WBG and IMF, sets out the building blocks
for developing such frameworks in its 2019 Report.
These steps include assessing nancing needs, ows and
risks; developing a nancing strategy that identies
required public and private nancing policy action;
putting in place mechanisms for monitoring and review;
and setting up high-level governance and coordination
mechanisms.
21
In order to ‘leave no one behind’, the UN closely
supports LDCs, graduating LDCs, countries aected
by conict and SIDS. Ocial Development Assistance
(ODA) and concessional nance in line with the princi-
ples of national ownership are critical in these countries.
The UN plays an important role in collaborating with
development and International Financial Institutions
(IFI) partners to better understand the challenges such
countries face and assessing the potential for blended and
special nancing instruments that bring both sustainable
development and nancing additionality.
Objective three: Seizing the potential of
nancial innovation, new technologies and digitalisation
to provide equitable access to nance
The Secretary-General’s Strategy emphasises that access
to adequate, accessible and aordable nance is one of
the pre-requisites of sustainable and equitable develop-
ment, particularly for women and MSMEs, which are
recognised engines of economic growth and job
creation. However, the current nancing gap for MSMEs
in developing countries is estimated at US$ 5.2 trillion
per year because of a number of barriers, including
diculties MSMEs face in terms of providing collateral
and ensuring transparency with respect to their
creditworthiness.
22
These barriers are particularly acute
for women-owned MSMEs.
Financial innovation, new nancial instruments and the
digitalisation of nance
23
are demonstrating their ability
to address some of these barriers and unlock access to
new and traditional sources of nance and nancial
services. The revolutionary impact of mobile money
on nancial inclusion is well known, with mobile
accounts in sub-Saharan Africa nearly doubling since
2014 to 21%.
24
Powered by the interaction of inno-
vations in digital nance and the real economy, new
business models are driving e-commerce and making
investment in sustainable sectors commercially viable.
25
For example, leveraging mobile payments platforms,
nancial technology has unlocked pay-as-you-go solar
units, which has increased investment in, and access to
clean energy, particularly for poor, rural and underserved
households. The combination of big data, articial
intelligence and automation is also creating alternative
models to assess creditworthiness. This has unleashed a
range of online marketplace lending platforms, which
either provide direct nancing or enable nancing by
matching lenders and investors with borrowers. Similarly,
nancial technologies leverage large volumes of data to
better identify, assess and price investments, making it
cheaper and faster to integrate environmental, social
and governance (ESG) considerations into investment
decision-making. Financial technologies also improve
measuring, validating and tracking the ‘greenness’ of
investments, and facilitate regulatory compliance – all of
which can help to increase private investment in sustain-
able development.

77
The big picture
At the same time, nancial technologies create new risks
for customers and nancial market stability, as well as
unintended economic, social and environmental
consequences. Serious concerns are surfacing about the
use and protection of vast amounts of consumer data
generated by technology. Concerns are also arising
around the safety, fairness and trustworthiness of articial
intelligence, where biases in algorithms that make
increasingly important decisions aecting people’s
livelihoods, including access to nance, could increase
exclusion, especially for poorer communities, minorities
and women. Similarly, low-skilled workers and women
are most likely to experience job losses as technology
increases investments in certain sustainable business
models, while creating job losses in other sectors.
Environmental impacts are also likely to grow as smart
devices and certain digital technologies are increasing
energy and data centre demand.
26
The UN has a unique role to play in bringing together
policy makers, regulators, civil society, companies and
innovators from the nancial and technology industry,
as well as from the real economy to identify the implica-
tions of digital nance and nancial innovation both in
terms of the opportunities for nancing the SDGs, and
in terms of the risks.
Execution of the
Secretary-General’s Financing Strategy
In his Financing Strategy, the Secretary-General commits
to providing a three-year roadmap of actions and
initiatives to mobilise investment and support for
nancing the 2030 Agenda. The roadmap identies
specic initiatives where the Secretary-General’s leader-
ship can galvanise action and enhance the work by the
UN system to support Member States in mobilising such
needed investments.
As part of the roadmap, the Secretary-General has
already initiated a number of actions. For example, in
order to harness the potential of digital nancial tech-
nologies and mitigate the risks, the Secretary-General
has established a Task Force on Digital Financing of the
SDGs.
27
The Task Force was launched in November
2018, with a mandate to identify opportunities,
challenges and ways to advance the convergence of
digital technology, the nancial ecosystem and the SDGs.
The Task Force is co-chaired by the Administrator of the
UN Development Programme (UNDP) and the Chief
Executive Ocer (CEO) Emeritus of Absa Holding,
one of South Africa’s leading banks, and its membership
includes leaders of ntech companies, commercial and
development banks, central bank governors and ministers
and UN agencies. The Task Force is supported by a
Secretariat led by the UN Capital Development Fund.
Through a wide range of consultations and research, the
Task Force will provide an interim progress report in
advance of the High-Level Dialogue on Finance,
scheduled to take place during the UN General
Assembly in September 2019, and a nal report, with
actionable recommendations in early 2020.
In April 2019, the Secretary-General announced the
establishment of a CEO alliance of Global Investors for
Sustainable Development (GISD). This unique alliance,
comprising of 25 to 30 CEOs, is aimed at harnessing
the insights of private sector leaders on ways to unblock
impediments and implement solutions for scaling long-
term investment for sustainable development. The GISD
builds on the membership and experience of various
networks and initiatives in the UN system and beyond
with the purpose of bringing together business solutions
and policy initiatives.
The Secretary-General will also promote a more strate-
gic, systematic and coordinated collaboration between
the UN system and multilateral development banks
(MDBs). The work of the UN across humanitarian,
peace and security, climate change, nancing and sustain-
able development issues complements the mandate and
institutional expertise of MDBs to provide and catalyse
investments for sustainable development. A stronger and
more eective partnership between the UN and MDBs,
which better leverages the respective comparative advan-
tages of each institution, could signicantly accelerate
international cooperation to achieving the 2030 Agenda
and Paris climate agreement.
The Secretary-General’s initiatives are particularly rele-
vant within the context of the 74th session of the UN
General Assembly, where a series of summits and
mandated high-level meetings will be held, aimed
at taking stock of progress made on the SDGs since
2015, and increasing commitments to scale up SDG
implementation and climate action. Notably, the
Secretary-General’s Climate Action Summit will
provide a global platform to dramatically increase
ambition in climate action and will enable a specic
focus on climate nance. The High-level Dialogue on
Financing for Development will provide an opportu-
nity for the world to bring forward pathways that can
unleash the might of the global nancial system and real
economy to realise the ambitions of the 2030 Agenda.
Together, these and other eorts at global, regional and
country levels demonstrate that we can use the power of
nancing to combat the impacts of climate change, and
create a world of peace and prosperity for all.

78
The big picture
Footnotes
1
Urgewald, ‘New Research Reveals the Banks and Investors
Financing the Expansion of the Global Coal Plant Fleet’,
(media briefing, Urgewald, 5 December 2018).
https://urgewald.org/medien/new-research-reveals-banks-and-in-
vestors-financing-expansion-global-coal-plant-fleet
² United Nations Conference on Trade and Development
(UNCTAD), ‘World Investment Report, Investment and New
Industrial Policies’, (report, UNCTAD, 2018).
https://unctad.org/en/PublicationsLibrary/wir2018_en.pdf
3
The Inter-agency Task Force on Financing for Development,
‘2019 Financing for Sustainable Development Report’,
(report, United Nations, 4 April 2019).
https://developmentfinance.un.org/fsdr2019
4
Major markets are: Europe, United States, Japan, Canada, Austra-
lia/New Zealand. Global Sustainable Investment Alliance,
‘Global Sustainable Investment Review’, (report, Global Sustain-
able Investment Alliance, 2018),
http://www.gsi-alliance.org/trends-report-2018/
5
UNCTAD, ‘World Investment Report 2014, Investing in the
SDGs: An Action Plan’, (report, UNCTAD, 2014).
https://unctad.org/en/PublicationsLibrary/wir2014_en.pdf
6
Organisation for Economic Co-operation and Development,
‘Investing in Climate, Investing in Growth’, (report, OECD, 2017).
http://dx.doi.org/10.1787/9789264273528-en
7
Global Commission on the Economy and Climate,
‘The 2016 New Climate Economy Report: The Sustainable
Infrastructure Imperative, Financing for Better Growth and
Development’, (report, Global Commission on the Economy and
Climate, 2016). https://newclimateeconomy.report/2016/
8
Hendrik du Toit, Aniket Shah and Mark Wilson, ‘Ideas for action
for a long-term and sustainable financial system’, (report, Business
and Sustainable Development Commission, January 2017).
http://s3.amazonaws.com/aws-bsdc/BSDC_SustainableFinance
System.pdf
9
World Bank, ‘Gross domestic product, 2017 World Development
Indicators’, (databank, World Bank, 2018), accessed May 2019.
https://databank.worldbank.org/data/download/GDP.pdf
10
Kathrin Brandmeir, Michaela Grimm, Michael Heise, Arne
Holzhausen, ‘Wealth Report 2018’, (report, Allianz Global, 2018).
11
AlphaBeta, ‘Valuing the SDG Prize: unlocking business oppor-
tunities to accelerate sustainable and inclusive growth’, (paper,
Business and Sustainable Development Commission, 2016).
12
Global Commission on the Economy and Climate, ‘The 2018
New Climate Economy Report: Unlocking the Inclusive Growth
Story of the 21st Century: Accelerating Climate Action in Urgent
Times’, (report, Global Commission on the Economy and Climate,
2018). https://newclimateeconomy.report/2018/
13
United Nations Secretary-General, ‘Secretary-General’s Strategy
for Financing The 2030 Agenda for Sustainable Development
(2018-2021)’, (Strategy document, United Nations, September
2018). https://www.un.org/sustainabledevelopment/wp-content/
uploads/2018/09/SG-Financing-Strategy_Sep2018.pdf
14
2019 Financing for Sustainable Development Report. See Footnote 3.
15
Matthew Oxenford, ‘The Lasting Effects of the Financial Crisis
Have Yet to be Felt’, Chatham House, the Royal Institute of
International Affairs, 12 January 2018.
https://www.chathamhouse.org/expert/comment/lasting-effects-
financial-crisis-have-yet-be-felt#
16
World Bank Group, ‘The landscape for institutional investing
in 2018: Perspectives of Institutional Investors, An Input into the
Investor Forum’, (working paper, World Bank, October 2018).
https://openknowledge.worldbank.org/handle/10986/30901
17
Monica Filkova, Camille Frandon-Martinez and Amanda Giorgi,
‘Green bonds: The State of the Market’, (report, Climate Bond
Initiative, 2018). https://www.climatebonds.net/resources/reports/
green-bonds-state-market-2018
18
This proportion is as of 2017. Green bond issuance in 2017 at
US$ 167.1 billion was very close to 2018 levels. Miroslav Petkov,
‘A Look at Banks’ Green Bond Issuance Through the Lens of Our
Green Evaluation Tool’, (online report, S&P Global, 2 March 2018).
https://www.spglobal.com/en/research-insights/articles/A-Look-
at-Banks-Green-Bond-Issuance-Through-the-Lens-of-Our-Green-
Evaluation-Tool
19
Kathrin Berensmann, ‘Upscaling Green Bond Markets: The Need
for Harmonised Green Bond Standards’, (briefing paper, Deutsches
Institut für Entwicklungspolitik/German Development Institute,
2017). https://www.die-gdi.de/uploads/media/BP_12.2017.pdf
OECD, ‘Mobilising Bond Markets for a Low-Carbon Transition
by 2035’, (report, OECD, 2017).
https://doi.org/10.1787/9789264272323-en
20
Graduating LDCs usually refers to countries from the time they
are found to be eligible for graduation from the LDC status by the
Committee for Development Policy (CDP) until the time they have
graduated, after which they may be referred to as ‘newly graduated
LDCs’. The CDP uses three criteria to identify countries for inclu-
sion into and graduation from the LDC list by comparing criteria
scores with thresholds established by the CDP. The three criteria are:
gross national income per capita; human asset index; and economic
vulnerability index. UN Department of Economic and Social
Affairs, ‘Handbook on the Least Developed Country Category’,
(handbook, UN, October 2018).
https://www.un.org/development/desa/dpad/wp-content/up-
loads/sites/45/2018CDPhandbook.pdf
21
2019 Financing for Sustainable Development Report. See Footnote 3.
22
International Finance Corporation (IFC) and SME Finance
Forum, ‘MSME Financing Gap Report, Assessment of the Shortfalls
and Opportunities in Financing Micro, Small and Medium
Enterprises in Emerging Markets’, (report, IFC, 2017).
https://www.smefinanceforum.org/post/msme-finance-gap-report
23
In its Framing Document (2019), the Secretary-General’s Task
Force on Digital Financing of the SDGs defines the digitalisation
of finance as systemic changes to the financial ecosystem due to
digital technologies, which refers to both the increased digitisation
of finance-related activities, and the broader, associated changes in
business models, products and services, governance, and resulting
changes at the nexus between the financial system and the real
economy. United Nations Secretary-General’s Task Force on Digital
Financing of the Sustainable Development Goals, ‘Harnessing the
Digitalization of Finance to Achieve the Sustainable Development
Goals’, (framework document, United Nations, March 2019).
https://digitalfinancingtaskforce.org/wp-content/up-
loads/2019/03/2019-March-FRAMEWORK-DOCU-
MENT-first-edition-1.pdf
24
‘Financial Inclusion: Technology, Innovation, Progress’, (report,
United Nations Secretary-General’s Special Advocate for
Inclusive Finance for Development, 2018).
https://www.unsgsa.org/files/1715/3790/0214/_AR_2018_web.pdf
25
Fiona Bayat-Renoux et al, ‘Digital technologies for mobilizing
sustainable finance’, (report, Sustainable Digital Finance Alliance, 2018).
https://docs.wixstatic.com/ugd/3d4f2c_6767ef5b999c4e3fa-
42c0e05e6ea2ac3.pdf
26
Fiona Bayat-Renoux et al, ‘Digital technologies for mobilizing
sustainable finance’, see Footnote 25.
27
https://digitalfinancingtaskforce.org/

79
The big picture
Navid Hanif is the Director of the Financing for
Sustainable Development Oce of the UNDESA.
He has held several senior positions at the United
Nations. Most recently he was Co-chair of the team
on repositioning of the UN development system
and Vice Chair of the High-level Committee on
Programmes. He has also served as Principal Ocer
in the oce of the Secretary-General and led the
creation of the UNDESA Strategic Planning Unit.
Philipp Erfurth is an Associate Economic Aairs
Ocer in the Financing for Sustainable Develop-
ment Oce, UNDESA.
The views expressed in this article are those of the
authors and do not necessarily reect positions of
FSDO/UNDESA.
Investment Gapportunities:
Changing the narrative on investment
in sustainable development
By Navid Hanif and Philipp Erfurth
Searching for ‘SDG investment gap’ on a popular online
search engine yields over a thousand results, a search
of ‘SDG investment opportunity’ only seven. Omitting
‘SDG’ from this search, yields a reverse result: Investment
opportunity produces a multiple of the results of invest-
ment gap. If we take this as an indication of perceptions
on investing in sustainable development, what conclu-
sions can we draw from these results?
Minding the gap:
The role of public investment
First, as many of the search results underline, there is,
undoubtedly, a need to accelerate our eorts to mobilise
nancing for sustainable development. Further eorts to
mobilise public resources, both at the national and global
level, will be at the heart of this endeavour.
Public resources represent a primary means to imple-
ment the 2030 Agenda, enabling governments to nance
public goods and services and empower those left behind.
Public resources also play a critical role in setting incen-
tives, including for the private sector, and in fostering
macroeconomic stability by enabling counter-cyclical
policy action.
Recent trends in national and global public resources
suggest modest, yet slow, progress. There has been a slight
increase in tax revenue, which represents a backbone
of domestic resource mobilisation. Growth in Ocial
Development Assistance (ODA), which is a critical pillar
of development nance, has plateaued in real terms and,
thus far, falls short of commitments.¹ Illicit nancial
ows, meanwhile, continue to deprive countries of
much needed resources.
Overall, there thus remains signicant scope to further
accelerate the mobilisation of public resources. Yet, alone,
public resources will not be sucient in nancing
sustainable development.
Investing in opportunities: The case for
investment in sustainable development
This leads us to the second conclusion from our online
search exercise: rather than focusing on an investment
‘gap’ in sustainable development, further eorts are
needed to promote the opportunities that investments
in sustainable development can oer, including to more
eectively attract private capital.
This will not be an easy task. It will require a major
rethink of sustainable development nancing paradigms
and a commensurate redesign of nancing frameworks at
global and national levels. In order to crowd-in invest-
ments, including from private sources, the narrative on
investing in the SDGs needs to be recalibrated from
a focus on closing a gap towards opening investment
opportunities and turning nancing needs into value
propositions for investment in sustainable development.
Studies have underlined the enormous potential of
implementing the 2030 Agenda for Sustainable
Development. A recent report, for instance, suggests that
investments in Africa of US$ 600 billion per year – more

80
than half of which could be addressed by the private
sector – could unlock opportunities for business in the
order of US$ 2 trillion a year by 2030.² Another study³
estimates that, in just four economic sectors, implement-
ing the 2030 Agenda could unlock up to US$ 12 trillion
by 2030. Yet, while these large numbers are attention
grabbing, they do not provide an incentive for resource
mobilisation from the private sector, as they do not
dene a concrete value proposition.
Large headline numbers, including those seeking to
quantify an aggregate investment gap, oversimplify the
heterogeneity of investments needed to achieve the 2030
Agenda. Investment opportunities in sustainable develop-
ment vary widely in their scope, scale and context.
In addition, not every investment is for every investor.
Eorts to foster investment in sustainable development
should thus garner momentum for accelerated action on
specic investable projects at the national and subnational
levels, supported by a re-envisaged global framework.
Aggregate estimates of a nancing gap also obscure
underlying trends in nancing for sustainable develop-
ment. In order to achieve the thrust of the 2030 Agenda
for Sustainable Development to ‘leave no one behind’,
eorts to mobilise means of implementation need to be
sensitive to trends in resource mobilisation for the most
vulnerable. A renewed focus should thus be placed on
exploring investment opportunities and nancing needs
of countries and groups that are most at risk of being
left behind, including small economies, which may
face challenges in designing projects that reach investable
scale.
Rather than a gap lling exercise, investment in sustain-
able development is an exercise in matching investments
with investors. The path to 2030 should not be seen as
a track to closing the investment gap, but represents an
investment juncture, encompassing all meanings of the
word juncture, ie as 1) a critical moment in time;
2) a place which unites, in this case investments with
investors; and 3) a state of aairs requiring decisive action.
But what action can be taken at this critical moment
in time to unite investments and investors? While there
is no silver bullet for achieving this, there are actions at
global and national levels that are worth a shot: at the
global level, action is needed to change mind-sets and
perceptions on the ‘supply-side’. At the national level,
action is required to empower the ‘demand-side’ to
generate investable projects that can attract private capital.
The global level:
Changing mind-sets on the supply side
Four years after the agreement of the 2030 Agenda and
the Addis Ababa Action Agenda (AAAA), it has become
increasingly clear that more needs to be done to align
incentives in nancial markets with sustainable develop-
ment objectives and to amend risk perceptions. It is also
clear that there is no ‘natural’ catalyst to steer the up to
US$ 300 trillion, managed by capital markets globally,
into investments for sustainable development.
To accelerate progress, alignment needs to be advanced
in a dual fashion: rst, existing investments need to be
optimised and sources of capital need to be aligned with
sustainable development objectives. Second, we need to
generate new opportunities for investment into sustain-
able development.
Old dogs, new tricks
Optimising existing investment to be aligned with
sustainable development objectives means looking for
opportunities in balance sheets to create greater value for
investors and society. There has been a notable trend of
increased investment into assets considered to be aligned
with sustainability factors, which is referred to,
sometimes interchangeably, as impact investment,
Economic, Social and Governance (ESG) investing and
innovative nance.
The lack of universally accepted denitions of
commonly used concepts has hampered the prolifera-
tion of strategies, as managers and advisors have found
it dicult to eectively communicate benets as well
as distinguish best practices from eorts to greenwash
investments. Approaches in the eld have been so broad
that the Financial Times argued that referring to
‘sustainable investment’ as a broad concept ‘would proba-
bly be one of the biggest understatements in investment’.⁴
Beyond issues of denition and despite some positive
trends, investing according to ESG criteria is far from
being the norm. A recent Schroders study⁵ (see Figure 1
on the next page) found that less than a third of investors
surveyed stated that sustainability had a signicant inu-
ence on their investment decision. A third meanwhile
stated that sustainability had little to no inuence.
The study found that investors that were more
concerned about sustainability also had longer invest-
ment horizons and looked more closely at risk-adjusted
returns. The survey also found that 95% of respondents
see risk tolerance as playing a signicant or at least
moderate role in their investment decisions. Half of the
respondent cited performance concerns and particularly
a lack of transparency and diculty in assessing risks as
the main hindrance for sustainable investment.
Such survey results support the notion that, as long as
investment decisions are based overwhelmingly on risk
and return considerations, strategies to promote
The big picture
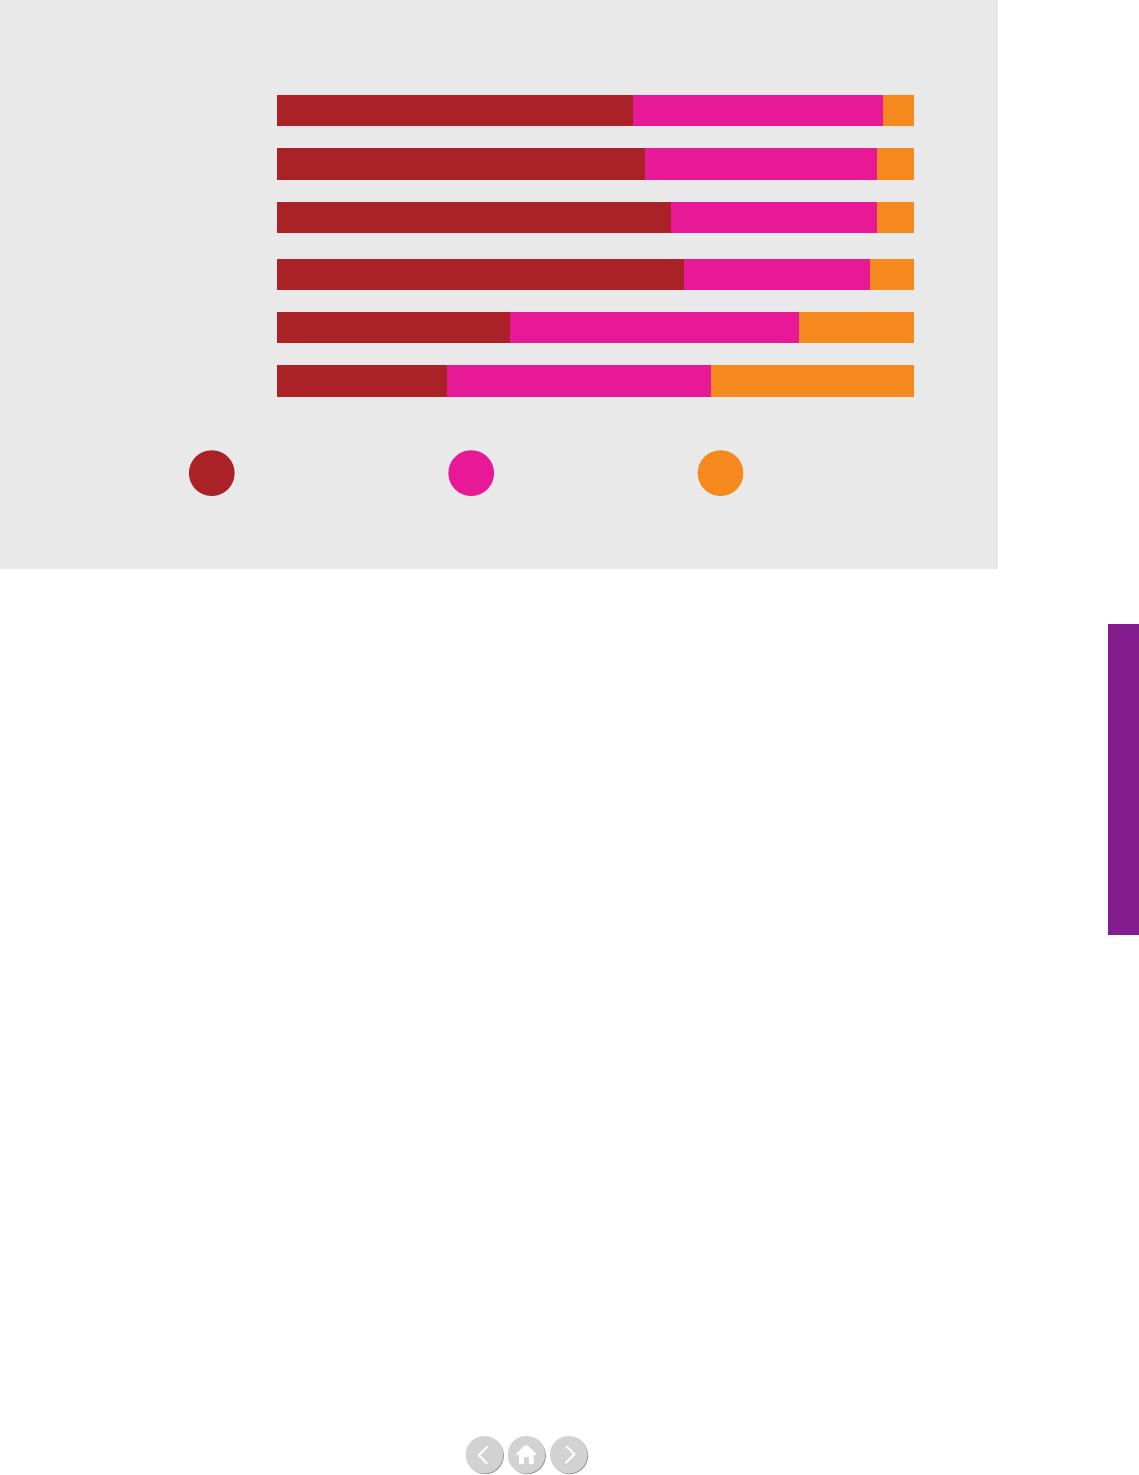
81
Figure 1: Investment decision survey
Risk tolerance
Anticipated return
Fund manager record
Strategic asset allocation
Time horizon
Sustainability focus
Significant influence Moderate influence Little to no influence
56% 39%
5%
58% 36%
6%
62% 32%
6%
64% 29% 7%
37% 45% 18%
27% 41% 32%
investment according to ESG criteria need to focus on
potentially positive risk-return considerations, rather
than solely on sustainability aspects.
Recent evidence suggest that this case can be made for
both risks and returns: studies have shown that investing
according to ESG criteria is largely positively correlated
with nancial performance.⁶ This has been particularly
the case in emerging market contexts⁷, where ESG
performance indicators are being used as predictors for
long-term value creation.⁸ There is, in fact, evidence
that investments in emerging markets in companies with
strong ESG performance signicantly outperform similar
investments with inferior ESG proles.⁹
We also need to do better in addressing concerns relating
to risk. While there is no evidence that investments in
sustainable development generally carry excess risk,
perceived risks are still acting as impediment to invest-
ment in sustainable development. Altering risk percep-
tions will thus be critical in changing investor behaviour.
It also needs to be stressed that ignoring ESG criteria
can be a risk in itself. Currently, negative ESG impacts
are not widely and adequately priced-in, particularly
for projects with a long-term horizon that face height-
ened risks relating to climate change. Investments in
fossil fuel industries, for instance, undermine long-term
prosperity and thus run counter to the objectives of
investors oriented towards the long term.
As the evidence points overwhelmingly to investment
in sustainable development as a win-win for investors
and sustainable development, there is a strong case to be
made for accelerated global action to promote an align-
ment of investment with sustainable development. This
has to include eorts to step up advocacy by investment
professionals themselves, normative frameworks as well
as concrete policy action. The sustainable investment
disclosure framework of European Union member
countries, agreed in March 2019, represents one recent
example of regulatory action geared to achieve this. The
framework regulates the integration of ESG risks and
opportunities in the due diligence process as well as the
need to price-in negative ESG impacts.
In light of the performance of sustainable investments,
some have argued that we are increasingly moving ‘from
a “why?” to a “why not?” moment in sustainable investing’.
10
So why don’t we let performances speak for themselves?
To achieve a broad-based transformation, investors that
have successfully invested in sustainable development,
need to make their voices heard and get new investors
on board.
The new kids on the block
In order to generate new investment ows into sustain-
able development, better promoting the business case for
investing in sustainable development will be a condicio
sine qua non. For dierent categories of investors, such
value propositions may vary. For institutional investors,
for instance, investment in sustainable development can
Source: Schroders Institutional Investor, ‘Institutional Investor Study 2018 Institutional perspectives on sustainable investing’,
(report, Schroder Investment Management Limited, 2018).
The big picture

82
help to match long-term liabilities with long-term
returns, while providing diversication and new sources
of returns in a low-yield environment.
Particularly investments in infrastructure can match
long-term liabilities, such as those faced by pension
funds, life insurance and sovereign wealth funds, with
long-term returns. Infrastructure investments also have
additional attractive attributes such as long-term stable
and predictable cash ows, low sensitivity to the ups and
downs of the business cycle, low correlation with equity
markets, some ination hedging and low default rates.
11
Despite these characteristics, infrastructure investments
still only represent a marginal share of institutional
investor's portfolios. It is estimated that no more than
2% of pension funds are currently invested in infra-
structure. In comparison, public pension funds currently
hold close to 6% of their assets in no- or low-yield cash
and cash equivalents.
12
There is thus signicant scope to further push for an
alignment of investments with sustainable development
particularly for investors whose investment horizons are
well aligned with sustainable investments. But why hasn’t
this happened yet, despite a strong business case?
Over the past years, there has been a trend towards short-
term investments, characterised by a falling holding period
of stocks as well as signicant holdings in liquid assets,
including listed equities, bonds and cash equivalents. Large
holdings of cash and cash equivalents, in particular,
represent resources that sit idle. Such resources will not
pave the way to value, both in an investment and sustain-
able development sense. Instead, such resources need to
be put to work to pave actual roads and realise investments
that generate value for investors and sustainable develop-
ment alike. In the SDG era, cash is no longer king, but
cash is cost - a cost to investors and society.
The national level:
Where implementation meets investment
To pave the way towards new investment paradigms in
the SDG era, commensurate action is also required at the
country level.
It is most obvious at the national level that there is not
‘one’ investment gap: Investment needs vary signicant-
ly. Each country (and even region and city) has distinct
needs and priorities. The sources of nancing that need
to be tapped, depending on context, are as diverse as
investment needs of countries. To incentivise private
investment in concrete projects, value propositions need
to be developed.
There has been notable, yet varying, progress at the na-
tional level to achieve this, as countries are taking active
steps to facilitate investment in sustainable development.
Approaches focus on two priorities: fostering a more
supportive domestic enabling environment and putting
in place national nancing strategies and frameworks.
Creating an enabling domestic environment
As we have seen, risk considerations exert a particular
inuence on investors. Perceived and actual risks of
investments in sustainable development and thus the cost
of tapping private resources is inextricably linked
to the domestic environment. If it is perceived as
‘high-risk’, cost of nance is likely high. To improve
enabling domestic environments, countries are actively
implementing a record number of reforms.
13
This has
included actions to strengthen regulatory and institu-
tional frameworks. Countries have also taken steps to
build more inclusive nancial systems. However, despite
some progress, success of these measures has been
uneven. There is thus a strong case to support capacity
development, particularly for countries at risk of being
left behind.
Actions to improve the domestic enabling environment
benet domestic and foreign investors alike. It can
contribute to the mobilisation of domestic private
resources, including by providing incentives that may
reduce capital outows – particularly from developing
countries into low-yielding assets in developed countries.
To achieve this, there is also the need to build capacity
and strengthen national capital markets to more eec-
tively mobilise domestic investors for national sustain-
able development. Infrastructure is one of the sectors
that may benet from this, not just in developing but in
developed countries as well, where domestic investment
in infrastructure remains limited.
14
Many countries have also been implementing dedicated
policies to attract increased ows in Foreign Direct In-
vestment (FDI). Developing countries have been able to
attract signicant FDI inows over the past decades.
A milestone was reached in 2014, when – for the
rst time – FDI inows into developing countries
outpaced ows into developed countries, as Figure 2 on
the next page highlights.
While FDI continues to be a major external source of
nancing, current trends are suggesting plateauing
growth and even a slight decline in 2018.
15
Moreover,
there has been a trend, particularly in developing
countries, towards relative decline in the share of
growth-enhancing greeneld investment, ie investments
into new productive capacity, compared to cross-border
merger and acquisitions (M&A) activity, in which
existing assets change hands and for which development
The big picture
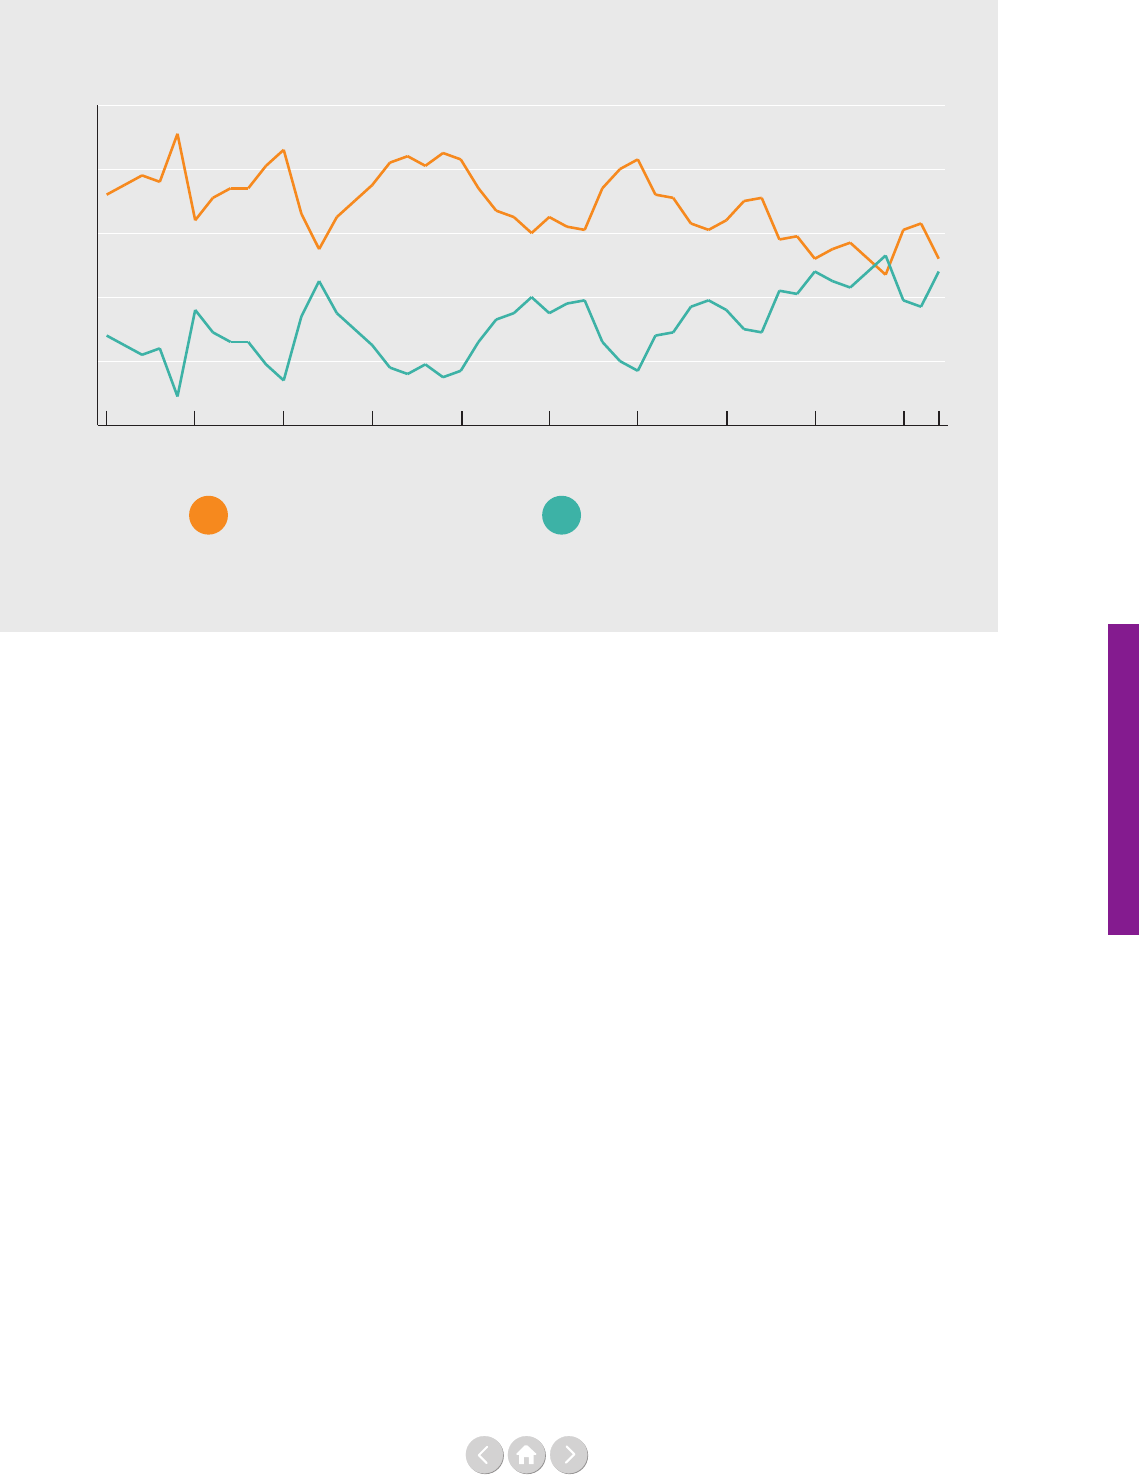
83
Figure 2: FDI Inflows into Developing and Developed Countries (as % of total)
Source: Author's calculations, United Nations Conference on Trade and Development (UNCTAD)
20%
40%
60%
80%
100%
Developed economies
Developing economies
20172015201020052000199519901985198019751970
impacts may be limited.
16
These recent trends suggest
that further action is needed to promote greeneld
investment aligned with sustainable development
objectives. Current trends suggest the opposite is
currently the case: primary resource extracting sectors
have seen growth in greeneld investment, while inows
in other sectors have declined.
17
Developing national financing strategies
This leads us to the nal frontier of our analysis. In order
to attract additional capital for investment into sustain-
able development, new project pipelines need to be
developed in which new capital can ow into. Pipelines
with investable projects need to be aligned with
integrated country-owned nancing frameworks.
While countries have taken strides in developing
national strategies for sustainable development in line
with the 2030 Agenda, many countries have not
elaborated comprehensive plans on how they can
be nanced. The Voluntary National Reviews at the
High-level Political Forum for Sustainable Development
represent an opportunity to highlight such national
nancing challenges and opportunities.
The past four years have highlighted that more support
is needed to align national development plans with
nancing frameworks and identify what needs to be
nanced and how. A critical rst step is identifying
nancing needs and opportunities within existing
national sustainable development plans. Such eorts
should go beyond identifying budgetary resources to
include the whole range of available sources of nancing,
depending on the respective context. Assessing risks and
reviewing progress on implementing national nancing
frameworks and their impact are a critical component of
this exercise.
Some countries are also undertaking action to address
impediments to national nancing frameworks. This
includes eorts to overcome the inherent short-termism
of political cycles, by putting in place medium-term
expenditure frameworks or medium-term revenue
strategies. Yet, in many instances, there is scope to
strengthen the alignment of such strategies with national
sustainable development plans and priorities.
The benets of implementing national nancing frame-
works can be manifold. It enables countries to enhance
coordination for sustainable development at the national
level and to identify nancing sources for national
development priorities. As part of their integrated
national nancing frameworks, countries can elaborate
specic nancing strategies which are aligned with long-
term priorities and prepare project pipelines of invest-
able projects that can provide concrete opportunities
for investment, including from the private sector, if it is
deemed a suitable nancing source.
The big picture

84
This is not an easy task, particularly for countries
facing capacity constraints. To elaborate concrete project
pipelines, national capacity needs to be strengthened
including in the structuring and negotiation process
of deals. Strong country ownership is thereby a neces-
sary precondition for successful implementation. The
elaboration of pipelines also carries a cost, including of
conducting pre-feasibility and feasibility studies, which
requires resources and capacities that may be unavailable,
particularly in Least Developed Countries (LDCs). Thus,
enhanced support is needed from international actors,
including international organisations and multilateral
development banks to overcome gaps in capacity.
Concrete actions taken by the UN
The UN can play a role in supporting action at all levels
of implementation on a majority of priority areas out-
lined in this article. The analysis in this article supports
the notion that the role of the UN should be interpreted
as a match maker and knowledge broker, rather than as a
gap ller.
The repositioning of the United Nations development
system (UNDS) represents an important step in strength-
ening this role at the country level.
18
The reorganisation
of the UN country teams, in particular, will open new
avenues for the provision of more targeted and strategic
support to Member States, including through the
redesigned resident coordinator oces. Going forward,
UN country teams will step up their support to realign,
mobilise and leverage nancing for sustainable develop-
ment, building on the strengthened nancing capacity of
resident coordinator oces, which will be staed with a
dedicated nancing and partnerships expert as well as an
economist.
The repositioning of the UN development system will
allow the system to accelerate eorts to nance the 2030
Agenda, strengthening capacity and supporting countries
to design and leverage investments into sustainable
development. The Financing for Sustainable Develop-
ment Oce of the UN Department of Economic and
Social Aairs (UNDESA) is well positioned to help
country teams and to support governments in mobilising
such investment into sustainable development.
The AAAA provides the overarching framework for
eorts taken by the UN on the nancing of sustainable
development. A recent initiative to accelerate resource
mobilisation on the path to 2030, aligned with the Addis
Agenda, is the Secretary-General’s Strategy for Financing
the 2030 Agenda for Sustainable Development
(2018–2021).
19
The strategy proposes concrete actions
to better align global economic policies and nancial
systems with the 2030 Agenda and enhance sustainable
nancing strategies at the regional and country levels.
The Financing for Sustainable Development Report
(FSDR) of the Inter-agency Task Force is providing
thought leadership through its analytical work and
reporting. In its 2019 edition, the FSDR provides
analytical guidance and policy recommendations on
integrated national nancing frameworks, which can
act as a tool for resource mobilisation and for a better
alignment of nancing with sustainable development
strategies.
20
The FSDR also acts as the major substantive input to the
Economic and Social Council (ECOSOC) Forum on
Financing for Development follow-up (FfD Forum),
which is the intergovernmental platform to assess
progress in all seven action areas of the AAAA.
A recent initiative to more eectively mobilise long-
term investors for sustainable development is the SDG
Investment (SDGI) Fair, which is held concurrently with
the FfD Forum. The SDGI Fair builds on the convening
power of the UN to bring together governments and
investment professionals to facilitate the matching of
investable projects with investors. The 2019 SDGI Fair
also marked the announcement of the establishment of
a Global Investors for Sustainable Development (GISD)
Alliance of global CEOs, convened by the UN
Secretary-General, which engages thought-leaders to
share their experiences in investing in sustainable
development in order to shift mind-sets in the wider
investment industry. The GISD Alliance is not only a
channel for advocacy on sustainable investment, but also
acts as catalyst for the scaling up of sustainable invest-
ment strategies.
Conclusion
At the heart of a new narrative for investment for sustain-
able development needs to be the notion that ‘closing
the investment gap’ should not be seen as a fundraiser,
in which a pledging goal needs to be fullled, but rather
as an exercise of matching investment demands with
appropriate strategies and nancing sources. In this vein,
new narratives on investment should move beyond
traditional notions of supply and demand for capital.
Ideally, investment in the SDG era should entail match-
ing demand and demand, ie demand for investment with
demand for investment opportunities.
Mobilising resources that sit idle, such as those ‘parked’
in cash instruments, represent one low hanging fruit that
is ripe to be picked and steered towards generating value
for investors and sustainable development. After all – and
this holds for investors and societies alike – investing in
sustainable development is an invaluable value proposition.
The big picture

85
Footnotes
¹ Inter-agency Task Force on Financing for Development,
‘2019 Financing for Sustainable Development Report’,
(report, United Nations, 4 April 2019).
https://developmentfinance.un.org/fsdr2019
² Dalberg Advisors, ‘Walking the talk: how businesses and
investors can convert Sustainable Development goals funding
gaps in Africa into $2trn of new markets’.
(briefing note, Dalberg Advisors, 22 March 2018).
https://www.dalberg.com/our-ideas/walking-talk, retrieved on
12 March 2019.
³ Business & Sustainable Development Commission,
‘Better Business, Better World’, (report, Business & Sustainable
Development Commission, January 2017).
http://report.businesscommission.org/report
⁴ Financial Times, ‘What is sustainable investing, anyway?’,
(news article, Financial Times, 2 March 2015).
https://www.ftadviser.com/2015/03/02/investments/equities/
what-is-sustainable-investing-anyway-4JclDMeUDw9DHrk-
JZxKQiN/article.html
⁵ Schroders Institutional Investor, ‘Institutional Investor Study
2018 Institutional perspectives on sustainable investing’,
(report, Schroder Investment Management Limited, 2018).
https://www.schroders.com/en/sysglobalassets/schroders_
institutional_investor_study_sustainability_report_2018.pdf ,
retrieved on 8 March 2019.
⁶ Gunnar Friede, Timo Busch & Alexander Bassen,
‘ESG and financial performance: aggregated evidence from
more than 2000 empirical studies’, (academic article, Journal of
Sustainable Finance & Investment, 15 Dec 2015).
https://doi.org/10.1080/20430795.2015.1118917
⁷ see for instance BlackRock Investment Institute, ‘Global
Insights: Sustainable investing: a “why not” moment’,
(report, BlackRock, 9 May 2018).
https://www.blackrock.com/us/individual/insights/black-
rock-investment-institute/sustainable-investing-is-the-answer ,
retrieved on 5 March 2019.
⁸ Morgan Stanley Emerging Markets Team,
‘An Emerging Markets Approach to ESG’, (report, Morgan
Stanley Investment Management, January 2018).
https://www.morganstanley.com/im/publication/insights/
macro-insights/mi_emergingmarketsapproachtoesg_en.pdf,
retrieved on 3 August 2019.
⁹ see MSCI Emerging Markets ESG Leaders Index.
https://www.msci.com/documents/10199/c341baf6-e515-
4015-af5e-c1d864cae53e, retrieved on 5 March 2019.
10
Report, BlackRock, 9 May 2018. See Footnote 7.
11
Aleksandar. Andonov, Roman Kräussl, and Joshua Rauh,
‘The Subsidy to Infrastructure as an Asset Class’,
Center for Financial Studies (CFS) Working Paper Series,
(paper series, Goethe University, September 2018).
12
State Street Global Advisors, ‘How do Public Pension Funds
invest? From Local to Global Assets’, (paper, State Street
Corporation, 2018), retrieved on 3 October 2019.
https://www.ssga.com/investment-topics/asset-alloca-
tion/2018/inst-how-do-ppfs-invest.pdf
13
2019 Financing for Sustainable Development Report.
See Footnote 1.
14
See for instance the case of infrastructure in the UK in
Financial Times, ‘Government to aid infrastructure investing by
pension schemes’, (article, Financial Times, 18 October 2018).
https://www.ft.com/content/75a0812c-d2d4-11e8-a9f2-
7574db66bcd5
15
2019 Financing for Sustainable Development Report.
See Footnote 1.
16
Harms, Philipp & Méon, Pierre-Guillaume,
‘An FDI is an FDI is an FDI? The growth effects of greenfield
investment and mergers and acquisitions in developing
countries,’ Proceedings of the German Development
Economics Conference, (conference proceedings, German
Development Economics Conference, 2011).
https://econpapers.repec.org/paper/zbwgdec11/38.htm
17
United Nations Conference on Trade and Development
(UNCTAD) , ‘World Investment Report 2018 - Investment
and New Industrial Policies’,
(report, United Nations, 6 June 2018).
https://unctad.org/en/PublicationsLibrary/wir2018_en.pdf
18
United Nations Secretary-General, ‘Repositioning the
United Nations development system to deliver on the
2030 Agenda: our promise for dignity, prosperity and peace
on a healthy planet’, (Report of the Secretary-General,
A/72/684–E/2018/7, United Nations General Assembly
Economic and Social Council, 21 December 2017).
https://undocs.org/A/72/684
19
United Nations Secretary-General, ‘Secretary-General’s
Strategy for Financing The 2030 Agenda for Sustainable
Development (2018–2021)’,
(strategy document, United Nations, September 2018).
https://www.un.org/sustainabledevelopment/wp-content/up-
loads/2018/09/SG-Financing-Strategy_Sep2018.pdf
20
2019 Financing for Sustainable Development Report.
See Footnote 1.
The big picture

86
Driving development finance to the ground:
Closing the investment gap
By E. Courtenay Rattray
Ambassador E. Courtenay Rattray is the Permanent
Representative of Jamaica to the United Nations,
a post to which he was appointed on 1st June 2013.
Prior to this appointment, he served as Jamaica’s
Ambassador to the People’s Republic of China,
from December 2008 until May 2013. Ambassador
E. Courtenay Rattray has chaired several UN inter-
governmental negotiating processes and high-level
meetings, including on nancing for sustainable
development, implementation of the Sustainable
Development Goals (SDGs) and the reform of the
UN Security Council. He is the Co-chair of the
Group of Friends of Sustainable Development
Goal (SDG) Financing in New York, as well as the
current Chair of the Commission on Population
and Development, ECOSOC.
The spectre of devastating global climate change dark-
ens the prospects for development in both industrial
and developing countries. The global climate system has
already entered dangerous territory, with the impacts
of man-made emissions increasing the probability of
extreme weather events and irreversible damage to the
global environment. During 2018, deaths from extreme
weather events exceeded 5,000 people and more than
28 million required emergency or humanitarian aid.
Munich Re, a global leader in the reinsurance sector,
estimates that disasters, including tornadoes, hurricanes,
wildres, tsunamis, earthquakes and droughts, cost the
global economy approximately US$ 160 billion last year.
Looking forward, one thousand experts surveyed by
the World Economic Forum for its 2018 Global Risk
Report indicated that extreme weather events were the
most likely threat to disrupt the global economy over
the next decade, representing a greater danger than
weapons of mass destruction, cyber-attacks, or data fraud
and theft. ‘Extreme weather events were ranked again as
a top global risk by likelihood and impact’, according to
Alison Martin, Group Chief Risk Ocer of the Zurich
Insurance Group.
The Intergovernmental Panel on Climate Change has
concluded that the world has just 12 more years to
prevent the irreversible damage that would be caused by
a human-induced collapse of the climate system. In the
face of these imminent and dire threats, it is the role and
responsibility of the UN system to join with Member
States on a path that can lead to stable, balanced, and
sustainable development.
The challenge before us
There is no terrible and evil force threatening us with
global climate change. The sources of the risks lie in eco-
nomically important activities in all UN Member States.
And the impacts will be felt in all countries. But the
challenge before us today is even more complicated than
that posed by the threat of future climate change alone.
Several factors add complexity to the challenge. The UN
Population Fund (UNFPA) estimates that, if current
trends continue, the world’s population will increase by
2 billion people by the year 2050. Most of these new
members of our human family will arrive in urban areas
of Africa and in East and South Asia, where the infra-
structure needed to meet their basic human needs is not
currently in place.
Unless a major eort is begun immediately, the real
assets needed to provide energy, water, food security and
mobility will not be sucient to meet future demand.
This shortfall, combined with the projected impacts of
climate change in these regions, is likely to increase dra-
matically the number of cross-border migrants and inter-
nally displaced persons throughout the aected areas.
Irrespective of future eorts to limit greenhouse gas
emissions, the impacts of climate change that are already
‘in the pipeline’ due to past emissions will make the
challenge of sustainable development more dicult for
all, necessitating a growing public emphasis on adapta-
tion and eorts to enhance resilience.
The path to stable,
balanced and sustainable development
Despite these challenges, the future is not necessarily
grim. The UN’s Agenda 2030, the Sustainable Develop-
The big picture

87
ment Goals (SDGs), and the Paris climate agreement
illuminate a path to stable, balanced, and sustainable
development through which no one will be left behind.
Following this path will create hundreds of millions of
decent jobs; advance national development strategies;
protect the global environment; and enrich the patrimony
that we leave to our children. And it will do all of this
while reducing the risks of war and conict.
Achieving the objectives of the 2030 Agenda and its
associated SDGs while achieving the targets of the Paris
climate agreement will require a massive, global
programme of investment in real assets and sustainable
infrastructure to meet the needs of our entire human
family. However, the capital requirements of such a
programme vastly outweigh the public capital resources
available today, or in the foreseeable future.
Making the necessary investments will require establish-
ing new partnerships between the public and private
sectors. The only resources sucient to meet the
challenges ahead at the speed and scale with which the
risks are growing are those managed by institutional
investors, ie, the guardians of the global savings pool. But
these institutional investors, viz pension funds, insurance
companies, asset managers and sovereign wealth funds
are necessarily conservative and risk averse: their du-
ciary obligations often prohibit the application of these
funds in situations that might put their principal capital
at risk. For them to join with governments and interna-
tional nancial institutions in the battle for sustainable
development will require that we create investable prop-
ositions that are equitable, cost-eective and capital-
ecient. And these investments must earn a return on
capital deployed that is commensurate to the assessed
risk, while ensuring that the public good is advanced.
A growing investment gap
arises from a continuing market failure
Today’s reality is stark and scary: the gap between current
rates of investment in infrastructure and the level needed
to meet projected demand during the next thirty years
is estimated, by some measures, to be US$ 5-7 trillion
per year. Yet, as the need for investment in climate and
sustainable development solutions becomes increasingly
urgent, we face a collective market failure where ‘buyers’
and ‘sellers’ of capital cannot nd each other.
Many developing countries have high-priority, environ-
mentally-sound, sustainable infrastructure projects that
are critical to the success of their national development
strategies, but they cannot nd adequate capital for
these investments. At the same time, investors, especially
institutional investors, who are seeking good opportuni-
ties to put capital to work, cannot nd credit-worthy or
‘bankable projects’ that can ensure sucient operating
cash ows to generate a reliable and adequate return on
investment.
How can the UN, its Member States, international
nancial institutions, and the private sector bridge this
yawning nancing gap, while mitigating catastrophic
climate change and adapting to the overwhelming risks
that such climate change will unleash on real assets across
the full breadth of the global economy?
Closing the investment gap
in sustainable infrastructure
To address these interlinked challenges, in a cooperative
manner, we must create a mechanism to stimulate co-
investment by private sector investors, working alongside
governments, multilateral development banks (MDBs),
national development banks (NDBs), and other inter-
national nancial institutions. Such a mechanism must
be designed to catalyse new coalitions of co-investors
that will seize the opportunity to invest in real assets in
developing countries. Early investors whose mandates
and risk-return appetites allow them to do so could take
short-term or even rst loss positions in the develop-
ment and construction stages of infrastructure projects,
secure in the knowledge that institutional investors are
prepared to step in with long-term, ‘takeout’ nancing
for these projects, once they are operational and can
provide a reliable revenue stream.
Getting to this position will likely require changing the
operational style of many MDBs and NDBs. Inter-
national nancial institutions must nd a way to shift
their annual disbursements of capital away from direct
lending to sovereigns and increasingly toward the provi-
sion of assurances, guarantees and other fee-for-service
credit enhancements that raise the condence of private
investors. They should also make a higher proportion of
their capital available as direct or even indirect equity
investments, as opposed to concessional or non-
concessional debt nancing. This will have a greater
development impact by allowing them to engage more
deeply in developing countries and emerging markets,
while reducing the debt burdens and contingent liabil-
ities constraining most developing country economies.
And, because of the widespread scarcity of domestic
public resources, all of this must be accomplished in a
way that enables developing countries to deploy the
absolute minimum amount of public capital in each
project nancing structure.
The Closing the Investment Gap Initiative (the CIG
Initiative) provides such a mechanism. It creates a UN-
aligned investment platform that brings together public
investment project pipelines and private investors, with
the goal of creating favourable conditions for accelerat-
ing investments into new sustainable infrastructure assets
The big picture
88
in developing countries. The UN Group of Friends of
SDG Financing, co-chaired by the Ambassadors to the
UN of Jamaica and Canada, in tandem with the Govern-
ment of Denmark and the University of Maryland,
is collaborating on the CIG Initiative to advance invest-
ment projects within the sustainable infrastructure/
renewable energy sectors of developing countries.
The CIG Initiative has developed a robust, practical
platform of private sector engagement. It has also
established a targeted capacity-building process that
strengthens the ability of developing countries to transi-
tion from funding key projects solely with domestic
resources, commercial loans, grants, Ocial Develop-
ment Assistance (ODA) and concessional nance, to
being able to nance their projects through cost-
eective, capital-ecient partnerships with private
investors. Through this initiative, public and private
sector participants engage and learn together via invita-
tion-only workshops and retreats.
On the one-hand, capacity building in the CIG Initiative
focuses on helping developing countries to learn the
dynamics of the private nancial sector, in order to help
them better understand how private sector nance lead-
ers analyse and assess investment options. On the other
hand, senior leaders in the private nancial services
sector, who engage as mentors and guides to the develop-
ing country investment teams, gain a better understand-
ing of the actual risks and potential rewards of expanding
investment into developing country markets. This
heightened understanding helps participants to break
through the stereotypes and outdated perceptions that
exist among many private investors, which have slowed
the pace of long-term, productive, sustainable develop-
ment investments in developing country markets.
The CIG Initiative is preparing to take three of the
developing country teams that participated during its
2018 ‘proof of concept’ phase on a series of investor
consultations to meet with investors in major nancial
centres. It is anticipated that at least two of these rst
three countries will have reached a rst nancial com-
mitment in time to present their portfolios at the UN
Secretary-General’s 2019 Climate Summit (New York,
September 2019).
Country teams select
high-priority projects
that meet CIG criteria
(deal size, stage
of development,
contribution to
sustainable
development)
CIG team works with
country teams to
structure projects
and develop
presentations on
projects
CIG organises
workshops to facilitate
2-way capacity
building and
relationship building
between country
teams and interested
investors
Country teams receive
iterative constructive
criticism on their
portfolios through
the series of
workshops
Figure 1: The CIG Initiative
The big picture
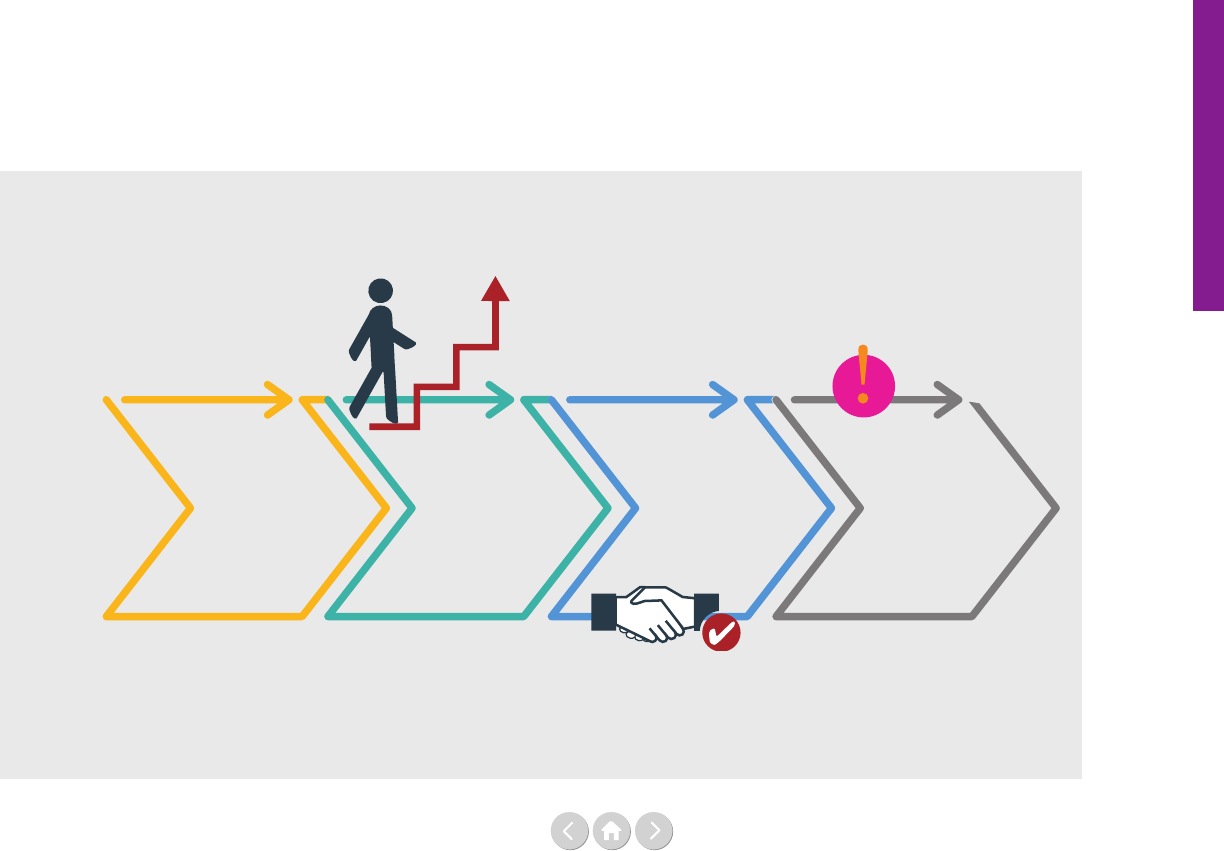
89
While getting three countries to a rst nancial commit-
ment and advancing their high-priority projects is an
exciting outcome, it is not nearly enough. Once success-
fully demonstrated, this model must be replicated and
expanded over time to many more developing countries.
In this way, developing country participants will gain the
capacity to forge cost-eective, capital-ecient partner-
ships around high-priority sustainable infrastructure
projects. The projects must be secure, robust, and large
enough to achieve liquidity in the secondary global
bond market. Only by rapidly expanding and scaling-up
investments in sustainable infrastructure projects to
developing countries, especially those most vulnerable
to the projected eects of climate change, can we hope
to meet the challenges ahead at the speed and scale at
which they are approaching.
CIG works with
country teams in
between workshops
to develop
portfolio
presentations
Country teams come
out of the process
with pitch decks,
robust term sheets
and financial models,
and relationships
with investors
The ultimate goal of
CIG is to facilitate
deals on selected
projects between
participating country
teams and private
investors
Projects are
structured so that they
are able to be refinanced
and taken up by
investors looking for
high-grade, fixed
income, highly liquid
investments, after the
construction phase.
The Big Picture

90
Bye-bye, billions to trillions
By John W. McArthur
John W. McArthur is a Senior Fellow with the
Brookings Institution’s Global Economy and
Development Program. He is also a Senior Advisor
on sustainable development to the UN Foundation
and a Board Governor of the International
Development Research Centre. He formerly
managed the UN Millennium Project, the advisory
body to Secretary-General Ko Annan, and served
as Chief Executive Ocer of Millennium Promise,
the international non-governmental organisation.
Previously he co-authored the Global
Competitiveness Report; co-chaired the
International Commission on Education for
Sustainable Development Practice; co-founded the
global network of Master’s in Development
Practice degree programs; and chaired Global
Agenda Councils for the World Economic Forum.
If trying to grow a plant in the Sahara, it is no help to
track the world’s total rainfall. Likewise, investing to
protect a Caribbean farm from a hurricane has little
bearing on a Pacic island’s resilience to typhoons.
For most people, the intuition is clear. International
precipitation aggregates are simply not meaningful for
specic places and communities grappling with too little
rain, too much rain or the wrong type of rain.
Unfortunately, an equivalent mismatch between global
sums and local problems tends to persist in many conver-
sations about nancing the Sustainable Development
Goals (SDGs). This is amplied by the ‘billions to
trillions’ (B2T) mantra, typically linked to a call for
multi-trillion dollar SDG investment increases, especially
from the private sector. But such large-scale assertions
misrepresent both the composition and scale of the
global SDG nancing challenge. Too often, they amount
to measuring one region’s ood as if it were a solution
to another region’s drought. It is time to drop the global
B2T rhyme, and refocus on the underlying reasons why
SDG nancing is required.
Some context
In fairness, the B2T frame was originally put forward
with many good intentions. In the lead-up to the 2015
adoption of the SDGs, some people wanted to widen
the aperture of policy debates, in light of the SDGs’
dramatic expansion of sectoral scope and geographic
scale, compared to the predecessor Millennium Develop-
ment Goals.¹ Others drew attention to the multi-trillion
dollar annual investment requirement needed to tackle
the SDG infrastructure challenge.² The international
nancial institutions wanted to make the case for
reforming nancing vehicles to leverage the world’s
enormous private capital markets.³
An emphasis on trillions also aligns with the scale of
the world economy, which has grown so large that it
can be dicult to get one’s mind around the absolute
magnitudes involved. Today, gross world income is
approximately US$ 80 trillion per year, having more
than doubled in nominal terms over the past two
decades. When adjusted to account for diering price
levels around the world, the corresponding gure is
roughly US$ 130 trillion in purchasing power parity
terms, having more than tripled in scale over the same
period. Around 40 to 50% of the overall growth has been
driven by Asia, depending on the underlying metrics used.
Against that backdrop, total current SDG-focused public
expenditures around the world – not even counting
private expenditures – are already around US$ 20 trillion
per year. That number comes from a study I recently
published with my colleague Homi Kharas, in which we
estimated every country’s government spending on health,
education, infrastructure, agriculture, social protection,
biodiversity conservation, and access to justice as of 2015,
as a broad if incomplete cross-section of SDG spending
domains.⁴ Because government expenditures tend to track
growth in the overall economy, we further estimate the
corresponding gure as on course to reach around
US$ 30 trillion by 2030. In other words, if the normal
trends of global economic growth continue out to 2030,
SDG government spending will grow on its own, in
constant dollar terms, by roughly US$ 10 trillion per year.
The big picture

91
This is much more than the US$ 2-7 trillion dollars of
‘needed incremental investment’ often cited in the SDG
context.
The issue, of course, is that adding US$ 10 trillion of
SDG public spending tells us nothing about which
resources will be allocated to which purposes in which
places, and hence nothing about whether or not they
will help any countries achieve specic SDG outcomes.
This underlines the fatal aw of the B2T narrative.
By directing attention to the multi-trillion dollar
aggregates required for the SDGs, the conversation often
amounts to a focus on how to create the tallest possible
stack of SDG dollars, regardless of their type or purpose.
This is about as clever as adding up total global precipi-
tation ows to gure out whether every community has
the right amount of rain. It ignores, and too often over-
shadows, the particular mixes of resources required
– including public resources essential for supporting
people being most profoundly left behind.
To illustrate the problem further, consider two extreme
cases. At one end of the spectrum, global SDG spending
growth of US$ 10 trillion per year tells us nothing about
whether public health nancing is adequate in Chad or
the Central African Republic. These countries have two
of the world’s highest child mortality rates as of 2017
and hence the furthest to go to achieve the relevant
SDG target for child survival. According to the World
Bank, Central African Republic’s total health spending
was only US$ 16 per person per year in 2016, with only
US$ 2 of that coming from the domestic government.
Chad’s health spending added up to only US$ 32 per
capita the same year, with only US$ 6 of that from the
domestic government. Both of these are well short of the
US$ 57 per capita public health expenditure recently
estimated as an absolute minimum for achieving the
SDGs in the poorest countries.⁵
At the other end of the spectrum, achieving SDG health
targets in a country like the United States is not a matter
of spending more money. Total American health spend-
ing is already the highest in the world at approximately
US$ 10,000 per person per year, roughly half of which
is covered by the public sector. At the same time, average
American life expectancy has recently been declining
and more than a third of the country’s adults are
grappling with obesity. These are not ‘more money’
problems. Solving them requires targeted and out-
come-based budgeting across the health system,
improved access to relevant services for those who
cannot aord them, and more innovative approaches to
promoting wellbeing, with active leadership from both
public and private sectors.
Three big SDG financing problems
Given the scale and complexity of the world economy,
it is always dangerous to risk oversimplifying the task at
hand. But a universal SDG agenda does not imply a
single universal nancing answer. In saying goodbye to the
B2T narrative, the world needs to dierentiate among at
least three distinct types of SDG nancing challenges.
First, the poorest countries need adequate support to
tackle extreme poverty-related issues of survival and
basic needs. In the UN’s 2015 Addis Ababa Action
Agenda on sustainable development nancing, paragraph
12 commits to ‘a new social compact’ delivering social
protection and essential public services for all. A focus
on global trillions obscures the fact that a few dozen
low-income countries still face the greatest resource
constraints alongside the most severe consequences of
funding shortfalls, often measured in life-and-death
terms. Homi Kharas and I estimate that the minimum
package of public services costs perhaps US$ 300 per
person per year in the poorest countries, where price
levels are generally lowest.
Ocial Development Assistance remains crucial for
delivering the promised social compact in low-income
environments. For example, a US$ 5 billion annual fund-
ing shortfall for the Global Fund to Fight AIDS, TB, and
Malaria would represent less than one one-thousandth
of the natural global growth in SDG public spending by
2030, but the specic gap would likely result in millions
of lives lost. Similarly, a persistent global education
investment gap on the order of US$ 15-25 billion per
year in developing countries will be of enormous long-
term consequence as the world welcomes its largest ever
generation of young people. The most important SDG
nancing problems are often still dened on a scale of
billions of dollars needed and millions of lives at risk.
Second, the richest countries need to focus on ensuring
universal access, promoting targeted innovations,
advancing outcome-based budgeting, and leading by
example in protecting natural assets – rather than blindly
spending more. This is not meant to suggest that every
high-income country’s national budgets are fully
adequate to the SDGs. It is meant to suggest that
governments have unique responsibility to ensure their
own public resources are targeted to ensuring no one is
left behind, such as through social protection programmes
to cut domestic poverty by half (SDG target 1.2).
Governments also have a special responsibility to protect
the environment, ranging from common resources of
the atmosphere to the vast depths of the high seas that
lie beyond any current jurisdiction. On many challenges,
governments need to nd ways to crowd in private
sector action too. The global obesity epidemic, for
The big picture

92
example, is aecting all countries, and scaled solutions
will only be found through outcome-focused learning
and collaboration across government, business, academia,
and civil society.
Third, emerging economies need to tackle their own
respective combinations of the aforementioned
‘low-income problems’ and ‘high-income problems’,
while also building the environmentally sustainable
infrastructure required to support rapid economic
change. They all need to build the urban, transport,
energy and telecommunications infrastructure that will
support unprecedented growth of cities and improved
living standards while dramatically lessening the human
footprint on the natural environment. Importantly, mid-
dle-income countries as a group have a balanced current
account, so their central challenge will be to mobil-
ise the right combination of domestic resources, both
public and private, for SDG-consistent action, rather
than external resources. But even then the issues are still
country-specic; some will need outside investment too.
The microclimates of SDG finance
Ultimately, the SDGs draw attention to specic prob-
lems, in specic places, faced by specic people. The
scale of resource requirements is vast because the scale
of the global economy is vast. But the world’s economic
complexity and dynamism should not distract from the
distinct practical challenges embedded within the SDGs.
It is time to say bye-bye to ‘billions to trillions’ and
instead focus on the component SDG nancing
problems. Success requires much more than a simplistic
downpour of resources. It needs the right amounts,
of the right types, in the right places.
Footnotes
¹Arakawa, Hirohito, Sasja Beslik, Martin Dahinden, Michael
Elliott, Helene Gayle, Thierry Geiger, Torgny Holmgren,
Charles Kenny, Betty Maina, Simon Maxwell, John W McArthur,
Mthuli Ncube, Ory Okolloh, Zainab Salbi, Mark Suzman,
and Jasmine Whitbread, ‘Paying for Zero: Global Development
Finance and the post-2015 Agenda’,
(report, World Economic Forum, 2014)
Guido Schmidt-Traub, ‘Investment needs to achieve the
Sustainable Development Goals: Understanding the billions and
trillions’, (working paper, Sustainable Development Solutions
Network, 2015).
² ‘World Investment Report 2014 – Investing in the SDGs:
An Action Plan’, (report, UNCTAD, 2014).
³ ‘From Billions to Trillions: Transforming Development
Finance’, (Development Committee Discussion Note, African
Development Bank, Asian Development Bank, European Bank
for Reconstruction and Development, European Investment
Bank, Inter-American Development Bank, International
Monetary Fund and World Bank Group, 2015).
⁴ Homi Kharas and John W McArthur, ‘Building the SDG
economy: Needs, spending and nancing for universal
achievement of the Sustainable Development Goals.’,
(working paper, Brookings Global Economy and Development
Working Paper, 2019).
⁵ Karin Stenberg, Odd Hanssen, Tessa Tan-Torres Edejer,
Melanie Bertram, Callum Brindley, Andreia Meshreky,
‘Financing transformative health systems towards achievement
of the health Sustainable Development Goals: a model for
projected resource needs in 67 low-income and middle-
income countries’, The Lancet Global Health, Volume 5,
Issue 9, (2017), Pe875-e887.
The big picture

93
Pedro Conceição is Director of the Human Develop-
ment Report Oce, United Nations Development
Programme (UNDP). Prior to that, he was
Director, Strategic Policy, at the Bureau for Policy
and Programme Support of UNDP. His previous
roles at UNDP include Chief-Economist at the
Regional Bureau for Africa and Director of the
Oce of Development Studies. He has co-edited
books on nancing for development and on global
public goods. He has published on inequality, the
economics of innovation and technical change, and
development. Prior to joining UNDP, he was an
Assistant Professor at the Instituto Superior Técnico,
Technical University of Lisbon, Portugal where he
taught and researched on science, technology, and
innovation policy. Pedro Conceição has degrees in
Physics from Instituto Superior Técnico in
Economics from the Technical University of Lisbon,
and a PhD in Public Policy from the Lyndon B.
Johnson School of Public Aairs at the University
of Texas at Austin, where he studied on a Fulbright
scholarship.
Pedro Conceição is grateful for comments on his
contribution to this report from Hoi Wai Cheng,
Leonard Go, Xiao Huang, Marcelo Laeur,
Christina Lengfelder, Brian Lutz, George Gray Molina,
Shivani Nayyar, and Heriberto Tapia.
How does science and technology policy
shape inequality?
By Pedro Conceição
A long-held tenant of development policy is that eco-
nomic growth is of prime importance. Growth expands
incomes, and without a growing national income there
is little or nothing to redistribute. Without a growing
pie, the political and social dynamics would revert to a
zero-sum game and thus, an expanding income makes
it politically more feasible to redress inequality. Also,
growth drives poverty reduction, and that is the over-
riding objective of development – and of social policies
around the world.
Furthermore, some hold the view that inequality is
even needed for growth – or, to be more precise, for
economic eciency. After all, those that work hard, that
are talented, and that take risks in new ventures, need
to be rewarded. We could worry about equality, maybe
for ethical reasons, but that would have to happen at the
expense of eciency.
And then there is the question of whose business is it to
care about inequality? Isn’t it a domestic policy issue?
Dierent societies have dierent levels of tolerance for
inequality. Perhaps because they emphasise eciency,
either as a matter of values or because they need to grow
– otherwise they would be distributing poverty, not
income.
So, it is not surprising that, when the Millennium
Development Goals (MDGs) were put forward at the
turn from the 20th to the 21st century, there was no goal
explicitly addressing inequality. For a multilaterally
agreed compact to guide and mobilise development
cooperation, the priority surely had to fall on reducing
income poverty.
Yet, the MDGs were already a little behind the times
when they were adopted. Starting in the 1990s, there
was a sharp increase in interest in ‘global inequali-
ty’. Figure 1 on the next page uses the Ngram viewer
from Google to track the use of the expressions ‘global
growth’ and ‘global inequality’ in all digitally accessible
publications since 1950. It is clear that ‘global growth’
reigned supreme for most of the time, with ‘global
inequality’ only creeping up a little bit in the early 1990s,
but really taking o in the mid-1990s. So much so that,
just after the MDGs were adopted, ‘global inequality’
overtook ‘global growth’.
Further validation of the growing interest in inequali-
ty was provided by the surprise bestseller Capital in the
21st Century, by Thomas Piketty. Published originally
in French in 2013, the book is a weighty tome (though
engrossing for economists), with dozens of graphs and
tables documenting patterns of income and wealth
distribution going back to the 18th century. An English
translation was published a little less than a year after
The big picture
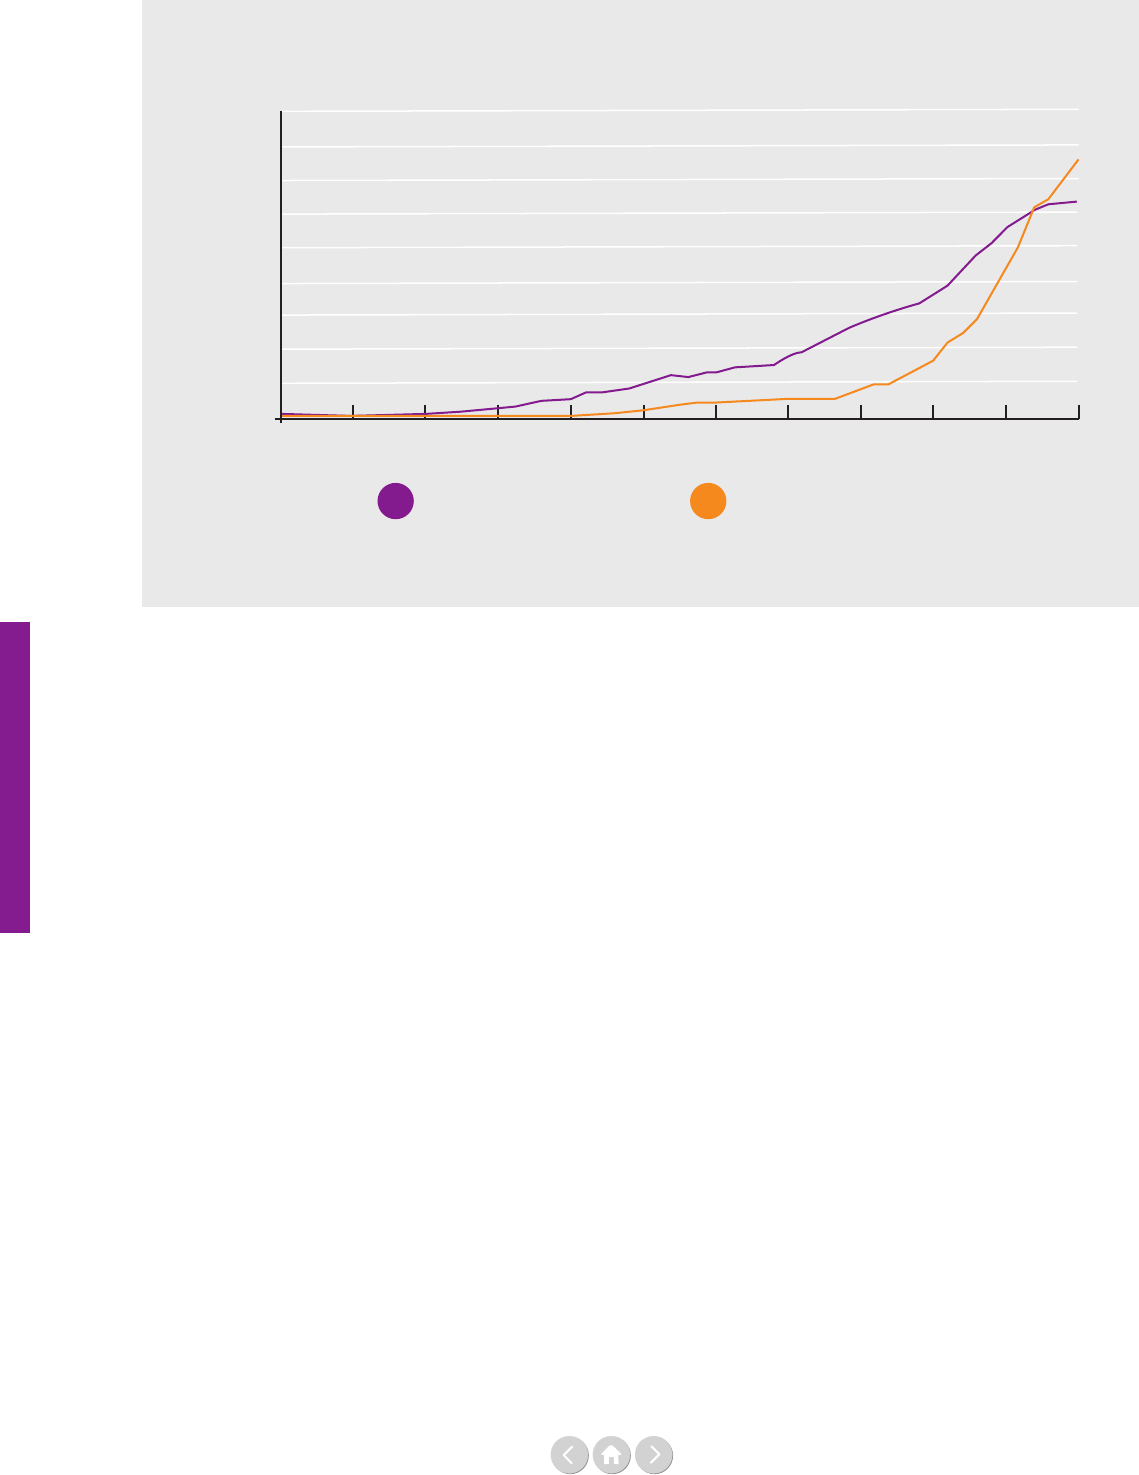
94
the original publication. From there, the book became a
publishing phenomenon in multiple countries.
Capturing the zeitgeist, the 2030 Agenda for Sustainable
Development included not only a specic Sustainable
Development Goal (SDG) on inequality (SDG 10) but
objectives to redress inequality permeate the whole
Agenda and several of the SDGs.
The question addressed in this essay is not: what hap-
pened? Rather, the essay takes as a given that concerns
with inequality represent a dening challenge of our
time, because people care and because inequality has
been enshrined in the 2030 Agenda and the SDGs. The
question to explore, rather, is what to do about it?
Redressing inequality
through the fiscal system
As with much of the discussion on achieving the 2030
Agenda, the immediate impulse is to look at nance.
Gaps are big, it is claimed. More needs to be mobilised,
therefore. Shift private nancing to SDG-aligned invest-
ments, in addition to the mobilisation of more public
resources for (national and global) public goods. All of
which are valid arguments. But how to address inequal-
ity? What is the gap to be lled? What are the changes
needed when it comes to private investment and what
kind of incentives are needed to achieve those changes?
Figure 1: Ngram Viewer: ‘Global inequality’ and ‘global growth’
Source: Google Ngram site, https://books.google.com/ngrams
1950
0.00000100%
Global inequalityGlobal growth
0.00000200%
0.00000300%
0.00000400%
0.00000500%
0.00000600%
0.00000700%
0.00000800%
0.00000900%
1955 1960 1965 1970 1975 1980 1985 1990 1995 2000 2005
Well, the most direct channel is to shift income from
those that have more to those that have less – using the
scal system, meaning, through taxes, transfers and the
provision of public health and education – that can have
a powerfully equalising eect, as the analysis of Nora
Lustig shows.¹ In fact, Thomas Piketty’s own theory can
be summarised by the famous formula: r>g, where r is
the rate of return on capital, and g is the economic
growth rate. The hypothesis states that, in the 21st cen-
tury, the owners of capital earn higher returns on the
wealth they already own than the rate at which
additional income (through economic growth) is
generated.² So economic growth is always failing to
catch up – wealth begets more wealth, at a higher pace
than the generation of income for the whole society, and
the inevitable consequence is growing inequality. The
obvious solution, therefore, is to tax wealth.
Whether one agrees with Piketty’s hypothesis or not
– and the debate continues in the literature – there is no
question that the scal system is a powerful instrument
for redressing inequality. In fact, it is already used around
the world to do just that. See Figure 2 that compares the
Gini coecient (a measure of inequality that runs from
zero, with perfect equality, to 1, where all the income is
accumulated at the top) for market income (before taxes
and transfers) and post-scal income (after taxes and
transfers). It shows that the Gini always goes down, in
many countries quite substantially.
The big picture
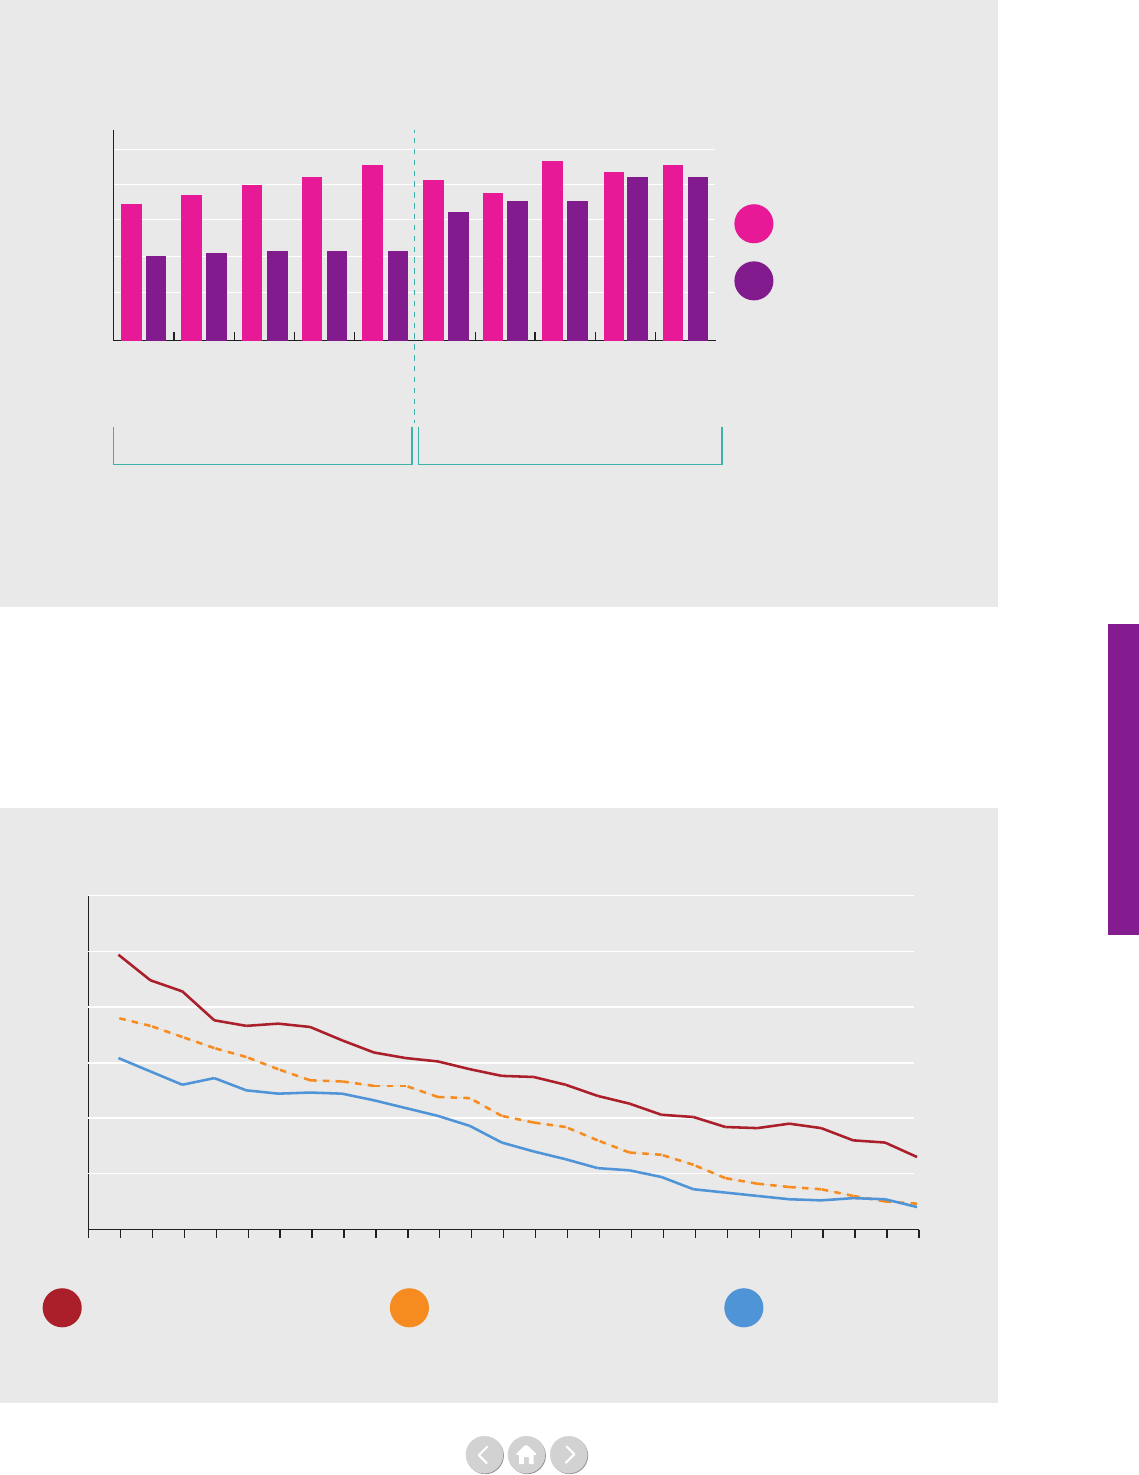
95
Figure 2: Differences in income inequality
pre- and post-tax and government transfers for selected countries, 2013
Figure 3: The evolution of statutory corporate income tax rates, 1990-2015
Iceland
Norway
Denmark
Sweden
Finland
Israel
Turkey
United States
Mexico
Chile
0.1
0.2
0.3
0.4
0.5
0.6
Before taxes and transfers
With lowest inequality With greatest inequality
After taxes and transfers
Gini coefficient
Source: Data from OECD (2019). ‘Gini, poverty, income, Methods and Concepts’, (database, OECD, 2019).
Source: Data from IMF (October, 2017). ‘Corporate Taxation in the Global Economy’, IMF Policy Papers, 19(007) (2019).
Further arguments to revert to the scal system to
redress inequality are linked to recent trends, around the
world, on decreasing corporate and high personal in-
come tax rates, as shown in Figures 3 and 4 - they show,
respectively, the evolution of statutory corporate income
tax rates and of top personal income tax rates - perhaps
a hint as to why there is growing concern with
inequality?
20%
30%
25%
35%
45%
40%
50%
Low-income developing countries
Emerging market economies
Advanced economies
2015
2014
2013
2012
2011
2010
2009
2008
2007
2006
2005
2004
2003
2002
2001
2000
1999
1998
1997
1996
1995
1994
1993
1991
1990
1992
The big picture
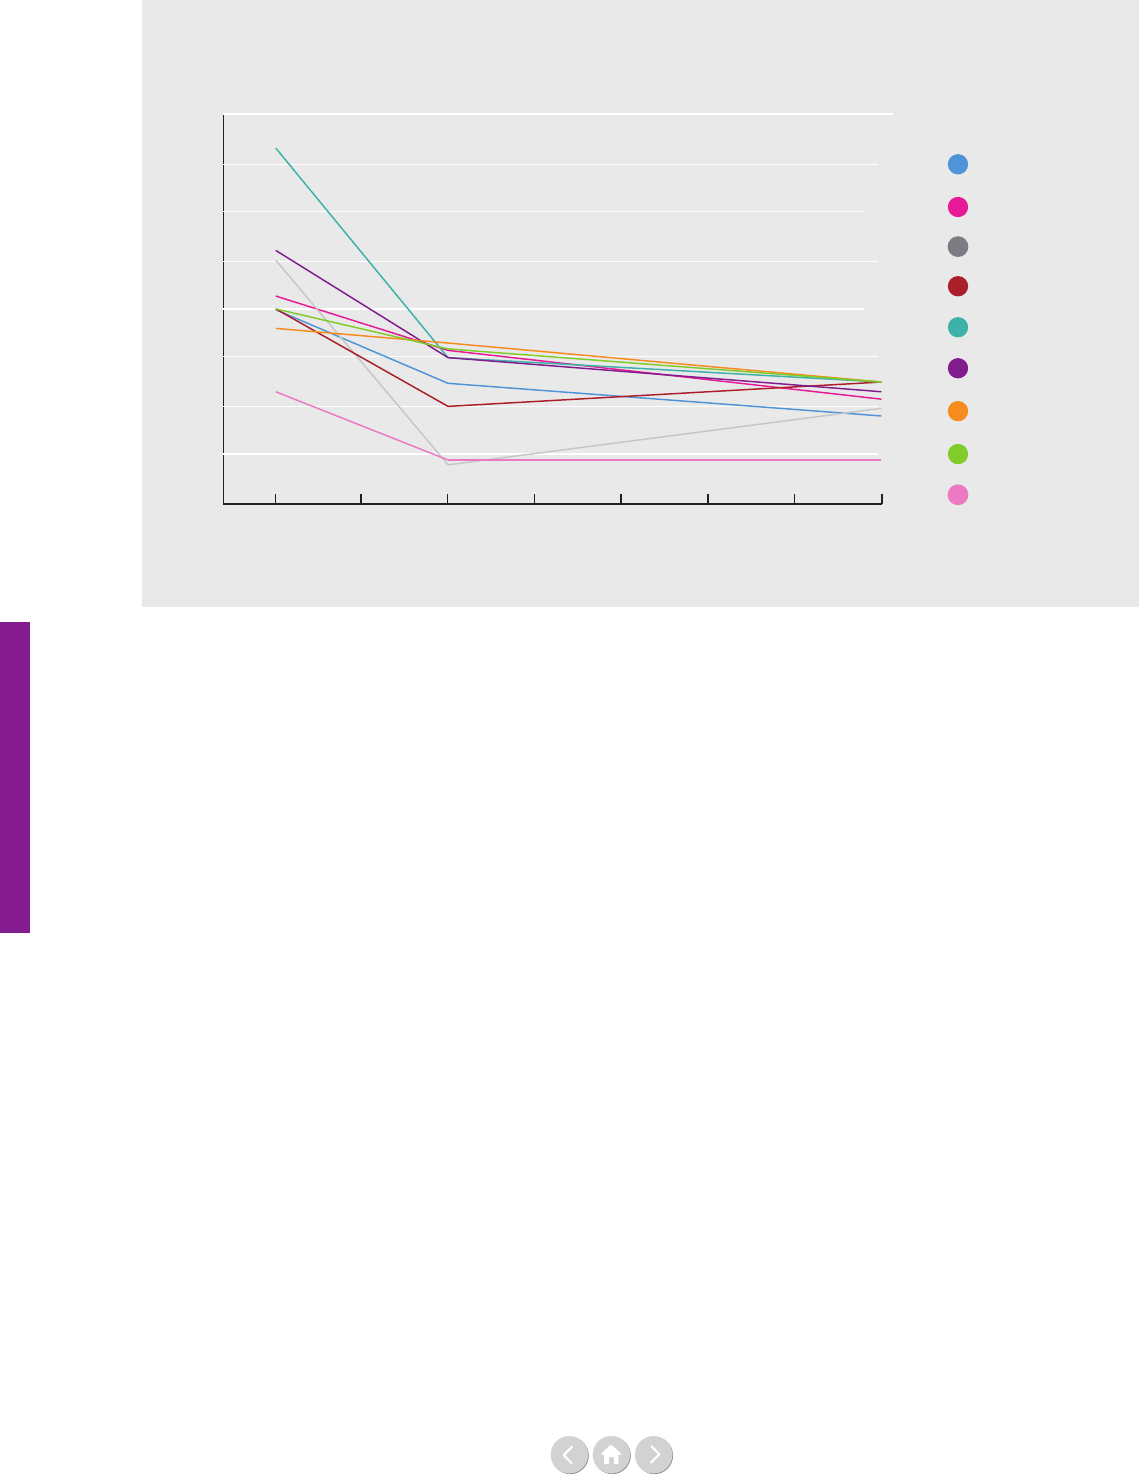
96
Figure 4: The evolution of top personal income tax rates,
selected advanced economies, 1980 – 2015
Source: Data from IMF (October, 2017). ‘IMF Fiscal Monitor: Tackling Inequality’, (database, IMF, 2017)
Accumulation of
market power and links to wealth inequality
Even if one were to accept the importance of stopping,
or even reversing, these trends on taxes, to drive reduc-
tions in inequality, it is not immediately obvious what
could trigger those policy changes. Advocacy for action
is strong and compelling. Civil society and media have
circulated widely data on the accumulation of income
and wealth at the very top, along with information
showing that there is signicant tax evasion and avoid-
ance (with multinational rms and wealthy individuals
particularly inclined to engage in these practices).
It may be that what is happening on taxation, and on the
accumulation of income and wealth at the top, reects
some broader changes that are aecting our economies
and societies. For instance, over the course of this century
there has been a sharp increase in mark-ups by rms
around the world, led by rms that are already in the top
ten percent of the distribution of mark-ups.³ Mark-ups
are the ratio between prices charged by rms and the
marginal cost of production, and they would be expected
to be close to one in competitive markets – otherwise,
there would be a strong incentive for new entrants to
charge a little less, provided they can access the same
production technology. High and increasing mark-ups,
therefore, reect progressive increases in the market
power of some rms, driven by those that had already
acquired even more market power than the others.
20%
40%
30%
50%
60%
80%
70%
100%
90%
OECD
European Union
United States
Great Britain
Japan
Italy
Germany
France
Canada
2015
1990 1995 2000
2005 2010
1980 1985
The concentration and accumulation of market power
in rms is likely to have direct linkages with the high
income and wealth inequality⁴ although the exact nature
of the relationship between the two is not yet fully under-
stood. One argument is that increased market power of
rms leads to a higher share of income going to capital,
rather than labour – and thus is partially responsible for
the decrease in the labour share of income that has been
documented for many countries over the last couple of
decades or so. While this channel remains contested in
the literature, it is certainly plausible, and shows how the
accumulation of disparities can be self-reinforcing.
Market power concentration can also open divides in
innovation capability: leading rms can use their
dominant positions to squeeze the margins of new
entrants, which disincentivises these competitors from
innovating. In developing countries, especially the
smaller ones, this can be exacerbated if multinationals
engage in anticompetitive practice to make it even
harder for domestic rms to compete, hampering
developing countries’ national innovation systems and
widening the technological gap between countries.⁵
There are some clever proposals to use taxes to curb
market power, such as Paul Romer’s idea to target
on-line advertising revenue of some specic activities
of big tech US rms with taxes.⁶ But the challenge of
market power is more widespread than big tech, and
The big picture

97
Romer’s motivation for his proposal goes beyond
addressing market power – it is not even, in fact, the
primary motivation. It is probably fair to assume that
taxes can only do so much⁷, since all rms should be
subject to roughly the same (statutory, at least⁸) tax
treatment. The realm of action to address this type of
inequality lies elsewhere, in competition policy – both
its design and implementation. Thus, we start seeing how
addressing the challenge of redressing inequality is some-
thing that calls for the consideration of a wider range of
policies, including some that are outside the purview of
the tax and transfers actions that tend to take centre stage
in debates related to inequality.
But we can go even further and ask if there is anything
common to the rms that are accumulating market
power – other than the fact that they tend to be the
ones that already had some. The evidence shows that the
answer to this question is not simple, and needs some
nuance, because the trend of increased market power is
widely shared across all sectors and industries.⁹ But there
is growing evidence suggesting that rms in sectors that
are intensive in the use of information and communi-
cations technologies have witnessed more rapid, and
greater, increases in mark-ups.
10
Thus, there is possibly
something to the argument that more technologically
intensive rms are accumulating relatively more market
power – perhaps because of dynamics such as network
externalities, that is, rms for which the value of using
that rm’s services increases the higher the number of
existing users (such as in social network or social media
companies).
Technological change
and distribution of income
To circle back to the impact of technology on labour
markets, there is strong evidence that information and
communication technologies have sharply reduced the
relative price of investment goods, generating incentives
for rms to replace labour with capital. Some argue that
further advances in technology, linked to advances in
automation and articial intelligence, can further
accelerate these dynamics of displacing labour – other
than those with the skills and talent to be immune to
the threat of being replaced by robots or algorithms.
11
There is a large, and growing, body of literature address-
ing this question, with widely divergent views on the
net impact of technological change on labour markets,
but there is little question that the technologically-
driven transformation from industrial to digital or
knowledge-based economies will be consequential to
the distribution of income, wealth – and market power
by rms.
And that brings us, nally, to the relevance of science,
technology and innovation policy. Traditionally seen
perhaps as neutral or innocuous when it comes to
having any sort of impact on inequality, it may actually
emerge as one of the most consequential policy areas for
inequality.
12
In part because some of the incentives that
exist to foster innovation are themselves premised on the
award to inventors of (temporary) monopoly power, in
the form of patents and other intellectual property rights,
that have expanded to algorithms and beyond, with the
inherent and well-recognised risks of segregating access
to technologies depending on purchasing power that can
drive inequality.
More fundamentally, science and technology policy
needs to nd the right balance between public support,
on the one hand, and incentives for private investments
in innovation.
13
The more the public side retracts to rely
on private incentives for innovation, the higher the risk
that science and technology will further drive inequality
– in part because of intellectual property rights, but also
because that will limit the space for policies to shape the
evolution of science and technology in a way that serves
people.
Generating shared benefits
through science and technology
Thus, beyond taxes and transfers, and beyond
competition policy, science and technology policy can
be a powerful driver to redress inequality. This has little
to do, necessarily, with mobilising nancing, and more
with the incentives to shape creativity and innovation to
advance science and technology in a way that generates
widely shared benets – rather than further exacerbating
the accumulation of wealth, market power, and even
political power of those that already have a lot. This is
not, alas, an original idea. As with many things related to
inequality, it was rst proposed by Tony Atkinson.
14
If anything, recent developments have further conrmed
the relevance of that prescient suggestion – and made it
more relevant than ever, if we are to meet the inequali-
ty-related SDGs by 2030.
The big picture

98
Footnotes
1
See http://commitmentoequity.org/
2
Thomas Piketty (Arthur Goldhammer, Trans.), Capital in the
Twenty-First Century, (Cambridge, Massachusetts:
The Belknap Press of Harvard University Press, 2014).
3
Federico J. Diez, Jiayue Fan, & Carolina Villegas-Sánchez,
‘Global Declining Competition’,
(working paper, International Monetary Fund, 26 April 2019).
https://www.imf.org/en/Publications/WP/Is-
sues/2019/04/26/Global-Declining-Competition-46721
4
Federico J. Diez, Jiayue Fan, & Carolina Villegas-Sánchez,
‘Global Declining Competition’, see Footnote 3
5
I am grateful to Hoi Wai Cheng for this point.
6
Paul Romer, ‘A Tax That Could Fix Big Tech’,
(news article, The New York Times, 6 May 2019).
https://www.nytimes.com/2019/05/06/opinion/tax-face-
book-google.html
7
Marcelo Lafleur suggested that, given that there is much
evidence showing that tax structures, including the corporate
tax structure, have a higher incidence on labour than on capital,
if there is a link between market power and returns to capital
then one can ask whether tax structures that benefit capital can
be changed to reduce market concentration.
8
As Hoi Wai Cheng pointed out in his comments to this
essay, in practice, large multinationals have more capability to
engage in tax evasion and avoidance, which may allow them to
gain unfair competitive advantage over smaller firms and new
entrants.
9
Federico J. Diez, Daniel Leigh, & Suchanan Tambunlertchai,
‘Global Market Power and its Macroeconomic Implications’,
(working paper, IMF, 15 June 2018).
https://www.imf.org/en/Publications/WP/Is-
sues/2018/06/15/Global-Market-Power-and-its-Macroeco-
nomic-Implications-45975
10
Federico J. Diez, Jiayue Fan, & Carolina Villegas-Sánchez,
‘Global Declining Competition’, see Footnote 3.
11
Jason Furman & Robert Seamans, ‘AI and the Economy’,
(academic article, Innovation Policy and the Economy 19,
2019) p 161-191. https://doi.org/10.1086/699936
12
Jason Furman & Robert Seamans, ‘AI and the Economy’,
see Footnote 11.
13
UNDESA ‘World Economic and Social Survey 2018:
Frontier Technologies for Sustainable Development’,
(report, World Economic Survey, 2018).
https://www.un-ilibrary.org/economic-and-social-develop-
ment/world-economic-and-social-survey-wess_69d42e13-en
This report explored how the current patent system enables
some firms to engage in anticompetitive behaviour. The use
of divisional patent is an example (a set of patent applications
that all derive from an earlier, related application, but each of
them is examined separately and have a separate publication
schedule). High patent litigation costs – which has persistently
increased for years – also favour larger firms. Patent thickets
– dense web of overlapping intellectual property rights that a
firm must navigate through to commercialise a new technology,
pose a barrier for entry.
14
Anthony B. Atkinson, ‘After Piketty?’, (academic article,
The British Journal of Sociology, 17 December 2014),
p 619-638. https://doi.org/10.1111/1468-4446.12105
The big picture

100
Making smart choices
Earmarking:
Making smart choices
PART TWO
Chapter Two
UN pooled funding: 'Healthy' financing for better multilateral results
by the UN Multi-Partner Trust Fund Office (MPTFO)
Shades of grey: Earmarking in the UN development system
by Max-Otto Baumann, Erik Lundsgaarde and Silke Weinlich
Improving the World Health Organization’s financing
by Brian Elliott and Maximilian Sandbaek
Lessons from health on how to invest wisely in development
by Guido Schmidt-Traub
Current and future pathways for UN system-wide finance
by Silke Weinlich and Bruce Jenks

101
Making smart choices
The Multi-Partner Trust Fund Oce is the UN
centre of expertise on pooled nancing
mechanisms. Hosted by UNDP, it provides fund
design and fund administration services to the
UN system, national governments and non-
governmental partners. The MPTF Oce
operates in over 110 countries and manages a
total portfolio of US$ 12 billion in pooled funds,
involving more than 150 contributors and over
85 participating organisations.
UN pooled funding:
'Healthy' financing for
better multilateral results
By the UN Multi-Partner Trust Fund Office (MPTFO)
The 2030 Agenda has brought not only a new paradigm
about how governments address sustainable development
for their citizens’ present and future, but it has also
triggered a reinvigorated and rare appetite for a new
generation of partnerships around Sustainable Develop-
ment Goals (SDGs): true multi-stakeholder partnerships
where governments, investors, international organisa-
tions, private sector and civil society can come together
to tackle complex problems. The United Nations
development system entities with dierent mandates
have been instrumental in germinating and bringing
about SDGs and thus are particularly well-placed to
articulate and convene these types of partnerships.
While not all partnerships with the UN require a large
scale, inter-agency and multi-stakeholder type of
collaboration, increasingly the more complex problems
of our current times, from humanitarian responses to
protracted crises to climate action, from peacebuilding
to safe, orderly and regular migration or from end-
ing violence against women and girls to empowering
youth worldwide require a new scope of joint action
and nancing, are where the UN is particularly well
positioned to deliver. But this requires solid, exible,
robust, transparent and reliable nancing instruments
that underpin this type of action – a departure from the
highly-fragmented landscape that prevails today.
This helps explain why UN pooled funding has been
increasingly recognised as a key nancing instrument in
the discussions about how to fund the UN, to deliver
on the SDG promise and improve how the UN fulls
its mandate, with sweeping changes in three streams of
UN reform: development, management and peace and
security.
Meeting the SDGs hinges on securing new levels of
nancial ambition, and on expertise and investments
that build and complement a nancial architecture that
assures ‘no one is left behind’. Inter-agency pooled
nance oers a exible, collaborative and ecient way
to support SDG nance and reach those furthest behind.
Pooled funding at the core of UN reform
UN leadership and its Member States recognise pooled
nance as an eective instrument for improving
collaboration and reducing fragmentation with and
within the UN – a major tenet of the reform process,
across all of its pillars. In May 2018, the UN General
Assembly (UNGA) resolution on repositioning the UN
development system¹ committed to reducing fragmenta-
tion and to ‘double inter-agency pooled funds to a total
of US$ 3.4 billion’ per year by 2023.
The resolution also welcomed the UN Secretary-
General’s call for a Funding Compact. This Compact
has since been agreed by UN Member States and the
UN development system. It contains a series of mutual
commitments between the UN and its Member States
to raise the quality of funding and delivery with regard
to development assistance. It includes commitments to
double the share of contributions to UN pooled funds
by 2023, to raise the number of contributors to pooled
funding as well as to fully capitalise two key agship
funds: the Joint SDG Fund and the Secretary-General’s
Peacebuilding Fund. The commitments on the UN side
of the Funding Compact ask for increased eciency and
eectiveness of development-related inter-agency pooled
funds through a series of common management features.
These include critical performance features, such as clear

102
Making smart choices
theories of change, solid results-based management
systems, well-functioning governance bodies, transpar-
ency, visibility and arrangements for the evaluation of
pooled funds.
In addition to this recent commitment to double develop-
ment-related pooled funding, at the 2016 World
Humanitarian Summit it was agreed to increase the con-
tributions to UN country-based pooled funds to 15%.
The call for doubling contributions to UN pooled funds
can be translated into action. Based on provisional
numbers for 2018 from UN pooled fund administrators,
UN pooled funds mobilised an estimated US$ 2.5
billion, an increase of approximately 25% compared to
the US$ 2.0 billion in 2017 (as shown in Figure 33 on
page 42 in Part One of this report).
The benefits of good pooled funding:
What’s the fuss?
So why this renewed interest? UN pooled nancing
has been used for more than 15 years, when the UN
Multi-Partner Trust Fund Oce (MPTFO) was estab-
lished to administer a pooled fund for Iraq – the United
Nations Development Group (UNDG) Iraq Trust Fund.
Since then, knowledge and expertise in pooled nancing
has been increasingly accumulated. Wide research and
reports have shown the benets of pooled nancing.
For example, in a discussion paper, the UNDG²
unpacked ve key comparative advantages of pooled
nancing mechanisms:
• Improve aid coordination and coherence.
• Promote better risk management.
• Broaden the contributor base for the UN system.
• Facilitate transformative change.
• Bridge the silos between humanitarian, peace and
security, and development assistance.
•
While much of the discussion has centred on the
nancial element of pooled funds, less focus has been on
the fact that pooled funds are uniquely placed to allow
certain types of collaboration that require a multi-
dimensional approach: where the UN has a strong con-
vening power to address complex nancing and where
higher levels of risk management and trust are required.
Almost four years into SDG implementation we have
started seeing the new type of multi-partner collabora-
tion pooled nancing mechanisms allow. Take for
instance, the Peacebuilding Fund, which has recently
seen its largest growth in terms of commitments and
transfers – approaching the ‘quantum leap’ asked by the
UN Secretary-General. This has come with new modal-
ities of collaboration (direct implementation by non-
UN organisations, blended capital options and funding
schemes for the humanitarian-development-peace
nexus).
Pooled funding also helps to prevent the mushrooming
of small, discreet projects and encourages the alignment
of action under a global umbrella, enabling transforma-
tional change. The Spotlight Initiative is a good example
of this. A large-scale partnership between the European
Union and the UN to address violence against women
and girls, the initiative has so far launched programmes
in 13 countries and regionally in Southeast Asia, pro-
viding the adequate level of funding for this pervasive
universal problem (exemplied not least in the #MeToo
movement). In many of the countries where the Spot-
light Initiative operates, it is helping to align a myriad
of actions which were otherwise dispersed until recently.
In sum, global, well-designed and professionally
managed, pooled funds provide overarching nancing
umbrellas that are aligned with the new generation of
UN Cooperation Frameworks in-country.
What will it take to double
the share of inter-agency pooled funds?
Taking into account all of the benets of inter-agency
pooled funds, Member States and the UN development
system have committed to an inspiring target within the
Funding Compact: to double the percentage share from
5 to 10% of inter-agency pooled funds within the total
non-core resources for development related activities. In
spite of the recent growth of pooled funds in absolute
terms, data compiled for the 2019 United Nations Eco-
nomic and Social Council (ECOSOC) Operational
Segment signals this percentage still stood at 5% in
2017.³ Thus, reaching the target of 10% of non-core
contributions through inter-agency pooled funds will
require additional eorts both by Member States and the
UN development system.
First, it will be necessary to enlarge the number of contributors
that are heavily engaged in inter-agency pooled funds.
As described in Part One of this report, the source of
nancing of inter-agency pooled funds is still con-
centrated to a relatively small number of contributors.
The top 12 contributors together accounted for 90%
of all funding to inter-agency pooled funds.⁴ Almost
two thirds of all contributions to inter-agency pooled
funds come from the governments of United King-
dom (22.0%), Germany (17.8%), Sweden (12.6%) and
Norway (10.5%). Among all Member States, only 13
provided at least 10% of their non-core contributions
for development activities to inter-agency pooled funds
(United Kingdom, Sweden, Norway, Canada, Ireland,
Qatar, Australia, Slovakia, Liechtenstein, Israel, Lithuania,
Liberia and Somalia).
Second, UN entities will need to increase their participation
in pooled funds. As shown in Figure 1 on the next page,
only ve UN entities as of today receive more than 5%
of their earmarked revenue from inter-agency pooled
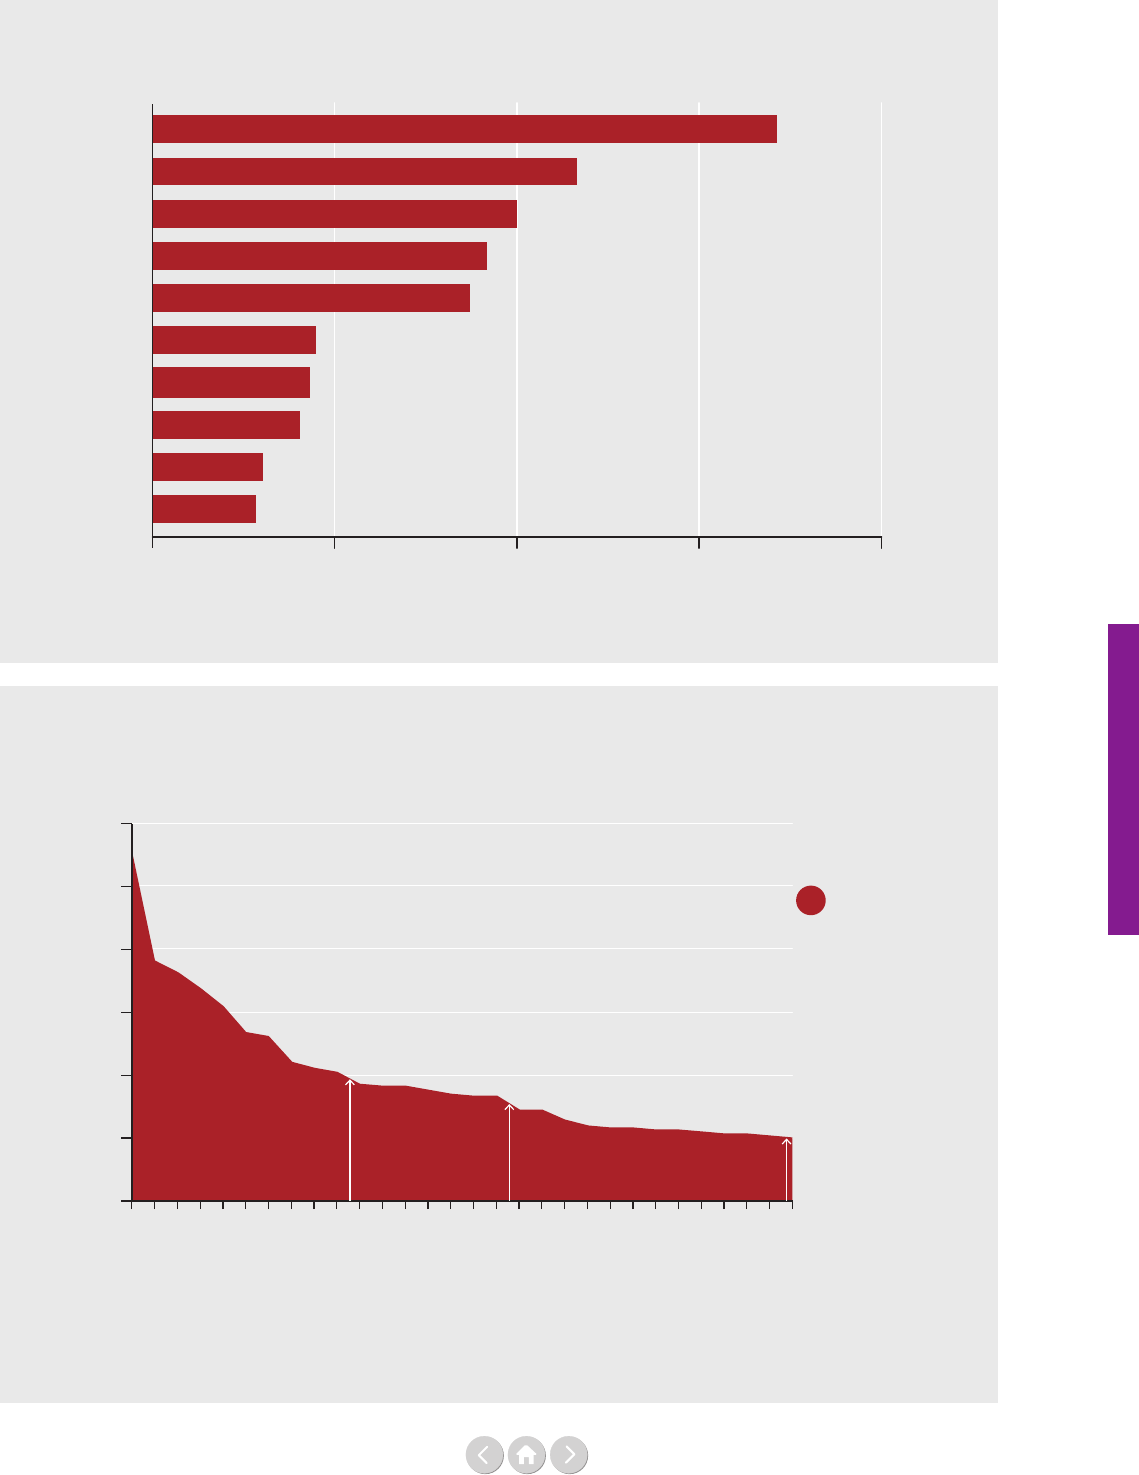
103
Making smart choices
Figure 1: Ten UN entities that receive the highest share of earmarked contributions
through UN inter-agency pooled funds, 2017
Source: Report of the Secretary General (A/74/73 – E/2019/4) and UN Pooled Funds Database
0% 5% 10% 15% 20%
17.1%
11.6%
9.9%
9.1%
8.7%
4.4%
4.3%
4.0%
2.8%
3.0%
UN-HABITAT
UNFPA
UN Women
FAO
UNDP
UNICEF
OHCHR
ILO
WFP
UNITAR
Figure 2: Countries with 10% or more of earmarked development related expenditure comes
from UN inter-agency pooled funds (30 countries, 21 in 2015)
Source: Report of the Secretary General (A/74/73 – E/2019/4) and UN Pooled Funds Database
Share of earmarked
through Pooled Funds
10 countries 7 countries 13 countries
60%
50%
40%
30%
20%
10%
0%
Papua New Guinea
Solomon Islands
Maldives
Gambia
Lesotho
Somalia
Sudan
Vietnam
Cape Verde
Haiti
Niger
Malawi
Central African Rep.
United Rep of Tanzania
Mozambique
Albania
Madagascar
Colombia
Kazakhstan
Rwanda
Sri Lanka
Guatemala
Bangladesh
Liberia
Dem Rep of the Congo
Cote d'Ivoire
Mongolia
Burkina Faso
Ghana
Uganda
20%
15%
10%

104
Making smart choices
funds – United Nations Human Settlements Programme
(UN-HABITAT), United Nations Population Fund
(UNFPA), United Nations Entity for Gender Equality
and the Empowerment of Women (UN Women), Food
and Agricultural Organization of the United Nations
(FAO) and United Nations Development Programme
(UNDP). There are only three UN entities where
pooled funds represent more than 10% of non-core
resources. Inter-agency pooled funds will need to
continue to explore what the incentives and obstacles
are for more active participation of UN entities in the
implementation of pooled funds. There is also great
potential for non-resident UN entities, those without
oces in a country but whose mandate and expertise
can make a substantial development contribution, to
participate in pooled funds.
And third, inter-agency pooled funds at the country level
should be reimagined by, for example, recognising them
as exible ‘core’ like contributions for inter-agency
work within the UN Sustainable Development Coop-
eration Frameworks. The total percentage of non-core
development related expenditures that come through
inter-agency pooled funds, varies highly from country to
country, as shown in Figure 2 on the previous page, but
in only 30 countries is the share over 10%.
Experience in joined-up approaches might be a factor
that explains greater engagement in pooled funds.
Many of the countries with the highest rates of funding
through inter-agency funds had previously requested
the UN development system to adopt the Delivering as
One approach (Papua New Guinea, Maldives, Lesotho,
Vietnam, Cape Verde, Niger, Malawi, United Republic
of Tanzania, Mozambique or Albania, for example).
In addition, countries with support from transition funds
(such as Somalia, Sudan or Colombia) also performed
well in this regard, demonstrating that pooled funds can
be a particularly good t for the humanitarian-develop-
ment-peace nexus (for more information on this, see
Part One of this report).
Pooled funds are particularly well-positioned instru-
ments to nance the new generation of UN Sustainable
Development Cooperation Frameworks at the country
level, as inter-agency pooled funds can act as the most
exible, predictable and coherent nancing instrument
under the leadership of the UN Resident Coordinator.
As argued by Weinlich and Jenks in their contribution
in Part Two of this report (page 119), it is necessary to
develop country-level resource strategies to nance
system-wide action.
At the global level, the resolution on the UN develop-
ment system repositioning acknowledged the import-
ant role of the Joint SDG Fund and the Peacebuilding
Fund. There is now an opportunity to rethink the role
of pooled funds for nancing system-wide action and
results under the UN Cooperation Framework. These
actions, taken together, might be among the most viable
strategies to reach the ambitious target of doubling from
5% to 10% of non-core development resources chan-
nelled through pooled funds. To make this happen, there
is a wealth of experience to learn from.
The good cholesterol:
Making pooled funds healthy pooled funds
Pooled funds can be good or bad, like cholesterol, and
similarly it is not only about levels but quality.
Continuing with this metaphor, badly designed high-
energy-consuming pooled funds can be heavy, block
circulation and ultimately lead to heart problems. High
cholesterol can be inherited, but it is often the result of
unhealthy lifestyle choices, which makes it preventable
and treatable. A healthy diet and regular exercise can help
make big strides in improving one’s cholesterol. What
then are the healthy habits one can pursue when talking
about pooled funds?
• First, commitment. As we move into a relatively new
behaviour (and not always desired by all at the start),
we need strong commitment. Commitment and
leadership from contributors, implementing partners
and national governments. The Funding Compact is
a strong starting expression of this commitment.
•
• Second, enablers. An independent professionalised
trustee function enables implementing partners to
focus on programmatic results and facilitates
• governance mechanisms to exercise oversight and
overall accountability. The systems, arrangements
• and logistics for their commitment should be in
place. Each type of partnership may need dierent
types of enablers and in this regard instruments have
been developed that allow the initiation, funding
and implementation by a variety of partners.
•
• Third, socialising. This requires simplifying and
• facilitating the participation of a variety of non-
• traditional partners. The value of pooled funds is
about co-mingling, innovation, inclusion, exibility
and embracing these new behaviours together
• (socialising the results and lessons learned).
•
• Fourth, accountability. Governance of the fund
should allow for mutual accountability and provide a
space to voice concerns and needs of all stakeholders
involved, as well as accommodate important aspects
of visibility that can sometimes be downplayed in a
pooled platform.
•

105
Making smart choices
Footnotes
¹ United Nations General Assembly, ‘Resolution adopted by
the General Assembly on 31 May 2018, Repositioning of the
United Nations development system in the context of the
quadrennial comprehensive policy review of operational
activities for development of the United Nations system’,
(resolution, A/RES/72/279, UNGA,
1 June 2018). https://undocs.org/A/RES/72/279
² UN Development Group, ‘The Role of UN Pooled
Financing Mechanisms to Deliver the 2030 Agenda’,
(report, UNDG, 2016).
https://undg.org/document/the-role-of-un-pooled-financing-
mechanisms-to-deliver-the-2030-agenda/
³ UN General Assembly Economic and Social Coun-
cil (UNGA ECOSOC), ‘Funding analysis of Operational
Activities for Development – Addendum 2’, (resolution,
A/74/73-E/2019/4 Add. 2, UNGA ECOSOC, 18 April 2019).
www.undocs.org/A/74/73/Add.2
⁴ A/74/73-E/2019/4 Add. 2, UNGA ECOSOC, 18 April 2019,
see Footnote 3.
The learning and investment curves can be steep initially
but as experience shows smart and healthy investments
clearly pay o in the long term. In the same vein, smart
pooled funds are central for an agile, t and relevant UN
– picking up the pace and momentum for the long run.

106
Making smart choices
Shades of grey:
Earmarking in the UN development system
By Max-Otto Baumann, Erik Lundsgaarde and Silke Weinlich
Max-Otto Baumann is a Senior Researcher at the
German Development Institute (Deutsches Institut
für Entwicklungspolitik - DIE). His research
focuses on UN development system reform, in
particular in the areas of governance, coordination
and funding. He is a member of the research
programme Inter- and Transnational Cooperation
with the Global South.
Erik Lundsgaarde was until July 2019 a Senior
Researcher at the Danish Institute for International
Studies (DIIS). His research focuses on global
development policy trends, the organisation of
development cooperation, and development
eectiveness. His current work examines the
nancing of the multilateral development system
and the coordination of climate nance for
developing countries.
Silke Weinlich is a Senior Researcher at the
German Development Institute (Deutsches Institut
für Entwicklungspolitik - DIE). She is a member of
the research programme on Inter- and Trans-
national Cooperation with the Global South where
she leads a project on the UN development system
and its reform needs. Current research interests
include the reform of the UNDS and broader
questions of multilateral development cooperation,
South-South cooperation and the UN, as well as
questions of global governance.
Do we know enough about the various forms of ear-
marked funding arrangements to inform decision-
making? What positive and negative marks have three
decades of earmarked contributions left on the UN
development system (UNDS)? What challenges do
donors face in managing earmarked funding? And
what perspectives on the earmarking conundrum at the
UNDS are helpful in identifying entry points for re-
form? This contribution provides some answers to these
questions, drawing on ndings from our broader study
on earmarking in the multilateral development system.
Towards the end of the piece, we reect on how to take
the recently adopted UN Funding Compact forward.
The many facets of earmarking
Earmarked funds come in many varieties but share three
features:
a) they are always voluntary in nature,
b) contributors specify a purpose for which they are
used and
c) statutory multilateral governance bodies are not
responsible for their allocation.
Typically, earmarked funding has been juxtaposed with
multilateral core funding. Core or general purpose
funding is crucial in ensuring that UN entities function
and that their multilateral assets are protected. However,
assessing core funding against non-core or earmarked
funding conceals the multifaceted nature of earmarking
approaches.
Earmarking arrangements dier in terms of their ad-
vantages and disadvantages for donors, UN entities and
recipients. Instruments range from multi-donor trust
funds that allow a better coordination of humanitarian
aid, to single donor trust funds where one contributor
strengthens an organisation’s work in one particular pro-
grammatic area to single donor project funding whereby
an organisation receives funds, often in the eld, for a
specic project/output in a clear geographic location
and specied target group of beneciaries. Given their
dierent properties, these funding arrangements can
widely vary in their eects on individual UN entities,
on the broader multilateral development system and of
course on the eectiveness of development interventions.
They also vary with regard to the inuence, control and
accountability that donors allegedly seek.
Earmarking is thus a matter of degree, ranging from
very tight, highly customised, donor-driven projects, to
quasi-core support. If we accept this premise, multilateral
funding choices are no longer about an either/or of core

107
Making smart choices
and non-core funding, but rather about the best mix of
various forms of funding which allows UN organisations
to play to their strengths and the system to become more
than the sum of its parts. If well-managed and aligned,
earmarked funding can strengthen multilateralism and
the ability of organisations to help implement the 2030
Agenda. The Funding Compact provides a step toward
achieving this goal.
Knowledge about earmarked funding in the UNDS has
accumulated over the last ve years, not least through the
work of the United Nations Department of Economic
and Social Aairs (UNDESA) and this very report. The
recently adopted Data Cube standards for system-wide
reporting will provide an even better data basis that helps
measure progress on the Funding Compact indicators.
Yet in our research, we found that existing data and
classications still have signicant gaps when it comes
to shedding light on important facets of earmarking.
Parameters such as the number of donors in funding
agreements, duration, governance arrangements, align-
ment to programmatic frameworks or level of purpose
specication are not yet made transparent, but they can
have a big impact.
The largest category of earmarked funding in the
UNDS (programme/project funding) is in essence still
a black box at the system level, though UN entities are
using their transparency portals to reveal more infor-
mation, yet unevenly so. The decision to apply the one
percent levy on funding in this category reects the
assumption that it is the most disruptive form of funding.
But not all varieties seem to be equally harmful –
funding of parts of country programmes (or in the future
funding for Country Coordination Frameworks) actually
provide welcome support. At the same time, there is
evidence that more restrictive forms of earmarking
occur within some thematic or interagency funds,
potentially reducing their usefulness for UN entities.
Consequences of earmarking on the UNDS
Earmarking has existed for nearly three decades in the
UNDS, and for more than 20 years the share of non-
core funds has been larger than core funds across the
system, though the importance of earmarked funds in the
individual funding proles of UN entities varies. Ear-
marked funds have ensured that the UNDS has broadly
kept its overall share of multilateral Ocial Develop-
ment Assistance (ODA) and thus allowed the UNDS to
evolve and stay relevant, enabling a broad expansion of
activities. There are also other positive eects. The close
involvement of donors through earmarking, not only at
the country level, might amplify UN entities’ activities
and provide support in dicult situations. The need
to meet accountability requirements and demonstrate
eciency, agility and success has shaped UN systems and
operations in recent years, and provided an impetus to be
more entrepreneurial. Last but not least, pooled funding
arrangements can bring the system, and at country-level
also donors and host countries, more closely together
to join forces to better address country needs. Global
pooled funds may act as catalysts and allow eld oces
to take more risks.
These positive impacts of earmarked funding should
not lead us to neglect its downsides across the system.
A low share of core and a supply-driven system threaten
the principled, problem-oriented allocation of resources
and the execution and strengthening of multilateral core
functions. Earmarked funding tends to be short-term,
and this generates a trend towards low-hanging fruits
rather than addressing complex socio-economic
challenges in the spirit of sustainability. It drives compe-
tition and hinders coordination and cooperation, thereby
conicting with the requirements of the 2030 Agenda.
And while earmarking may have made the UN more
cost-conscious, it comes with transaction costs which
are arguably a source of even larger ineciencies. Finally,
it creates an extreme donor-orientation in all phases of
the programming and implementation process (‘tunnel
vision’, ‘tyranny of the urgent’), which may undermine
development eectiveness.
UN agencies have been playing an active part in mobil-
ising earmarked resources, while at the same time trying
to mitigate the more negative aspects. Decentralisation
of decision-making authority to the country level played
an important role. Once in place, eld oces have
incentives to sustain themselves nancially. Coordination
mechanisms inside and across entities – notwithstanding
some positive examples – have so far not been strength-
ened to an extent that allow a rmer corporate stand
against earmarked funding proposals that fall outside an
organisation’s thematic priorities or are too restrictive.
Last but not least, the deliberate use of core resources
to leverage non-core contributions is further driving
earmarking. This is not bad per se, but there is risk of
reverse leveraging whereby donors bind agencies’ core
resources for their bilateral purposes.
Donors: challenges in earmarking practices
Based on document analysis and interviews, we have
identied common challenges around the earmarking
practices of Germany, Sweden, the United Kingdom and
the European Commission, which might impact these
donors’ ability to adopt the behavioural changes
requested by the Funding Compact. First, and not
surprisingly, administrative costs of earmarking arrange-
ments also arise for donors, although there is little actual
assessment of these costs. Delegating the implementation
of projects and programmes to UN entities through
earmarked funding channels also requires continued

108
Making smart choices
engagement and administrative oversight on the part
of the donor. Second, across bureaucracies, it becomes
apparent that capacity constraints undermine oversight,
accountability and control, which were among the
primary motives for earmarking in the rst place. Third,
decision-making related to earmarked funding tends to
be dispersed, whether between headquarters and the
country level, or across the headquarters of dierent
ministries and implementing agencies. This dispersion
renders the application of overarching strategic objectives
more dicult.
While there is a variation in terms of the strategic nature
of donor approaches, all have diculties communicating
their multiple funding decisions in many dierent
contexts via an overarching strategy. Without clearly
described options, including guidelines and trade-os,
there is a limited basis for ensuring that dispersed fund-
ing ows are working together to advance a common
agenda. In practice, decisions to provide earmarked funds
reect the combination of thematic agendas, develop-
ment needs in specic contexts, the availability of
alternative funding channels, the legacy of past decisions,
budgetary restrictions and other considerations. Changes
in the funding mix of donors thus require overall polit-
ical support for the Funding Compact that goes beyond
those only responsible for UN reforms and institutions,
and a thorough strategic approach that may help enforce
greater funding discipline.
Earmarking at the UNDS:
A collective action problem
How can we best make sense of the bigger picture of
UN funding? Taking more abstract perspectives never
does justice to overly complex realities, yet it allows us
to identify crucial entry points that could help secure
a healthier funding basis for the UNDS. One focus
could be on the dyadic relationship between one donor
and an organisation to reect on how to improve that
relationship – through thematic funds, strategic funding
dialogues and the like. To add some layers of complexity,
we could then secondly assume that neither the donor
nor the UN organisation are unitary actors, and that
in the end, it is also about political and other priorities
of programme countries and societies. This would shift
the focus to issues of coordination and alignment, and
related incentives, eg the t of funding arrangement with
Sustainable Development Cooperation Framework, and
institutional strategies to ensure greater discipline.
A third perspective embeds the relations between organi-
sations, funders and recipients into a larger systemic view
and interprets it as a set of collective action problems.
In a way, the multilateral assets of the UNDS (such
as convening power, the link between normative and
operational work, broad country presence, knowledge
and expertise, perception of impartiality) can be consid-
ered common goods in themselves. Through earmark-
ing, these common good are depleted, with the extent
depending on the form of funding arrangements, cost
recovery, the overall ratio of core/non-core, and the like.
The more that contributors engage in earmarking, the
more it becomes a rational strategy for others to do so,
even if these practices might diminish the unique multi-
lateral UN assets that make delegation to the UN so
interesting in the rst place.
Relatedly, the provision of core funding becomes less
and less attractive, potentially also for those countries
from the South that are now in a better position to
contribute. And the more UN agencies accept
thematically undue or overly restrictive earmarking
arrangements, the more it becomes rational for other
agencies to do the same, even if in the long run, it is in
no one’s interest. Thus, the more the UN is used as an
implementing agency, the more it turns into one – and
other multilateral qualities lose out.
How can such a vicious circle be slowed down and
potentially reversed? From literature about commons, we
know that communication, reputation, reciprocity, trust
and sanctions are helpful, as is better knowledge of the
long-term benets.
Taking the Funding Compact forward
The Funding Compact represents a much-needed
systemic approach that brings together both UN
agencies and Member States behind their respective
common obligations in terms of funding and perfor-
mance. It aims to establish a better funding mix across
the UNDS and enable inter-agency cooperation and
collective responses for more eective support to the
implementation of the 2030 Agenda.
Several elements that could help overcome the collective
action problems outlined above are already part of it.
For example, the Compact’s implementation will be
periodically discussed and reviewed. This involves com-
munication among UN Member States and UN entities
and provides opportunities to reciprocate changes by
others – this is the essence of a compact. Both states and
agencies can gain (or tarnish) their reputations as reform
champions in implementing their commitments. To raise
the stakes, Member States should use their voluntary
national reviews to the High-Level Political Forum for
reporting on the implementation of commitments, also to
bring the various policy and reform strands more closely
together. All in all, the Funding Compact and related,
transparent policy changes may translate into greater trust
among Member States and between states and agencies.

109
Making smart choices
However, improving the performance of the system and
building a stronger case for core contributions requires
sustained dedication and political will on the side of
Member States and UN entities, and perhaps steps that
go beyond the content of the compact. All Member
States need to make UNDS reform a political priority
that shapes not only their funding mix but also their
behaviour towards UN entities and the UNDS at large.
Member states and UN entities need to increase trans-
parency on country-level funding and activities. Ear-
marked programme/project funding, which accounts for
60% of UNDS funding and often involves substantial
co-nancing from regular budgets, is currently under
insucient scrutiny by boards or the wider public.
Furthermore, agencies should develop greater resis-
tance against earmarking by strengthening their internal
mechanisms, as well as inter-agency coordination, where
the Resident Coordinator needs to have a greater role
in aligning funding with the Sustainable Development
Cooperation Framework. Such changes will not cure all
of the UNDS funding ills – yet they might eventually
interrupt the vicious circle described above and nurture
the UN’s multilateral assets that the world needs more
than ever in the UN’s 75th year of existence.

110
Making smart choices
Improving the World Health
Organization's financing
By Brian Elliott and Maximilian Sandbaek
Brian Elliott is Chief, Coordinated Resource
Mobilization and Donor Analytics at the World
Health Organization.
Maximilian Sandbaek is Technical Ocer at the
World Health Organization.
WHO’s primary role is to direct international
health within the United Nations system and to
lead partners in global health
responses.
The authors are sta members of the World Health
Organization. The authors alone are responsible for the
views expressed in this article and they do not
necessarily represent the decisions, policy or views of
the World Health Organization.
The World Health Organization (WHO) has launched
an ambitious ve-year strategic plan through its 13
th
General Programme of Work (GPW) 2019-2023, which
was approved by the Seventy-First World Health
Assembly in May 2018 (resolution WHA71.1). With its
mission to ‘Promote health, keep the world safe, serve
the vulnerable’, the GPW 13 outlines a clear vision for
achieving three strategic priorities through its triple
billion targets:
• achieving universal health coverage – 1 billion
more people beneting from universal health
coverage;
• addressing health emergencies – 1 billion more
people better protected from health emergencies; and
• promoting healthier populations – 1 billion
more people enjoying better health and wellbeing.
The GPW 13 is fundamentally aligned with the Sustain-
able Development Goals (SDGs) and provides a pathway
to achieving some of the health-related SDGs. The triple
billion targets support the same ambitious aims as the
Goals and take forward the United Nations 2030 Agenda
for Sustainable Development.
Furthermore, in formulating and implementing the
WHO transformation agenda, the Organization has
demonstrated its full commitment to and engagement in
the United Nations development system reform. WHO
supports the strengthening and simplication of inter-
agency mechanisms to enhance cooperation within
business operations, while at the same time avoiding
possible duplication of functions.
Strengthening WHO’s approach to resource mobilisation
represents one of the major shifts in GPW 13. Building
on the extensive reform process initiated in 2011, WHO’s
new mission, as outlined in GPW 13, will require a shift
to optimise the World Health Organization’s strategic
approach and operational model for global fundraising.
Going forward, resource mobilisation will be understood
as a strategic partnership between Member States, non-
state actors and the WHO Secretariat.
WHO has already started to implement several initia-
tives. These include the launch of a WHO rst-ever
investment case, the formulation of a draft Global Action
Plan to drive collective action by global health actors,
the development of a draft resource mobilisation strategy,
the introduction of thematic and strategic funds, the
implementation of initiatives to improve partner visibility
and, in April 2019, an Inaugural Partners Forum in
Sweden.
Investment case
In order to achieve the targets set out in the GPW 13,
WHO published its rst investment case¹ in September
2018, setting out the transformative impacts on global
health and sustainable development that a fully-nanced
WHO could deliver over the next ve years.
The investment case describes how WHO, working
together with its Member States and partners, could
help to save up to 30 million lives, add up to 100 million
years of healthy living to the world’s population and add
up to 4% of economic growth in low and middle-
income countries by 2023. Achieving these results would
require an investment of US$ 14.1 billion from 2019 to
111
Making smart choices
2023, representing a 14% increase in WHO’s base budget
over the previous ve-year period.
In doing so, the investment case shows how a stronger,
more ecient, and results-oriented WHO will serve and
guide governments and partners in their eorts to im-
prove the health of their populations. It highlights new
mechanisms to measure success, ensuring a strict model
of accountability, and sets ambitious targets for savings
and eciencies.
Furthermore, the investment case emphasises WHO’s
focus on equity, gender and rights-based approaches
that aim to close gaps in health service coverage and
empower individuals and communities to ensure no
one is left behind.
Finally, the investment case outlines WHO’s critical role
as a partner, convener, and driving force in coordinating
eorts across the global health arena. Figure 1 above
shows the GPW 13 triple billion targets along with the
current nancing levels of the estimated GPW 13 fund-
ing needs.
Global Action Plan
To accelerate progress towards the health-related Sustain-
able Development Goals, global organisations active
in health, coordinated by WHO, worked together to
develop the draft Global Action Plan² for healthy lives
and wellbeing for all. The draft Global Action Plan
represents a historic commitment to advancing collective
action, including coordination of resource mobilisation
Figure 1: GPW 13 targets and funding needs
Source: World Health Organization (WHO)
GPW 13 triple billion target GPW funding needs, US$ billion
One billion
more people
benefiting from
One billion
more
people better
protected from
One billion
more people
enjoying better
Funds required 10.1
U
n
i
v
e
r
a
l
H
e
a
l
t
h
C
o
v
e
r
a
g
e
H
e
a
l
t
h
a
n
d
w
e
l
l
-
b
e
i
n
g
14.1
total ask
2.5
Humanitarian
and
emergencies
10.0
Base budget
1.6
Polio
eradication
4.0
projected
income as of
June 2019
H
e
a
l
t
h
e
m
e
r
g
e
n
c
i
e
s
for healthy lives and wellbeing for all. It is expected that
additional organisations will pursue this joint eort to
achieve the ambitious Sustainable Development Goals
leading to a healthier, more prosperous, inclusive and
resilient world. The nal draft of the Global Action Plan
will be submitted to the United Nations General
Assembly in September 2019 and will provide context
for WHO’s work going forward.
The Secretariat will step up its leadership for the imple-
mentation of the future Global Action Plan and convert
various multilateral commitments of the Organization
into collective and tailored action aimed at supporting
countries in accelerating progress towards the health-
related Sustainable Development Goals. By fully aligning
the plan with the Sustainable Development Goals, WHO
is making a commitment to the goals’ mission to ‘leave
no one behind’.
Resource mobilisation strategy
Considering the ambitious goals set by GPW 13, the
required resources as specied in the investment case,
the initiation of a Global Action Plan for healthy lives
and wellbeing for all, and the World Health Assembly
approval of WHO’s Programme Budget 2020-2021,
a draft resource mobilisation strategy has been developed
to help drive resource mobilisation eorts over the
period 2019-2023.
To this end, an information note giving a high-level
overview of the resource mobilisation strategy will be
brought to the WHO Executive Board in January/
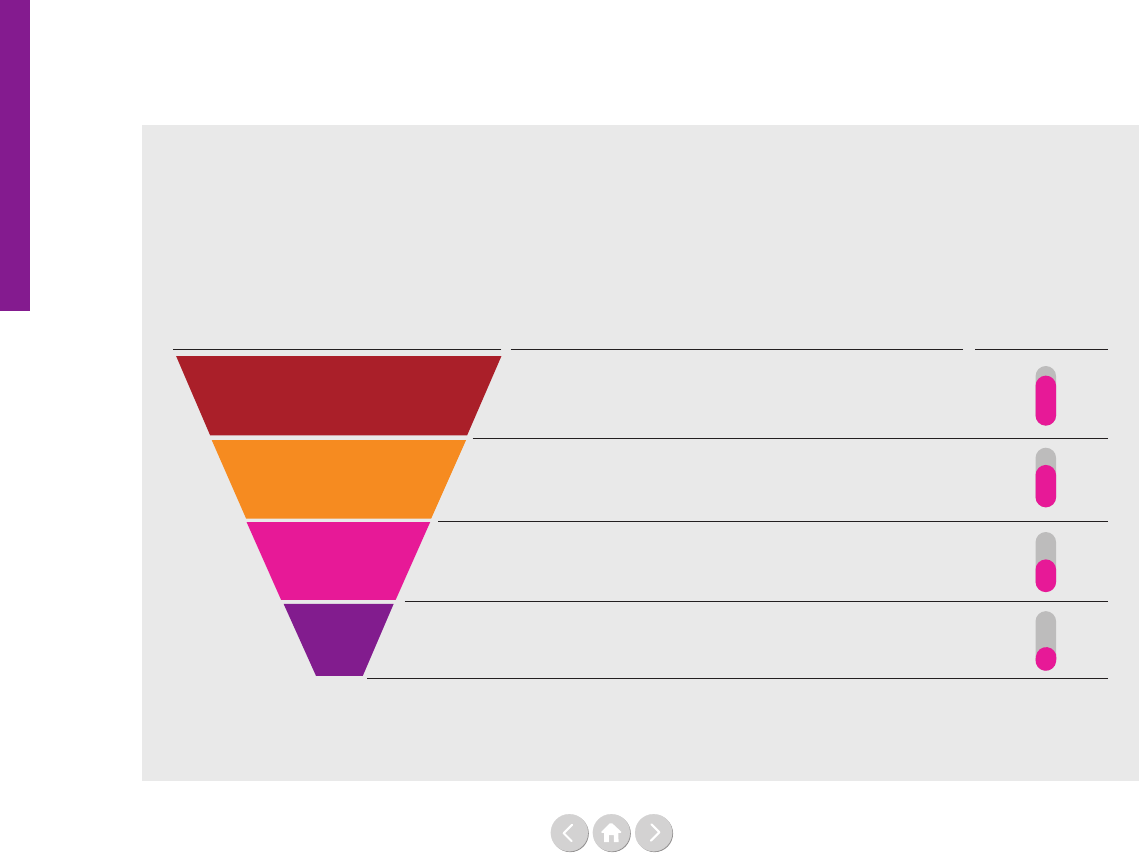
112
Making smart choices
February 2020. The draft resource mobilisation strategy
2019-2023, aims to increase nancing based on the
following four pillars to meet the nancial target set in
WHO’s investment case:
• employing tailored approaches to grow, diversify or
maintain funding from government partners;
• building eective partnerships and increasing
funding from philanthropic partners;
• maintaining and increasing funding from funds,inter-
national development banks, and multilaterals; and
• exploring innovative nancing and the funding
potential of revenue-producing activities.
Currently, projected income against the US$ 14.1 billion
target is US$ 4 billion, which includes income from
assessed contributions and long-term pledges. This means
WHO needs to raise US$ 10.1 billion (see Figure 1
on the previous page) for the next ve years. Despite
the overall nancing situation being positive, funds are
not evenly distributed between major oces and across
the programmes and results structure due to earmarking
of voluntary contributions and internal mechanisms for
distribution of funds.
Additionally, nancing from exible funds currently
covers approximately one third of the programme
budget requirements. As stressed in the GPW 13, ‘the
quality of funds is almost as important as their quantity’
– not least given the need for WHO to work in an inte-
grated manner to deliver programme results. Within the
US$ 14.1 billion needed to ensure successful implemen-
tation of GPW 13, appropriate levels of exible, aligned
and predictable funding will be critical. To ensure that
WHO is t for purpose under the transformation agenda,
all of the above approaches will therefore build on the
concepts of improving the quality of funding
(including increased predictability and exibility),
increasing funding potential at country level and
strengthening overall resource coordination.
Thematic and strategic funds
One of the highlighted initiatives to improve the quality
of funding, whilst meeting partner expectations, is the
greater emphasis placed on thematic and strategic fund-
ing. This funding aims to meet partners’ requirements
for reporting, visibility and accountability, while pro-
viding more eective and ecient earmarked funding
for WHO. Figure 2 below captures at a high level the
proposed options for the types of themes that partners
could explore with WHO, based both on their require-
ments and on meeting the Organization’s funding goals.
In 2018, WHO started recording, and will continue to
advocate for, contributions which meet the exible
nature of thematic funds along with contributions that
are negotiated at a corporate level and in so doing meet
the strategic needs of partners and the Organization.
Figure 2: Proposed thematic and strategic engagement funding model to
finance GPW 13 and Programme Budget 2020–2021
Source: World Health Organization (WHO)
Available options for thematic funding windows
01
02
03
04
Options Sources and approach Flexibility level
Triple billion targets
Formulation of one high-level thematic funding window
per triple billion target
PB 2020-21 results framework
Definition of thematic funding windows based on the outcome
and output structure as per proposed PB 2020-2021
GPW 13 Impact Framework
Development of thematic funding windows based on
GPW13 Impact Framework
Cross-cutting themes
Derivation of 30-40 cross-cutting themes based on
output structure as per proposed PB 2020-2021

113
Making smart choices
Partner Visibility
Under Partner Visibility WHO has recently been
focusing on attracting a wider contributor base, helping
to ensure more exible and increased overall funding,
improving recognition for its partners’ contributions to
WHO’s work and providing a higher overall level of
partner visibility.
To satisfy these needs in the short-term, WHO has started
developing dedicated impact sheets for some of its key
partners, highlighting joint achievements through inspiring
and concise stories on new projects, agreements reached
and impacts achieved. This initiative has so far been well
received by its partners and their related key stakeholders.
WHO will continue to develop impact sheets/webpages
for additional key partners going forward.
In the medium term, however, WHO is striving for
a more holistic and systematic approach to increasing
visibility for its partners with the ambition to make
visibility an integral part of WHO’s strategic engagement
with partners. In so doing and as a rst step, partner
recognition guidelines to support greater visibility have
been developed and communicated with all WHO sta
involved in resource mobilisation, communications and
partner engagement across the three levels of the organ-
isation. This is intended to ensure alignment and give
guidance on future visibility measures.
Inaugural partners forum
Building on the lessons learned from the Financing
Dialogue, and against the background of the ambitious
goals set by GPW 13, WHO, together with the Govern-
ment of Sweden, launched the ‘Inaugural WHO Partners
Forum’ in Sweden in April 2019.
With more than 200 participants, including representa-
tives of Member States, intergovernmental organisations
and relevant non-state actors (academic institutions,
civil society organisations, philanthropic foundations
and private sector entities), the event oered a unique
opportunity for participants to inform WHO’s strategic
direction. The event was also an important element of
the Director-General’s vision of a WHO that is more
open, transparent, collaborative and innovative.
Participants acknowledged the importance of supporting
WHO to realise its vision, meet its triple billion targets
and to address both the quality and quantity of resources
required as specied in the investment case to implement
GPW 13 and, in so doing, to lead implementation of the
health-related SDGs. In this respect, participants welcomed
WHO eorts to enhance collaboration with its partners
through its innovative ‘multi-year collaborative endeavour’,
including annual partners fora and focus group discussions
with experts from a wide variety of sectors.
As part of the outcome of the Inaugural WHO Partners
Forum, participants also highlighted recommendations for
WHO and its partners on partnerships and ecient and
eective nancing, with an emphasis on predictability
and exibility. These recommendations include:
• • improving eective partnership - participants
• recommended that WHO better enable countries
• to lead their health programmes but take a stronger
• role in coordination, advocacy and communica-
• tions, while also standardising processes to reduce
• transaction costs. For partners, participants felt
• they should better dene their added value; set
• objectives and project parameters in partnership
• with WHO; and better coordinate with others and
• ensure sustainability.
• • improving eective nancing of WHO - partici-
• pants believed WHO should do more to dene
• its impact and return on investment; look at
• new models to nance interventions; be a stronger
• advocate for greater domestic investment in
• health; and focus on securing more exible fund-
• ing. The priorities that participants felt were
• important for partners included nancing
• programmes that also address factors that impact
• health; pooling resources with others; leveraging
• WHO’s other values beyond funding and focus
• more on national ownership of health
• programmes and nancing.
With regard to WHO’s longer-term collaborative
endeavour, many felt the event represented a ‘good start’
to a more collaborative and open approach by WHO
and asked WHO to continue the dialogue in the
following months and years to come. For example, some
participants suggested follow-up ‘touch points’ on topics
such as exible funding, working with civil society and
better engagement with the private sector be explored.
The importance of an annual Partners Forum was also
emphasised by many participants. A general desire was
expressed for in-depth discussions and an opportunity to
seek new perspectives.
Outcomes
The meeting resulted in the following:
1. An energised and diverse community of partners
to further support WHO over the coming ve
years to secure the resources necessary to deliver
GPW 13;
2. Shared understanding of how to strengthen
partnerships and improve the eective nancing
of WHO, with an emphasis on predictability and
exibility; and,
3. Enhanced trust and condence in a transformed,
impactful and value for money WHO.
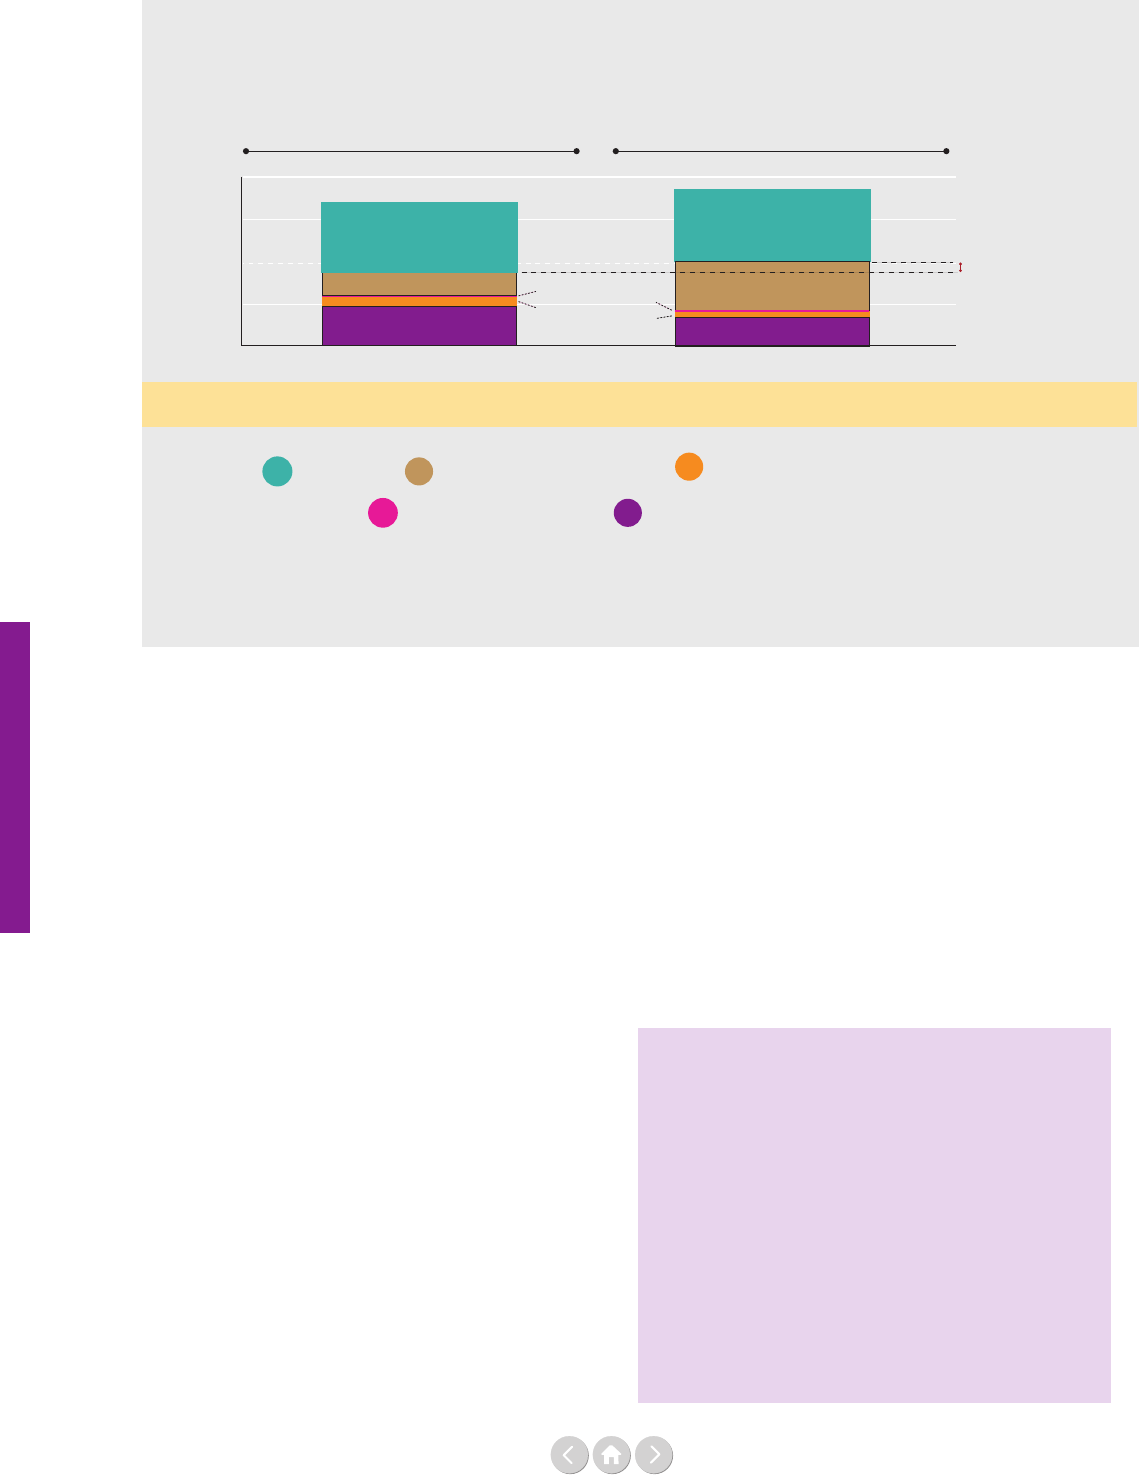
114
Making smart choices
What has the impact
of all these actions been so far?
The current nancial outlook for the approved Pro-
gramme Budget 2020-2021 already shows an improve-
ment. As shown in Figure 3 above, projected nancing
levels for 2020-2021 are higher than what was projected
for 2018-2019 at a similar point in the biennium (55%
versus 52% or an increase of US$ 312.3 million increase
in available funding for the base Programme Budget
2020–2021 as of 31 December 2018 compared with the
available funding for Programme Budget 2018–2019 as
of 31 December 2016).
The forecasted increase in funding levels not only high-
lights the role that traditional contributors can play in
providing additional funding, but also emphasises that
new contributors and innovative nancing mechanisms
are expected to play a larger role in bridging the gap in
nancing WHO for the next 5 years.
Conclusion
While WHO’s GPW 13 and transformation agenda
are at the early stages of implementation, the above
actions have started to show some promise in the area
of resource mobilisation. Nonetheless, monitoring and
evaluating the true impact of all of these eorts will take
time. Rather, the introduction of the described initiatives
should be considered as the beginning of a shared
Figure 3: How realistic is the budget increase for
2020-21? Comparison of projected financing levels
Source: World Health Organization (WHO)
Note: Comparison of projected nancing levels for Programme Budgets 2018–2019 and 2020–2021 (US$ million)
4,000
3,400
2018-2019
2018-19 base budget
(as of Dec 2016)
2020-2021
2020-21 base budget
(as of Dec 2018)
48%
45%
23%
25%
18%
28%
1%
5%
5%
3,769
312.3
3,000
2,000
1,000
US$ million
Financing
levels
Shortfall
Voluntary contributions specified
Thematic and strategic engagement funds
Voluntary core contributions
Assessed contributions
Higher projected financing
levels can largely be explained
by increases from Germany,
the UK, the European
Commission, Japan and Gavi.
52% 55%
2%
journey between WHO and its partners. It can neither
endure nor advance without trust. Trust is built and
maintained by many small actions over time and WHO
needs to continue to do its utmost if the organisation
wants to successfully deliver on its ambitious ve-year
strategic plan, full its mission and ‘leave no one behind’.
Footnotes
1
World Health Organization (WHO), ‘WHO launches first
investment case to save up to 30 million lives’,
(news release, WHO, 19 September 2018).
https://www.who.int/news-room/detail/19-09-2018-
who-launches-first-investment-case-to-save-up-to-30-mil-
lion-lives
2
World Health Organization (WHO),
‘Towards a Global Action Plan for healthy lives and
well-being for all: Uniting to accelerate progress towards
the health-related SDGs’, (report, WHO, 2018).
https://apps.who.int/iris/handle/10665/311667

115
Making smart choices
Guido Schmidt-Traub is Executive Director of the
UN Sustainable Development Solutions Network
(SDSN), which operates under the auspices of the
UN Secretary-General to support the implemen-
tation of the Sustainable Development Goals and
the Paris climate agreement. He leads the SDSN’s
policy work with a particular focus on sustainable
land-use and food systems; nancing for develop-
ment; and the SDG Index and Dashboards.
Lessons from health
on how to invest wisely in development
By Guido Schmidt-Traub
In a recent International Monetary Fund (IMF) study,
the head of the IMF’s Fiscal Aairs Department and his
colleagues show that achieving the Sustainable Develop-
ment Goals (SDGs) will require a large increase in public
and private investments.¹ Low-income developing
countries with average per capita incomes below
US$ 2,700 per year cannot nance these investments
out of domestic resources or debt nancing alone – even
though domestic resource mobilisation can and needs to
be expanded substantially in many countries. Neither
will the private sector come to the rescue, as many SDG
investments cannot generate commercial returns. The
IMF concludes that Ocial Development Assistance
(ODA) and other forms of concessional nance must
increase if the SDGs are to be achieved, a point also
echoed in a 2018 report by the Sustainable Development
Solutions Network.²
The IMF conclusions run counter to the prevailing
zeitgeist shaped by tight budgets in many traditional
donor countries, growing opposition to multilateralism
and a rising belief in the power of markets to solve
complex development problems. ODA is seen by some
as a relic of the past, and many donor agencies’ strategies
centre around blended nance. Public acceptability of
aid is falling. Meanwhile, large volumes of additional
development nance have been mobilised by China and
other new development partners, but these resources fo-
cus on infrastructure and other investments that generate
high economic returns.
If the IMF’s call for more ODA is to be heeded, we need
to answer two critical questions. The rst issue concerns
the eectiveness of aid. How can taxpayers and policy-
makers be convinced that their tax dollars generate high
returns and go towards the countries most in need?
As discussed below the answer to this question will inter
alia require greater volumes of high-quality multilateral
aid. So the second issue becomes how to convince
China and other providers of large volumes of develop-
ment assistance who are not part of the Organisation for
Economic Co-operation and Development’s Develop-
ment Assistance Committee (OECD-DAC), the ‘club’ of
traditional donors, to provide more concessional nance
for the development needs identied in the IMF study.
The health sector pointing a way forward
The aid community has been discussing criteria for aid
eectiveness for a long time, giving rise to the 2005 Paris
Principles of Aid Eectiveness and the Busan Decla-
ration, which underscore the importance of national
ownership and result-based nancing. These principles
are important, but they do not address some of the most
critical questions and trade-os for Ocial Develop-
ment Assistance under the SDGs. Fortunately, the
experiences of the health sector, specically the large
increases in spending on combating infectious diseases
and increasing access to vaccination under the Millenni-
um Development Goals, point towards a way forward.
When G7 governments willed the means to tackle
the HIV/AIDS pandemic, address malaria and combat
tuberculosis at their 2001 summit in Genoa, the need
for increased international nancing was clear and well
established. However, most observers questioned that the
funds could be invested eectively, as countries lacked
the capacity to design and implement eective national-
scale programmes.³ These concerns were warranted since
no resource-poor country had undertaken the needed
scaling up of public health interventions.

116
Making smart choices
Indeed, the knowledge of how to design and implement
ambitious national scale programmes did not exist.
Creating ‘quality demand’ and ensuring eective use of
resources were therefore the greatest challenges in the
health community.
Remarkably and against widespread expectations, the
health sector succeeded in generating such quality
demand in a short period of time. The US President’s
Emergency Plan for AIDS Relief (PEPFAR) programme
started disbursing funds in 2002 and the Global Fund
to Fight AIDS, Tuberculosis and Malaria followed in
January 2003. By the time of Round 8 in 2008, the
knowledge of how to design and implement ambitious
national-scale programmes had spread to virtually all
countries in the world.
This success was made possible in large measure due to
the unique design principles of the Global Fund shared
also by the Global Alliance for Vaccines and Immuni-
zation (Gavi).⁴ However, the set-up and functioning of
these two institutions are surprisingly unknown outside
the health community. For example, when the Sustain-
able Development Solutions Network convened a
meeting of all head of multilateral sector nancing
institutions in late 2014 in the run-up to the Addis
Ababa conference on Financing for Development, this
was the rst time many of these organisations met or
spoke with one another. All admired the Global Fund for
its capacity to attract large volumes of donor nancing,
but they did not understand how the fund operates or
how lessons might be applied to their own mechanism,
even though they all shared essentially the same donors.
It is therefore worth reviewing the design principles of
the Global Fund (and Gavi) briey.
Unique design features of the Global Fund
During the rst ten years of its existence the Glob-
al Fund ran a demand discovery process, which was
replaced in 2011 by a more traditional allocation-based
system. During this ‘rounds-based mechanism’, eligible
countries could submit funding proposals for each of the
three diseases asking for as much money as they thought
was needed. The Global Fund did not specify a model or
check-list for the applications, so countries were encour-
aged to innovate. To ensure broad buy-in in every
country, applications had to be approved by a specically-
designed Country Coordinating Mechanism, comprising
representatives from government and other stakeholders,
including people living with the diseases.
Members of the Global Fund’s independent Technical
Review Panel (TRP) reviewed all country proposals and
scored them on their technical merit. During the early
years, TRP members were instructed to consider only
the technical merit of the proposal and not its nancing
requirements. Since countries’ proposals fell into one of
three disease categories, TRP members could compare
all proposals for malaria, tuberculosis or AIDS, which
allowed for direct comparison and benchmarking.
The Global Fund Board then voted on the funding
recommendations of the TRP. In an important twist the
Board was only allowed to approve or reject the entirety
of TRP recommendations. This prevented picking o
individual country proposals on political or other grounds
and ensured that funding decisions were grounded solely
in the technical quality of each proposal, as determined
by the TRP. And since all proposals and TRP recom-
mendations became public, countries could quickly
learn from successful proposals. The TRP worked with
‘technical partners’, including the World Health Organi-
zation (WHO), the Joint United Nations Programme on
HIV/AIDS (UNAIDS), Roll-Back Malaria, the United
Nations Children’s Fund (UNICEF) and many bilateral
technical cooperation agencies to distil lessons from each
round, so that they could be incorporated into subsequent
funding proposals. Finally, Global Fund-funded pro-
grammes were audited to ensure sound use of resources
and subject to independent evaluations to distil and
publish lessons from implementation.
In collaboration with PEPFAR, the Global Fund
enabled a rapid scaling up of resources to the health
sector. But it also turned down many funding requests,
such as China’s rst two applications for AIDS funding.
The two proposals were deemed technically unsound by
the TRP because they lacked needle exchange pro-
grammes for injecting drug users (‘harm reduction’).
The TRP did not recommend them for funding despite
vocal opposition from the Government.⁵ In response, the
Chinese government changed its approach to tackling
the disease and experienced dramatic improvements in
health outcomes, which have been credited in parts to
establishment of an independent Country Coordination
Mechanism.⁶ Similar policy reversals and public health
successes were observed in Russia, Eastern Europe,
but also in the poorest countries of the world. Such
impact would not be conceivable for multi- or bilat-
eral programmes that lack truly independent technical
evaluation of funding proposals and could therefore not
entirely turn down funding request without generating
political fallout.
Fostering innovation and learning
A nal critical feature of the Global Fund is its support
for innovation and experimentation. Funds can be
disbursed to any type of partner approved by the
Country Coordinating Mechanisms, including govern-
ment entities, local or international non-governmental
organisations, businesses or international organisations.
This has enabled countries to choose dierent routes

117
Making smart choices
towards success and to divide up work among the enti-
ties best suited. For example, while the health ministry
might manage funds for treatment programmes oered
through the country’s health system, local non-govern-
mental organisations might be best placed to promote
awareness, prevention and testing among vulnerable
populations.
In countries with weak governments, treatment can be
provided through other partners, as illustrated by the
successful tuberculosis (TB) treatment programme in
Somalia operated by Médecins Sans Frontières (MSF)
with funding from the Global Fund. Remarkably, fragile
states and the poorest countries fare as well as others in
attracting Global Fund resources and generating results
under the programmes.⁷ This sets the Global Fund apart
from funding mechanisms in other sectors, which usually
do not cater to the full range of countries.
Through its unique design, the Global Fund has
managed to deal with an important dilemma of interna-
tional development cooperation. It has reconciled
national ownership with results-based nancing and
strict accountability for how funds are spent. The
demand discovery process without ex-ante country
allocations has encouraged national ownership, while the
TRP ensured that funds would only go to programmes
adhering to the latest best practice. Rigorous and
systematic audits with tough penalties for misuse of
funds ensured full accountability. In this sense, the Global
Fund has been a tough donor without undermining
national ownership and initiative on the design of
programmes. In my experience both donor and recipient
countries have been very happy with this balance struck
by the Global Fund.
Since its creation in 2002, the Global Fund has fostered
tremendous innovation and learning. Whereas in 2001
governments and the international community did not
know how to design and implement national-scale
programmes to treat and control the diseases, this has
now become common practice across the developing
world. While ‘quality demand’ has become ubiquitous
for the three infectious diseases and vaccine programmes,
there has not been a similar transformation in educa-
tion and other sectors. Whereas health sector ocials in
developing countries can describe the nest operational
details of their scaling up strategies, most other sectors
lack this operational knowledge. The experience from
health suggests that this decit is in parts due to the fact
that these sectors lack dedicated nancing mechanisms
with the design features of the Global Fund.
Therefore, sector nancing mechanisms, such as the
Global Environment Facility, the Green Climate Fund,
the Global Partnership for Education, the International
Fund for Agricultural Development and many more
should study the design features of the Global Fund.
While the model needs to be tailored to individual
sectors, the key design principles apply across sectors:
national multi-stakeholder processes to design pro-
grammes; rigorous independent technical evaluation of
proposals; en bloc funding decisions; ability to provide
funding to dierent types of recipient organisations;
no earmarked funding; ability to operate across fragile
as well as non-fragile countries; long-term, predictable
funding; and systematic and rigorous auditing and tech
nical evaluation of programmes.
The rise of new development partners
The Global Fund experience illustrates the manifold
advantages of well-designed multilateral nancing mech-
anisms. They oer far lower transaction costs compared
to the same volume of funding going through a large
number of bilateral programmes. Moreover, and this is
critical, they can uphold independent technical reviews
of proposals as well as results-based nancing in ways
that are hard to replicate for bilateral programmes, which
are invariably more inuenced by political considerations
on both the donor and recipient sides.
This takes us to the second critical challenge for today’s
international development cooperation, which is how to
promote multilateral approaches to meeting the nanc-
ing challenge of the SDGs and to increase the overall
volume of concessional development nance. The recent
and much welcomed rise of China as a major provider
of international development nance might lead to a
bifurcation. Either, multilateral nancing mechanisms
can adapt to welcome China and other ‘new develop-
ment partners’ on their boards and among their donors,
or the former become relegated to being mechanisms
of the OECD-DAC members only, which represent a
shrinking share of world gross product.
To date, China has not played an active role in the
Global Fund. This is partly driven by suspicion on both
sides, but the governance of the fund would allow for
full Chinese participation in the board. Of course, such
full participation should also be conditional on China
providing a fair share of nancing to the Global Fund.
In turn, China should have the same say as other donors
on the board.
For other multilateral nancing mechanisms, the challenge
will be to increase the role played by independent
technical evaluation and, correspondingly, to reduce the
discretion enjoyed by individual board members in
promoting and approving individual funding proposals.
The Global Fund provides a model that should be
studied in particular by convention-based nancing
mechanisms.

118
Making smart choices
Emulating and improving
the Global Fund governance model
We live at a time when demand for development assis-
tance is more focused on the poorest countries, but as
shown by the IMF, substantial increases in concessional
international nance will be needed. At a time of
stagnating aid budgets and a falling share of world gross
product accounted for by members of the OECD-DAC,
we need to ask hard questions about how development
assistance can be made more eective and transparent in
the eyes of taxpayers.
The Global Fund to Fight AIDS, Tuberculosis and
Malaria provides an important model in two ways.
On the one hand it has succeeded in generating quality
demand and ensuring results-based nancing across a
broad spectrum of countries. These lessons can be applied
to non-health SDG investment priorities identied by
the IMF and others. On the other hand, the Global
Fund’s governance model should allow China and other
new development partners to join as funders on an equal
footing. It may provide a model that other nancing
mechanisms can emulate to ensure ecient and wise
investments in development.
The October 2019 replenishment round of the Global
Fund provides an important opportunity for the inter-
national community to become more familiar with its
unique design principles and to consider their applica-
tion in other sectors and nancing mechanisms. It is of
course also a critical opportunity for traditional OECD-
DAC donors, but also new development partners and
private philanthropy to recognise the unique achieve-
ment of the Global Fund and to meet its full funding
needs to end the three diseases and strengthen health
systems. A successful replenishment round of the Global
Fund will not only set the world on course for achiev-
ing SDG 3 on health, but it will also send a strong signal
that the international community is rallying around the
Sustainable Development Goals.
Footnotes
¹ Vitor Gaspar, David Amaglobeli, Mercedes Garcia-Escribano,
Delphine Prady, and Mauricio Soto, ‘Fiscal Policy and Develop-
ment: Human, Social, and Physical Investment for the SDGs’,
(IMF Staff Discussion Note SDN/19/3, International
Monetary Fund, 23 January 2019).
² Jeffrey D. Sachs, Vanessa Fajans-Turner, Taylor Smith,
Cara Kennedy-Cuomo, Teresa Parejo, and Siamak Sam Loni,
‘Closing the SDG Budget Gap’, (report, Move Humanity and
Sustainable Development Solutions Network, 2018).
http://unsdsn.org/resources/publications/closing-the-sdg-bud-
get-gap/
³ Jeffrey D. Sachs and Guido Schmidt-Traub, ‘Global Fund
lessons for Sustainable Development Goals’,
(academic article, Science, 7 April 2017), p32–33.
https://doi.org/10.1126/science.aai9380
⁴ Jeffrey D. Sachs, and Guido Schmidt-Traub,
‘Global Fund lessons for Sustainable Development Goals’,
p32–33. See Footnote 3.
⁵ Ru-Bo Wang, Qing-Feng Zhang, Bin Zheng, Zhi-Gui Xia,
S.-S. Zhou, Lin-Hua Tang, Qi Gao, Li-Ying Wang, and
Rong-Rong Wang, ‘Transition from control to elimination:
impact of the 10-year global fund project on malaria
control and elimination in China’, (academic article, Advances
in Parasitology, 2 December 2014), p289–318.
https://doi.org/10.1016/B978-0-12-800869-0.00011-1
⁶ Ren Minghui, Fabio Scano, Catherine Sozi, and Bernhard
Schwartländer, ‘The Global Fund in China: success beyond the
numbers’, (academic article, The Lancet Global Health,
February, 2015), e75–e77.
https://doi.org/10.1016/S2214-109X(14)70366-3
⁷ Guido Schmidt-Traub, ‘The role of the Technical Review
Panel of the Global Fund to Fight HIV/AIDS, Tuberculosis and
Malaria: an analysis of grant recommendations’,
(academic article, Health Policy and Planning, 4 January 2018),
p335–344. https://doi.org/10.1093/heapol/czx186

119
Making smart choices
Current and future pathways
for UN system-wide finance
By Silke Weinlich and Bruce Jenks
Silke Weinlich is a Senior Researcher at the
German Development Institute (Deutsches Institut
für Entwicklungspolitik - DIE). She is a member of
the research programme on Inter- and Trans-
national Cooperation with the Global South where
she leads a project on the UN development system
and its reform needs. Current research interests
include the reform of the UNDS and broader
questions of multilateral development cooperation,
South-South cooperation and the UN, as well as
questions of global governance.
Bruce Jenks is a Senior Advisor at the Dag
Hammarskjöld Foundation. He has been an adjunct
professor at the Columbia University School of
International and Public Aairs since 2010.
He is also a visiting Professor at the University of
Geneva’s International Organisation MBA
programme. Jenks has co-authored studies on
‘UN Development at a Crossroads’, on ‘Rethink-
ing the UN for a Networked World’ and on the
future of multilateralism. He has been co-lead for
ve successive annual reports on the ‘Financing the
UN Development System’. Bruce Jenks served as
Assistant Secretary-General at UNDP, responsible
for UNDP’s relationship with its Executive Board,
as well as its donors. He has a PhD from Oxford
University. He has been a guest speaker at univer-
sities and conferences in over 50 countries and has
authored numerous articles and policy papers.
The reform agenda for the UN development system
(UNDS) has been dominated for some 30 years by
analyses and initiatives relating to coherence. The most
signicant reform proposal during this period – the
Delivering as One initiative – was contained in a report
dubbed the Coherence Report. Reform has been clearly
associated with organisational and structural reform: how
can an overly complex system comprising more than
thirty entities that dier in size, mandate and governance
be consolidated or, at minimum, better coordinated?
The role of system-wide nancing has tended to be
treated separately from discussions about coherence. In a
way, coherence discussions circled around how to address
the eects created by the erosion of a central funding
vehicle (a role originally envisaged for the United
Nations Development Programme (UNDP)) and the
centrifugal forces unleashed by restrictive forms of ear-
marked funding from the 1990s on. They neglected to fully
explore how and which kinds of system-wide funding can
create incentives to help the UN system work eectively
together and make better use of its collective assets.
The Secretary General’s UNDS reform proposals and
the Funding Compact have put back on the table the
importance of system-level funding as a fundamental
component of a reform agenda. The Funding Compact
formulates targets for pooled funds amounting to
US$ 1.1 billion annually. Pooled funds have emerged
as an important mechanism benetting the system as a
whole, as well as individual entities. The reform proposals
introduce an innovative levy to counter fragmentation,
and make entities foot a larger part of the cost for run-
ning the resident coordinator system. There also exist
other forms of system-wide funding that it is worth-
while reecting upon. Moreover, in the long run, ways
must be found to further incentivise system-wide
strategic nance. This is the nance that is required to
position the UN as a system in a rapidly changing world.
This paper is organised into three parts: Part l discusses
the need to go beyond the core vs non-core conundrum
and Part ll identies ve approaches to UN development
system nance that merit closer attention: pooled fund-
ing, funding the revised United Nations Development
Assistance Framework (UNDAF), fees for managing
globalisation, nancing fulcrums and levers, and resourc-
es for institutional strengthening within the UNDS.
Part lll details the ve dierent instruments that com-
prise the Secretary General’s Funding Compact:

120
Making smart choices
the Special Purpose Trust Fund (SPTF) for the Resident
Coordinator System, charging agencies, the levy on
fragmentation, a contribution to the Peacebuilding Fund,
and the Joint Fund for the 2030 Agenda.
1. Core vs non-core: Beyond a stagnant duality
Reform in the nancing of the UNDS has been
dominated by the evolving relationship between core
and non-core nance. Core contributions are general
purpose funding; they lose their national identity and
are comingled without restrictions. They are used and
allocated as each organisation sees t, in accordance with
the specic mandates as well as guidelines, priorities
and goals established by governing bodies. While core
contributions for specialised agencies come in assessed
and voluntary forms, for funds and programmes they are
only voluntary in nature. In the 1990s, funding patterns
to the UN development systems began to change dras-
tically. From the mid-1990s on, non-core contributions
have exceeded core funds for many UN agencies. Non-
core funding may come in many varieties but has three
common features: it is voluntary, contributors specify a
purpose for its usage, and regular multilateral governance
bodies are not responsible for its allocation.
For a very long time, the battle cry of UN agencies and
many UN Member States alike has been to underline
the crucial role of core as the bedrock of the multilat-
eral development system, calling for an increase in the
share of core contributions. Indeed, restrictive forms of
earmarked funding come with challenges for individual
agencies and the UN system as a whole, as well as the
work they engage in. Nearly three decades of an increas-
ingly lopsided ratio of core – non-core contributions
have left profound traces (see the Baumann, Lundsgaarde
and Weinlich contribution in this chapter). The need
to increase the ratio of core and pooled funding in the
total resource mix is directly addressed in the Funding
Compact.
However, to focus only on the duality between core
and non-core is unhelpful at a time when governments
might nd themselves hard-pressed to defend devel-
opment cooperation; it also obfuscates the potential of
non-core funding to encourage transformative change
for attaining the Sustainable Development Goals (SDGs).
It is time to go beyond the duality. This is not to say that
a secure basis of core funding would not be important
for all UNDS entities, nor to question the value of core
funding or negate the pressing need to increase the
number of (voluntary) core contributors for the multi-
lateral system to be sustainable in the long term. At the
same time, although the majority of earmarked funding
to the UNDS has been contributed in the most restrict-
ed form, earmarked funding in principle does not need
to be detrimental to UN entities and their capacities
to tackle global problems. If well-managed and aligned
with multilateral programmes, earmarked funds can also
strengthen multilateralism and the ability of UN entities
and the UNDS to help implement the 2030 Agenda.
This is particularly the case when looking at the nanc-
ing of UN system-wide initiatives.
At the system level there is a limited number of core
nancing mechanisms. Funding for entities with system-
level mandate such as the UN Development Coordina-
tion Oce (UNDCO) and the United Nations Oce for
the Coordination of Humanitarian Aairs (UNOCHA)
fall into this category. But broadly speaking the concept
of core nance is strongly related to entity-level nance.
The US$ 1.1 billion package for pooled funds referred
to earlier could be seen as a signicant departure from
previous practice. For system-wide nance to get roots,
it will be necessary to identify approaches that can
demonstrate in concrete terms how nance at the system
level can provide value and concrete benets for the
entity level.
2. Approaches to
UN development system-level finance
We have identied a range of approaches to the pursuit
of system-level nance. We want to note here that we
have focused on system-wide development nancing
and we have not included an analysis of humanitarian
system-wide nance. Nonetheless, it is important to note
that system-wide/pooled nancing of humanitarian
activities grew signicantly in 2018 to approximately
US$ 1.4 billion (US$ 550 million for the Central Emer-
gency Response Fund (CERF) plus US$ 900 million for
the humanitarian Country-based Pooled Funds). Still,
this is only about 10% of total UN humanitarian ows.
The most important function of system-wide funding is
that it provides incentives and/or facilitates collabo-
ration between UN entities within the system as a
whole. It may also attract interest from outside the UN
system. This, in itself, is very important in the light of the
demands for an integrated approach of the 2030 Agenda
and reverse incentives stemming from the current fund-
ing patterns. Bringing the UNDS more closely together
should not be seen as a key outcome in itself. In the end,
the ultimate aim is to make better use of the multilateral
assets for states and their citizens and build up the UN’s
joint ability to respond to global problems.
Before proceeding, it is important to emphasise that the
great bulk of nance should and will continue to ow at
the entity level. System-wide nance needs to be limited
and very strategic in intent. But if the UN is going to
be more than the sum of its parts, that ambition must
nd some form of nancial expression. It is critical that
opportunities to explore system-wide nance should be

121
Making smart choices
seen as complementary to, and not in competition with,
entity-level resource mobilisation eorts.
Pooled funding: Major instrument
Pooled funding is perhaps the major instrument available
for system-wide nancing (for fuller analysis see the rst
contribution in Chapter Two of this report). The Iraq
Recovery and Reconstruction Fund is an excellent
example of a pooled facility which attracted resources that
would not have been otherwise available to individual
entities. This lay the foundation for the creation and
function of the Multi-Partner Trust Fund Oce
(MPTFO). Meanwhile, the Spain – UNDP Millenni-
um Development Goal (MDG) Achievement Fund was
established specically on the premise that its design
would provide incentives for the UN system to work
together at the country level. The One UN Fund model,
the nancial vehicle for the Delivering as One initiative
at the country level, also got attention. But rather quick-
ly it proved very dicult to get substantial resources
into this vehicle and it became clear that this was not an
attractive vehicle from the standpoint of donors.
Pooled funding oers many advantages and this is
reected in the growth of the instrument and the
growth in the portfolio of the MPTFO. Selected trust
funds such as the Peacebuilding Fund already attract
contributions from a diverse group of governments;
the Funding Compact’s target to increase the number
of contributors will help further broaden the funding
base. It can be said that pooled funding is to system-level
nance what core funding is to entity nance; pooled
funding means that resources are not tied to a specic
entity and core resources mean that funding is not ear-
marked to a specic project/purpose.
Earmarked contributions for institutional strengthening
within the UNDS: Outdated or still relevant?
Losing some of the benets that arise from pooling
resources, individual contributors can also provide
targeted support to strengthen institutions and their
capacities for collaboration within the UNDS. When
UNDP was still responsible for the Resident Coordina-
tor (RC) system, earmarked contributions for instance
supported the selection, training or work of resident
coordinators, also in particular country contexts such
as conict-ridden states. Similarly, selected reform strands
such as the harmonisation of business practices or the
work of expert panels benetted from earmarked
resources.
It has always been a matter of debate whether such
activities should depend on resources from individual
contributors. Ideally, the recently established Resident
Coordinator fund (see the next page) will be in a
position to pay for all rising needs around the Resident
Coordinator system. It remains to be seen whether there
will be a willingness of contributors to foot the bill for
selected processes and support UNDCO with earmarked
funding if this is not the case.
Funding the new Cooperation Framework:
System-wide funding for system-wide programming
The revised UNDAF, now called UN Sustainable
Development Cooperation Framework (‘Cooperation
Framework’), is a core element of the ongoing reforms
and will develop into the UN system’s collective
response in support of a country’s priorities and needs
in implementing the 2030 Agenda.
If it is to enhance its role in nancing the SDGs, the
UN system will need to have a sound understanding of
the resources available to the country and the resources
it can leverage domestically. A clear nancing vision and
strategy is required, in particular at the country level.
The new Cooperation Framework is supposed to
provide this strategic direction and the focus needed for
joint resource mobilisation at the country level.
The Cooperation Framework if properly designed
should become the place where it is possible to interact
with and develop resource strategies at the system level
as it is represented at the country level. This is why it has
been given such a prominent place in the presentation of
the SG’s proposals on the repositioning of the UNDS.
In this context, going back to the denition of core
vs non-core, it is highly ironic that it is not possible to
make a core contribution to a cooperation framework.
Thanks to our denitions, this will always be categorised
as non-core despite the fact that there are few contribu-
tions that could more rightfully be dened as core than
paying to support the system-wide response to the needs
of a country.
Fees for managing globalisation:
New source for system-wide funding?
The World Intellectual Property Organization (WIPO)
gets more than 90% of its budget (US$ 380 million)
from fees paid for WIPO’s services in granting patents.
It should be noted that this income is not earmarked and
is relatively predictable due to the low degree of volatility
of WIPO’s volume of business.
The interesting point here is that WIPO provides an
immensely important service to companies in the form
of patents which protect their intellectual property. The
protection of patents can be seen as a specic function
associated with the logic of the globalisation process. It
follows that in this marketplace, the services required
are paid for by the companies. WIPO’s funding base has
thereby become much broader and goes beyond sources
usually tapped into by international organisations,

122
eg public money contributed by ministries of foreign
aairs and others.
With imagination, it should be possible to explore the
range of services provided by the UNDS which could
generate appropriate fees. This should not be understood
as a process of privatisation. Rather it is a process by
which the beneciaries of a global patent regime pay for
the costs of ensuring that this is a well-managed process.
Further studies are needed to assess what kind of services
come under consideration and to explore processes to
collect the fees.
Financing fulcrums and levers:
How do you nance leveraging?
The hot function nowadays is leveraging. There has been
a truly historic expansion over the last two decades in
the volume of resources owing to developing countries
and attention is focused on how to access and inuence
these massive ows. The multilateral development banks’
presentation in 2015 of ‘From Billions to Trillions’¹ was
an invitation to leverage their assets to go to scale in a
radically dierent way.
When leveraging is applied to the UN development
system, there tend to be blank faces in the room. The
UNDS does not have the size or type of nancial assets
that permit them to be taken seriously in the leveraging
business. This presents the UNDS with a critical challenge
that will determine its positioning in the future.
It is true that the UNDS only has very limited and
restricted nancial assets to leverage. But if the UNDS
deploys its core non-nancial assets with imagination
– that is its key functions in setting norms and standards
and contributing to a healthy enabling environment
– it could have a far-reaching impact.
The problem and the challenge ahead is that while
creating real value, there is no easy way to capture and
account for the results. What is the incentive for senior
sta to invest time and energy in leveraging an asset that
yields a result/impact which is not measured and cannot
be appropriated by the investor. The biggest hurdle to
eective reform is that the UNDS is governed by a set
of disincentives to achieving the results required. The
leveraging of non-nancial assets, and the capture and
measurement of their performance, needs to be at the
heart of UNDS repositioning. The system-wide strategic
document (SWSD) could be the place to lay this down
and make it concrete.
3. Dimensions of the Funding Compact
The Funding Compact envisages system-wide funding
amounting to some US$ 1.1 billion annually. This is
broken down as follows:
- US$ 281 million for the reformed RC system (the SPTF)
- US$ 500 million for the Peacebuilding Fund
- US$ 290 million for the Joint Fund for the 2030
Agenda (the Joint SDG Fund)
It should be noted that these proposals are being made
simultaneously at the time that the US$ 2.5 billion
regular budget of the UN nds itself with a shortfall of
US$ 500 million (20% of the overall regular budget)
as of the end of 2018. In addition, there are other cuts
and shortfalls in the peacekeeping and other budgets.
The Special Purpose Trust Fund (SPTF)
for the Resident Coordinator system
The establishment of a new voluntary nanced trust
fund represents the rst port of call for nancing the
new organisational arrangements that have been put in
place to support the reformed Resident Coordinator
system. The preference of the Secretariat was to subject
the nancing of these new organisational arrangements
to assessment, but a number of Member States did not
support this. Creating a voluntary nanced trust fund
was the next logical step.
The total income to the SPTF amounts to US$ 281
million. US$ 144 million represents direct contributions
to the SPTF and US$ 77 million represents amounts
charged to agencies. US$ 60 million represents income
from the new levy charged to earmarked funding.
It remains to be seen how reliable these dierent
channels of funding will prove to be.
Charging Agencies
As indicated above, US$ 77 million is to be charged to
the agencies according to a xed formula. This represents
a doubling in the existing amounts, all taken from
agencies’ core contributions. The original thinking
behind this was the idea that making a contribution
to the costs of running the RC system would help to
generate a sense of ownership and responsibility for the
management of the RC system.
It remains to be seen what the agencies might expect
in return for making these larger contributions. For
example, the ILO is expecting in return for increased
nancial contributions to support the RC function that
the principles of tripartism be reected in the national
consultation processes that the RC is involved in.
Making smart choices

123
The levy on fragmentation
Unlike the establishment of a new trust fund or increas-
ing the amount charged to agencies, the adoption of a
levy on fragmentation represents an interesting attempt
to engineer something new in the nancial architecture.
Fragmentation in this context means the dispersed
quality of project and programme funding that hampers
cooperation within the UNDS and can also have a
negative impact on the coherent work of individual UN
entities. The strategy behind the proposal for a levy to
nance the new RC system-wide costs is to turn the
UNDS’s greatest weakness into a source of nancial
strength. Fragmentation in a high-volume environment
opens up the possibility of generating considerable
income without it being onerous on any one party. The
proposal is to initiate a fee calculated at 1% of the project
budgets of tightly earmarked project funds.
On the one hand this is a fragmentation fee – a fee
which helps cover the costs of beneting from the global
infrastructure provided by the UNDS while contribut-
ing to fragmentation. On the other hand, this should be
an investment fee – a fee which provides for investment
in the sustainability of the UNDS infrastructure from
which all parties benet.
This should not be seen as a supplementary amount for
administrative overhead. This is a fee which recognises
that a rm institutional infrastructure is very much in
the interests of all users of the system. Only by sending
strong signals backed by hard numbers will it be possible
to transform the nancing system from being part of the
problem to part of the solution.
Contribution to the Peacebuilding Fund
The Funding Compact provides for US$ 500 million
annually to the Peacebuilding Fund (PBF). Perhaps of
particular interest is the proposal in the report of the
Advisory Commission on Sustaining Peace of charging
a 1% levy on all peacekeeping and special political
missions to be used to nance peacebuilding operations
and the call of the Secretary General for a ‘quantum
leap’ in funding levels to this global system-wide fund.
The PBF has invested in signicant strengthening of
programming rigor, delivery oversight, performance and
investment strategy, which is showing signs of return in
increasing capitalisation levels.
The Joint Fund for the 2030 Agenda
The Joint Fund for the 2030 Agenda (the Joint SDG
Fund) is a vehicle to support governments to advance
the SDGs. The particular aim of the Fund is to
incentivise integrated and transformational policy shifts.
This is explicitly a fund whose purpose is to provide
resources that can leverage catalytic investments.
The Fund is designed to be accessible to the UN
Country Teams (UNCTs) on a competitive basis.
The Financial Compact indicates an annual capitalisation
at US$ 290 million. The Joint SDG Fund has the
potential to be a transformational instrument. It oper-
ates at the system level, it provides access to resources on
a competitive basis and it is designed to leverage signi-
cant impacts.
The Joint SDG Fund is architecturally signicant;
whether it can sustain a successful resource mobilisation
strategy remains to be seen.
Conclusion
There is ample opportunity to identify approaches that
provide strategic openings at the system level. For
example, pooled funding often provides resources that
would not be provided at the entity level. The new
Cooperation Framework provides a frame of reference
that ensures programmatic coherence and credibility.
WIPO charges fees for providing a service function that
is associated with the process of globalisation, and the
newly established levy that forms part of the Secretary
General’s Funding Compact transforms the weaknesses
of fragmentation at the entity level into a strategic asset
at the system level.
It is time for system-level nance to be unleashed: not to
compete and undermine entity-level nance but in or-
der to demonstrate that the UNDS is indeed more than
the sum of its parts. The unleashing that is required does
not refer to the volume of resources but to providing the
system-wide incentives that will enable the UNDS to
adopt the transformational posture it so badly needs.
Footnote
¹ World Bank Group, ‘From billions to trillions: MDB
contributions to financing for development (English)’,
(report, World Bank Group, 2015).
http://documents.worldbank.org/curated/
en/602761467999349576/From-billions-to-tril-
lions-MDB-contributions-to-financing-for-development
Making smart choices
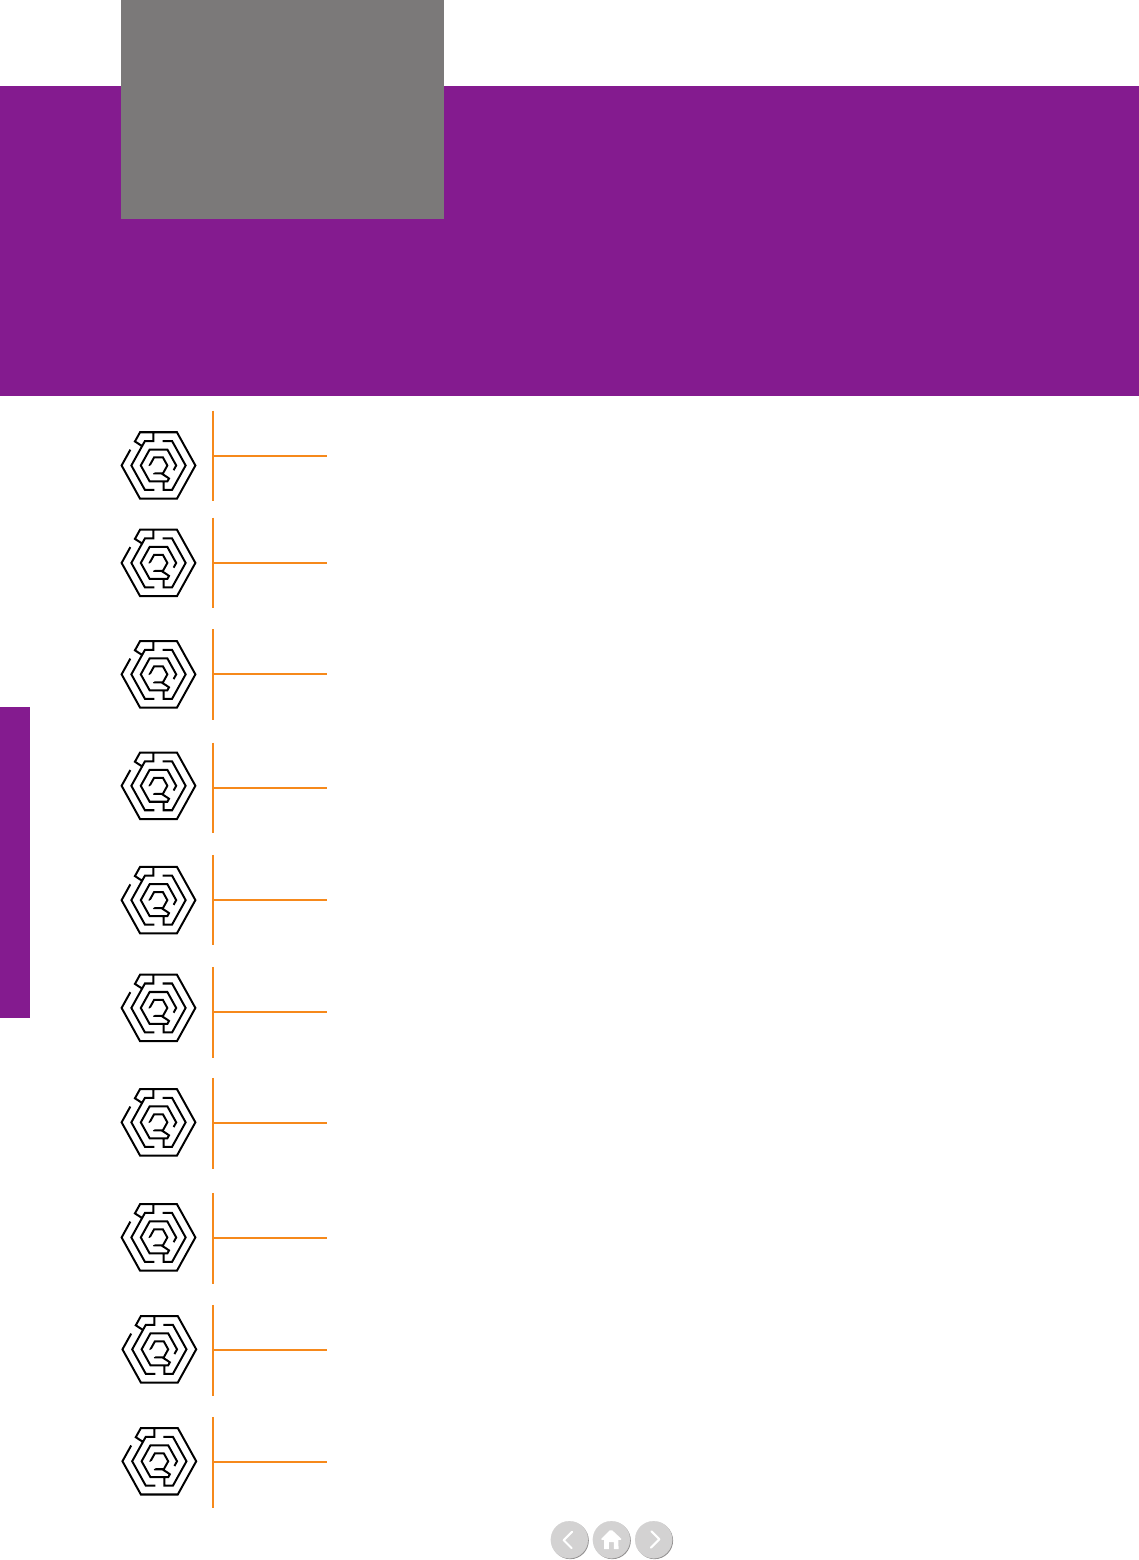
124
Time to invest
Financing peacebuilding,
humanitarian assistance and migration:
Time to invest
PART TWO
Chapter Three
Financing fit for the future: A 10-point Agenda for Financing Peacebuilding
by the Dag Hammarskjöld Foundation
The World Bank Group and IDA18: Scaling-up support to address Fragility, Conflict and Violence
by Franck Bousquet
Innovative finance for peacebuilding: It is time to invest
by Catherine Howell and Henk-Jan Brinkman
Official Development Assistance and peacebuilding: 10-year trends
by Ayham Al Maleh
How the Peacebuilding Fund is investing in the Sustainable Development Goals
by Laura Buzzoni and Henk-Jan Brinkman
OECD’s Total Official Support for Sustainable Development pilot study on peace and security
Financing the humanitarian-development-peace nexus
by the UN Multi-Partner Trust Fund Office (MPTFO)
Forecast-based financing: A breakthrough at last for humanitarian financing?
by Lana Zaki Nusseibeh
World Bank catastrophe bonds as an innovative development financing tool
by Michael Bennett and Rebeca Godoy
The Migration Fund: Building on the Global Compact for Safe, Orderly and Regular Migration
by Jonathan Prentice

125
Time to invest
The Dag Hammarskjöld Foundation is a
non-governmental organisation established in
memory of the second Secretary-General of the
United Nations. The Foundation aims to
advance dialogue and policy for sustainable
development, multilateralism and peace.
Financing fit for the future:
A 10-point Agenda
for Financing Peacebuilding
By the Dag Hammarskjöld Foundation
The parallel resolutions on Peacebuilding and Sustaining
peace, adopted in April 2016 by the UN Security
Council (S/RES/2282) and the General Assembly
(A/RES/70/262), emphasise ‘the need for predictable
and sustained nancing to United Nations peacebuild-
ing activities, including through increased contributions,
and strengthened partnerships with key stakeholders,
while also noting the signicance that non-monetary
contributions can play in peacebuilding eorts’.¹ The
Secretary-General’s 2018 report on implementation of
the resolutions pointed to discouraging trends in donor
funding that result in insucient resources dedicated to
addressing conict risks and to supporting countries
going through fragile transitions. The report made
several recommendations for advancing the application
of the Sustaining Peace framework and to address
existing gaps, including on nancing.
Positive steps have been taken and reforms continue
to be rolled out in response to the recommendations,
although there has been limited progress in imple-
mentation of those related to nancing. As part of the
18th replenishment of the International Development
Association (IDA18), the World Bank Group doubled
its nancing from US$ 7 to 14 billion for low-income
countries impacted by fragility, conict and violence
(FCV) and are in the process of developing a strategy
for addressing the underlying drivers of FCV through its
development eorts.
Beyond the need for additional resources for peace-
building, a radical rethink is needed on how nancing is
structured and how to leverage strong partnerships for
more eective resourcing. This paper outlines ten points
to help frame the issues that require attention and action
by the UN and its Member States in order to allow for
more ecient use of existing funds and to ensure that
sucient resources are available to full the commitment
of sustaining peace over the coming decades.²
1. In recognising peacebuilding as an inherently political
process (as stated in the resolutions³) Member States and
the UN must demonstrate a shared commitment to the
long-term and comprehensive approach needed for
sustaining peace, particularly at the country level.
• Member States and the UN should recognise peace-
building as inherently linked and fundamental to
achieving the Sustainable Development Goals of the
2030 Agenda.
• Member States should align themselves with
and/or provide the UN system with the exibility
needed to respond to shifting needs in eorts to
sustain peace with a long-term vision.
• Member States should acknowledge that support to
legitimate politics must be prioritised with
adequate funding and an enhanced understanding
of risks and risk mitigation.
2. Frameworks between the UN and Member States
covering risk management, nancial transparency and
accountability should be agreed upon and applied.
• Member States must acknowledge risk as an
unavoidable dimension of peacebuilding and apply
frameworks for risk management that include
contextual risks to domestic actors and not only
cover programmatic risks to aid providers and
conict sensitivity.
• Platforms should be identied at regional and
country level that allow the UN and other
relevant stakeholders to conduct integrated con-
ict and risk analyses and a systematic monitoring
of risks to promote a shared understanding and to
inform programming.
• The UN and Member States should support a
transparent, realistic and measurable set of national
priorities that are identied in dialogue with

126
Time to invest
national government and other relevant national
actors based on the Sustainable Development Goals
(and other agreed frameworks, including the new
Sustainable Development Cooperation Framework).
• Member States and the UN should institute mea-
sures that ensure dual nancial transparency and
account ability between the international
community and host government as well as between
governments and their citizens.
• Country level compacts could be used to support
dened priorities, aligning to national budgets with-
out having to accept budget support models, as well
as to identify mutual accountability frameworks and
commit to use of instruments.
3. Existing, new and innovative nancing should be
explored and utilised.
• With its unique mandate, the UN has a key role to
play in mobilising alternative resources for eorts to
sustain peace, including from philanthropic
institutions and the private sector. The humanitarian
and climate sectors are much more advanced in their
eorts to leverage new lines of funding; cross-
sectoral learning on innovative nancing approaches
is needed.
• There is a need to invest signicant resources in
research and development on the applicability of
innovative nance tools to fragile contexts. The
work of the UN Peacebuilding Support Oce
(PBSO) in this area should be supported and
expanded.
• The value, including return on investment, of
leveraging resources for peacebuilding needs to be
more prominently recognised, rewarded and
promoted, including Ocial Development
Assistance (ODA), and non-ODA sources.
4. Prioritise and invest in diverse partnerships building on
comparative advantages and recognised roles.
• Clarify and strengthen the relationships between the
UN and International Financial Institutions,
including regional development banks and new
donors, through enhanced legal arrangements,
improved operational coordination and
collaboration, and joint results monitoring.
• The UN should continue to strengthen its partner-
ship with the World Bank (WB) at all levels,
with UN country teams under the leadership of the
Resident Coordinator liaising more closely with
WB country directors and jointly making eorts to
operationalise the recommendations from the joint
UN-WB study Pathways for Peace.⁴
• Develop new and expand existing partnerships with
regional and sub-regional organisations, ensuring
that these are institutionally grounded and demon-
strate mutual respect.
• Partnerships with private sector actors can grant
access to greater resources, innovation, employment
opportunities etc, but should also be pursued with
caution, ensuring that appropriate regulatory frame-
works are in place and complemented with eorts
to strengthen inclusive institutions as well as long-
term policies that address economic, social and
political aspirations of all segments of society.
5. Member States must demonstrate renewed nancial
commitment to the long-term endeavour of building peace
and preventing armed conict by:
• ensuring predictability over time of nancing for
peacebuilding through multi-year commitments and
increased use of joint funding instruments;
• allowing assessed contributions for peacekeeping to
be used for programmatic peacebuilding activities;
and
• prioritising support for core government functions
over a sustained period of time, particularly in
countries recovering from violent conict, ensuring
that assistance strengthens national capacity, builds
country systems and is based on national ownership.
6. Financial instruments dedicated for peacebuilding and
conict prevention should be enhanced and used.
• To retain the ability to respond to shifting needs
rapidly and eectively, Member States must ensure
that global nancing mechanisms, such as the Peace-
building Fund, are funded at an agreed level based
on annual estimations.
• The UN should utilise joint funding mechanisms
at country level that ease the burden on local actors
and help Member States pool risk and resources.
• Member States and the UN should address
duplication and fragmentation by merging existing
mechanisms for nancing peacebuilding at country
level.
• Given the high costs associated with intervention in
conict-aected countries there is a need to
optimise the ‘preventive impact’ of all funding.
A better analysis of funding in general and its
relationship to conict prevention, including human
rights, could assist in this.
7. Financial strategies should include provisions for
deepening inclusivity.
• Member States and the UN must recognise
exclusion as a primary driver of conict and ensure
nancing strategies support legitimate and inclusive
national peacebuilding processes that are true to the
principle to ‘leave no one behind’.
• Member States and the UN should take stronger
measures to implement S/RES/1325⁵ and ensure
that a minimum of 15% of global nancing for
peace-building is dedicated to initiatives that address

127
Time to invest
the particular needs of women in peacebuilding,
advance gender equality and empower women.
• Member States and the UN must prioritise creating
more opportunities for the full diversity of young
people to participate in peacebuilding and
sustaining peace including through dedicated and
adequate nancing. This should be coupled with a
genuine commitment to implementing
S/RES/2250 and the recommendations outlined in
the Progress Study on Youth Peace and Security.⁶
8. Partnerships with civil society should be further
strengthened.
• The role of local actors, including civil society
organisations and community-based networks and
individuals, in sustaining peace, in strengthening
social cohesion and in responding to the needs of
the most marginalised groups of society must be
fully recognised and supported with adequate
funding.
• In light of the worrisome global trend of imposing
increasing restrictions and burdens on civil society
to limit or suppress their activity, it is critical for the
UN to uphold human rights and to take greater
measures to protect and defend civic spaces, mini-
mising barriers to participation.
9. Financing strategies by Member States and UN entities
should ensure long-term support to strengthening the
management of national resources management.
• Financial and technical support must be provided
to ensure an eective and equitable domestic
resource mobilisation that reinforces long-term
national eorts to sustain peace.
• When natural resources are present, and especially
if they comprise a large portion of the country’s
Gross Domestic Product (GDP), specic eorts
must be made to ensure a conict-sensitive
exploitation and reinvestment of revenues with
particular focus on addressing root causes of conict.
• Assist conict-aected countries in their eorts to
address tax evasion by national and multi-national
corporations as well as corruption and to ensure
equitable contractual arrangements.
• These eorts should add to the understanding of
variables that cause conict, including human rights
abuses, issues and grievances in these processes.
10. Establish and utilise systems for monitoring funding to
peacebuilding.
• The UN should enhance its ability to track
nancing to peacebuilding and its alignment with
agreed priorities, building on the work of the PBSO
in this regard.
• UN entities and Member States should strengthen
the capacity of national actors to lead, manage and
monitor eorts to build peace including through
reliable and transparent country systems.
• Aggregate and analyse data at the national level to
allow for global monitoring of resource ows for
peacebuilding and conict prevention.
Footnotes
¹ Referred to as the ‘Sustaining Peace resolutions’: UN
General Assembly (UNGA), ‘Review of the United Nations
peace building architecture’, (resolution, A/RES/70/262,
UNGA, 12 May 2016).
https://undocs.org/A/RES/70/262 and
UN Security Council (UNSC), ‘Resolution 2282 (2016)’,
(resolu tion, S/RES/2282(2016), UNSC, 27 April 2016).
https://undocs.org/S/RES/2282(2016)
² The Foundation has over the past five years organised
expert meetings, ambassadorial-level discussions, and
regional consultations focused on suggestions and strate-
gies for the UN system and Member States to address the
need for predictable financing in efforts to sustain peace,
grounded in the findings of the 2015 Review of the United
Nations Peacebuilding Architecture (PBA) as well as other
UN policy processes. The issues raised during these
meetings form the basis for this paper, which is a revision
and update of an earlier Development Dialogue Paper.
https://www.daghammarskjold.se/publication/financ-
ing-fit-future/
³ UN Security Council Resolution 2282 (2016),
see Footnote 1.
⁴ UN and World Bank, Pathways for Peace: Inclusive
approaches to preventing violent conflict,
(report, World Bank, 2018).
http://hdl.handle.net/10986/28337 and
https://www.pathwaysforpeace.org
⁵ UN Security Council, ‘Resolution 1325 (2000)’,
(resolu tion, S/RES/1325(2000), UNSC, 31 October 2000).
https://undocs.org/S/RES/1325(2000)
⁶ UN Security Council, ‘Resolution 2250 (2015)’,
(resolu tion, S/RES/2250(2015), UNSC, 9 December 2015).
https://undocs.org/S/RES/2250(2015) and for the
Progress Study on Youth Peace and Security see Graeme
Simpson, ‘The missing peace: independent progress study
on youth and peace and security’, (report, UNFPA and
PBSO, 2018).
https://undocs.org/en/S/2018/86 and
https://www.youth4peace.info/system/files/2018-10/
youth-web-english.pdf

128
Time to invest
The World Bank Group and IDA18:
Scaling-up support to address
Fragility, Conflict and Violence
By Franck Bousquet
Franck Bousquet is the World Bank’s Senior
Director for Fragility, Conict and Violence
(FCV). He assumed his position on 1 July 2017
and is leading the development of the World Bank
Group’s Strategy for Fragility, Conict and
Violence. As Senior Director, Franck Bousquet
mobilises expertise and supports operational teams
across the World Bank to deliver on the ground in
close collaboration with humanitarian-develop-
ment-peace partners.
The International Development Association (IDA)¹ is
the part of the World Bank Group (WBG) that supports
the world’s poorest countries. Overseen by 173 share-
holder nations, IDA aims to reduce poverty by providing
loans and grants for programmes that boost economic
growth, reduce inequalities and improve people’s living
conditions. In its 18th replenishment (IDA18),
beginning in July 2018, IDA doubled its nancing from
US$ 7 billion to US$ 14 billion for low-income coun-
tries impacted by fragility, conict and violence (FCV).
Why is this important and what have we learnt? We
know that by 2030, it is estimated that around half of the
global extreme poor will live in fragile and conict-
aected settings. Therefore, our collective action on the
FCV agenda is critical to ending extreme poverty and
achieving the Sustainable Development Goals (SDGs).
To address this challenge, the scale-up in IDA funding
proved critical, and has served as a catalyst for the change
in how we at the WBG – and in many ways our partners
– approach FCV. IDA18 helped to articulate a dieren-
tiated approach to ensure that the WBG adapted a more
tailored response to diverse situations of fragility.
As part of this scale-up, IDA strengthened its role in
preventing the onset, escalation and recurrence of violent
conict. To this end, IDA18 harnessed three tools that
have been essential to scaling-up support to the most
vulnerable communities. First, it introduced the Risk
Mitigation Regime (RMR) to pilot approaches to
prevention. Second, the Refugee Sub-Window (RSW)
was created to support refugees and their host commu-
nities. And third, IDA18 developed the Private Sector
Window to mobilise investments in low-income and
fragile and conict-aected situations. Critically, IDA18
also further strengthened the WBG’s partnerships with
the United Nations and other actors across the humani-
tarian-development-peace nexus.
Pivoting to prevention
A key insight in IDA18 has been the need to prioritise
prevention and scale up support for preventive action
in fragile settings to achieve the SDGs and the World
Bank’s mission to end extreme poverty. The joint
UN-World Bank report, Pathways for Peace², found that
for every US$ 1 invested in prevention, about US$ 16
are saved down the road. Furthermore, we know that
conicts drive 80% of all humanitarian needs. In
addition to the devastating human toll, the economic
and social costs of conict are staggering: in 2016, for
instance, the cost of conict stood at an astonishing
US$ 14 trillion. Investing in prevention is therefore
critical not only to save lives, but to also save resources
and allow the international community to direct more
resources to sustainable development outcomes rather
than continuously respond to emergencies.
Pathways for Peace demonstrated that development poli-
cies and programmes must be a core part of preventive
eorts. We therefore must address grievances related
to exclusion—from access to power, natural resources,
security and justice, for example—that are at the root
of many violent conicts today. Importantly, preventive
action needs to adopt a more people-centred approach.
As an example, this entails both addressing challenges
such as gender-based violence, but also promoting the
longer-term policies needed to address the aspirations of
women and youth – this is vital in eectively preventing
conict and sustaining peace.

129
Time to invest
We are operationalising the recommendations of
Pathways for Peace in two ways. First, through Risk and
Resilience Assessments (RRAs), we identify the drivers
of fragility in order to ensure country strategies and
programming in fragile settings systematically address
the core grievances that fuel fragility, sustain conict and
undermine institutional resilience.
Second, through the IDA18 Risk Mitigation Regime
we have invested US$ 780 million as of July 2019 in
additional concessional nancing for programmes that
specically address socio-economic exclusion, unmet
expectations, and the drivers that risk fueling conict.
This approach is being piloted in Guinea, Nepal, Niger,
and Tajikistan. For example, in Niger we are addressing
the drivers of fragility by supporting skills development
and entrepreneurship for youth, improving access to
markets for pastoralists, and providing essential support
to refugees and host communities. Through these types
of programmes, we are actively helping governments
address the grievances that can often lead to the
emergence of violent extremism and conict.
Support for refugees and host communities
In recent years, we have also sought to do our part to
address one of the most urgent challenges of our time.
With over 70 million forcibly displaced people around
the world – including 25.9 million refugees – the inter-
national community faces the most signicant forced
displacement crisis since World War II. Furthermore,
with refugees and internally displaced people (IDPs)
displaced for years – sometimes even decades – we know
this is both a humanitarian and development challenge.
That is why we have taken concrete steps to partner
with the United Nations High Commissioner for
Refugees (UNHCR) and others to signicantly increase
our support to refugees and host communities.
IDA18 introduced the Sub-Window for Refugees and
Host Communities (RSW)³ to provide US$ 2 billion to
support host countries as they respond to forced displace-
ment crises. A country is eligible if hosting at least
25,000 refugees (or at least 0.1% of the country’s
population). In addition, the country would need to
adhere to an adequate framework for the protection of
refugees and have in place an action plan, strategy or
similar document that describes concrete steps, including
possible policy reforms. The RSW has made a signicant
amount of progress in a short time. As of May 2019,
14 countries are eligible for the RSW, cumulatively
hosting approximately 6.4 million refugees. By end-May
2019 RSW-nanced projects have been approved by the
World Bank Board, totalling US$ 927 million in nine
countries.
Some early lessons are emerging about how we approach
dialogue and policy under the RSW and there has been
some early success. In Ethiopia, for example, an RSW-
nanced programmed supported the Government’s
eorts to grant more rights to refugees and create
100,000 jobs and economic opportunities that will
benet both refugees and host communities. Critically,
this project also provided an entry point that catalysed
policy shifts at the highest legislative level and led to the
adoption of reforms that shift away from the decade-old
encampment model and oer refugees socio-economic
rights, including to move freely, work and access social
services.
In terms of the broader context, the Global Compact on
Refugees, signed by UN member countries in December
2018, is also contributing to shifting the dialogue from a
pure humanitarian agenda to one that reects the need
for a coordinated international response across develop-
ment and humanitarian communities.
Mobilising private sector support
In addition to our support to governments, we know
that the private sector plays a key role in ghting poverty
in fragile and conict-aected situations. In fact, around
90% of jobs in fragile settings are created by the
private sector. However, the private sector faces signicant
barriers in these environments, from weak institutions,
to poor infrastructure and lack of access to nance. We
therefore must focus our eorts on overcoming these
structural barriers, as responsible and sustainable private
sector development in fragile states is a critical founda-
tion of peaceful and stable societies.
Under IDA18, the Private Sector Window (PSW) was
introduced to create markets and catalyse private invest-
ment where fully commercial solutions are not yet
possible and where the WBG’s other nancial instruments
are not sucient. In less than two years of operations,
more than US$ 300 million has been allocated, unlock-
ing over US$ 800 million in investments from the
International Finance Corporation (IFC)⁴ and political
risk insurance from the Multilateral Investment
Guarantee Agency (MIGA)⁵ – the World Bank’s private
sector focused organisations – and further mobilising an
estimated US$ 1.5 billion of additional private nancing.
For example, through a US$ 9 million IFC investment in
12-year local currency bonds, the Togo-based mortgage
renancing company, Caisse Régionale de Renance-
ment Hypothécaire de l’UEMOA (CRRH-UEMOA),
was able to build its housing portfolio, expanding the
availability of housing nance for low and middle-
income households by US$ 500 million. In addition, the
PSW supported a range of other activities, from investing
in Afghanistan’s underdeveloped raisin sector, to improv-

130
Time to invest
ing access to nance for smaller-sized and earlier-stage
rms in Myanmar. These types of investments are critical
to helping build an economic foundation for some of
the most underserved citizens living in fragile settings.
Strengthening partnerships
Ultimately, the approach we have taken in IDA18 –
whether it be about investing in prevention, supporting
refugees or host communities, or catalysing private sector
investment – is underpinned by the need to break silos
and work ever-more closely with partners. To this end,
IDA18 supported deepened partnerships between the
WBG, the UN, multilateral development banks (MDB),
the EU, bilateral partners and others, to ensure a more
eective and coordinated collective response in fragile
settings. These types of partnerships – based upon our
respective comparative advantages – must be the ‘new
normal’ moving forward in order to maximise our
collective impact in fragile and conict-aected
situations.
Operationally, partnerships have been key to delivering
in some of the most challenging contexts. In Yemen, for
example, we have leveraged the UN’s on-the-ground
presence and implementation capacity to help deliver
over US$ 1.5 billion for World Bank projects that focus
on strengthening capacity, building the resilience of local
institutions and preserving hard-won development gains.
Furthermore, we have worked with UN peacekeeping
missions – for instance in the Central African Republic,
Mali or the Democratic Republic of the Congo – in
order to provide rapid support immediately once inse-
cure areas are stabilised. This is crucial to supporting and
strengthening the presence of the state, and ultimately its
legitimacy in the eyes of its citizens by rebuilding critical
infrastructure and providing access to essential services.
On analytics, we have partnered with the UN and
the EU on Recovery and Peacebuilding Assessments
(RPBA), which provide a platform for collaboration
around joint analysis and needs assessment and help gov-
ernments and national stakeholders prioritise activities
aimed at addressing FCV challenges. For example, as part
of an RPBA in Cameroon, a joint government-partners
steering committee and secretariat have been set up to
monitor and coordinate recovery and peacebuilding ac-
tivities. In Zimbabwe, the rst phase of an RPBA being
conducted with the UN and the African Development
Bank (AfDB) features an analysis of challenges and needs
across 25 sectors. This analysis has since been adopted by
the government as part of its post-election Transition
Stabilization Program.
In addition, under IDA18, a signicant number of RRAs
have been undertaken with partners including the UN,
the EU, AfDB, Agence Française de Développement
(AFD), and the German Federal Foreign Oce.
The collaboration has provided a platform for greater
shared understanding of FCV dynamics, country
programmes more focused on drivers of fragility and
more coordinated programming with bilateral partners
and MDBs.
Conclusion
As we consider the impact of IDA18 and look ahead
to IDA19, we hope to build on IDA18’s successes and
lessons learned. In addition, IDA19 will aim to address
emerging issues – such as regional fragility, human cap-
ital decits, or gender challenges – that require greater
focus and investment.
Importantly, the WBG is now also developing its rst
Strategy for Fragility, Conict and Violence⁶, to be
completed by the end of 2019. The Strategy will draw
on the lessons learned from IDA18 to ensure the WBG
can more systematically address the key drivers of FCV
in aected countries and their impact on vulnerable
populations, with the end goal of contributing to
broader international eorts promoting peace and
prosperity.
Ultimately, through the approach we have taken in
IDA18 in close collaboration with our partners, we have
made necessary investments in pursuit of the SDGs and
our mission to end extreme poverty. We must now build
on the progress made and continue our collective eorts
to build futures of hope, opportunity and prosperity for
the millions living in the most challenging situations.
Footnotes
¹ http://ida.worldbank.org/
² World Bank Group and UN, Pathways for Peace: Inclusive
approaches to preventing violent conflict, (report, World Bank,
2018). https://www.pathwaysforpeace.org
³ International Finance Cooperation World Bank Group,
‘IDA18 Regional Sub-Window for Refugees and Host
Communities’, (funding announcement, World Bank, 2017).
⁴ https://www.ifc.org/
⁵ https://www.miga.org/
⁶ World Bank Group, ‘World Bank Group Launches
Worldwide Consultations on Future Strategy for Fragility,
Conflict and Violence’,
(press release, World Bank, 16 April 2019).

131
Time to invest
Catherine Howell is the former Innovative Finance
Advisor for the Peacebuilding Support Oce in the
United Nations Department of Political and Peace-
building Aairs. Previously, she worked for over
ten years in the investment banking sector across
nance, risk and strategy. She also worked in private
sector development in the health and agricultural
sectors based in Zambia and Kenya, with her for-
mer role as the Director of Head of Enterprise and
Supply Chain, supporting SME development and
access to nance across Barclays African markets.
She holds a Bachelor’s in Banking Finance and
Management, is a qualied management accountant
and a part Master’s in Micronance and Financial
Inclusion.
Henk-Jan Brinkman is Chief of the Peacebuilding
Strategy and Partnerships Branch of the Peace-
building Support Oce in the UN Department of
Political and Peacebuilding Aairs. Previously, he
worked in the World Food Programme, the oce
of the UN Secretary-General and the UN
Department of Economic and Social Aairs. He has
published on such topics as peace and justice in the
post-2015 development agenda, socio-economic
factors behind violent conicts, the impact of high
food prices, structural adjustment in Africa and
human stature. He holds a Master’s in economics
from the University of Groningen in the
Netherlands and a PhD in economics from the
New School for Social Research in New York City.
Innovative finance for peacebuilding:
It is time to invest
By Catherine Howell and Henk-Jan Brinkman
The Secretary-General’s report on Peacebuilding and
Sustaining Peace from January 2018 makes several
recommendations on nancing of United Nations
peacebuilding activities.¹ Among them is a call to
explore innovative nance options. With slow progress
in areas of voluntary and assessed contributions, the
lens is often turned towards innovative nance to bring
solutions. This presents a window of opportunity for the
peacebuilding community to build on the motivation of
actors willing to bring investment and resources. How-
ever, we need to act with caution. Innovative nance is
unlikely to be a panacea that brings the ‘quantum leap’
for the Peacebuilding Fund that the Secretary-General
called for in his report or to raise the needed resources
for nancing peacebuilding more broadly; donor contri-
butions will remain at the heart of nancing, certainly in
the near term.
Innovative finance options
span broad and diverse disciplines
The generally accepted denition of innovative nance
is any instrument beyond traditional grants that mobilises
new capital or improves the eciency or eectiveness of
existing capital.
Broadly, these options could be categorised as
1) traditional fundraising which is more akin to
grant making from new sources and
2) nancing which would require some level of
nancial engineering and an economic return.
Options address different challenges
Options should be considered against the challenges they
address and be applied with a conict-sensitive approach
(see Figure 1 on the next page).
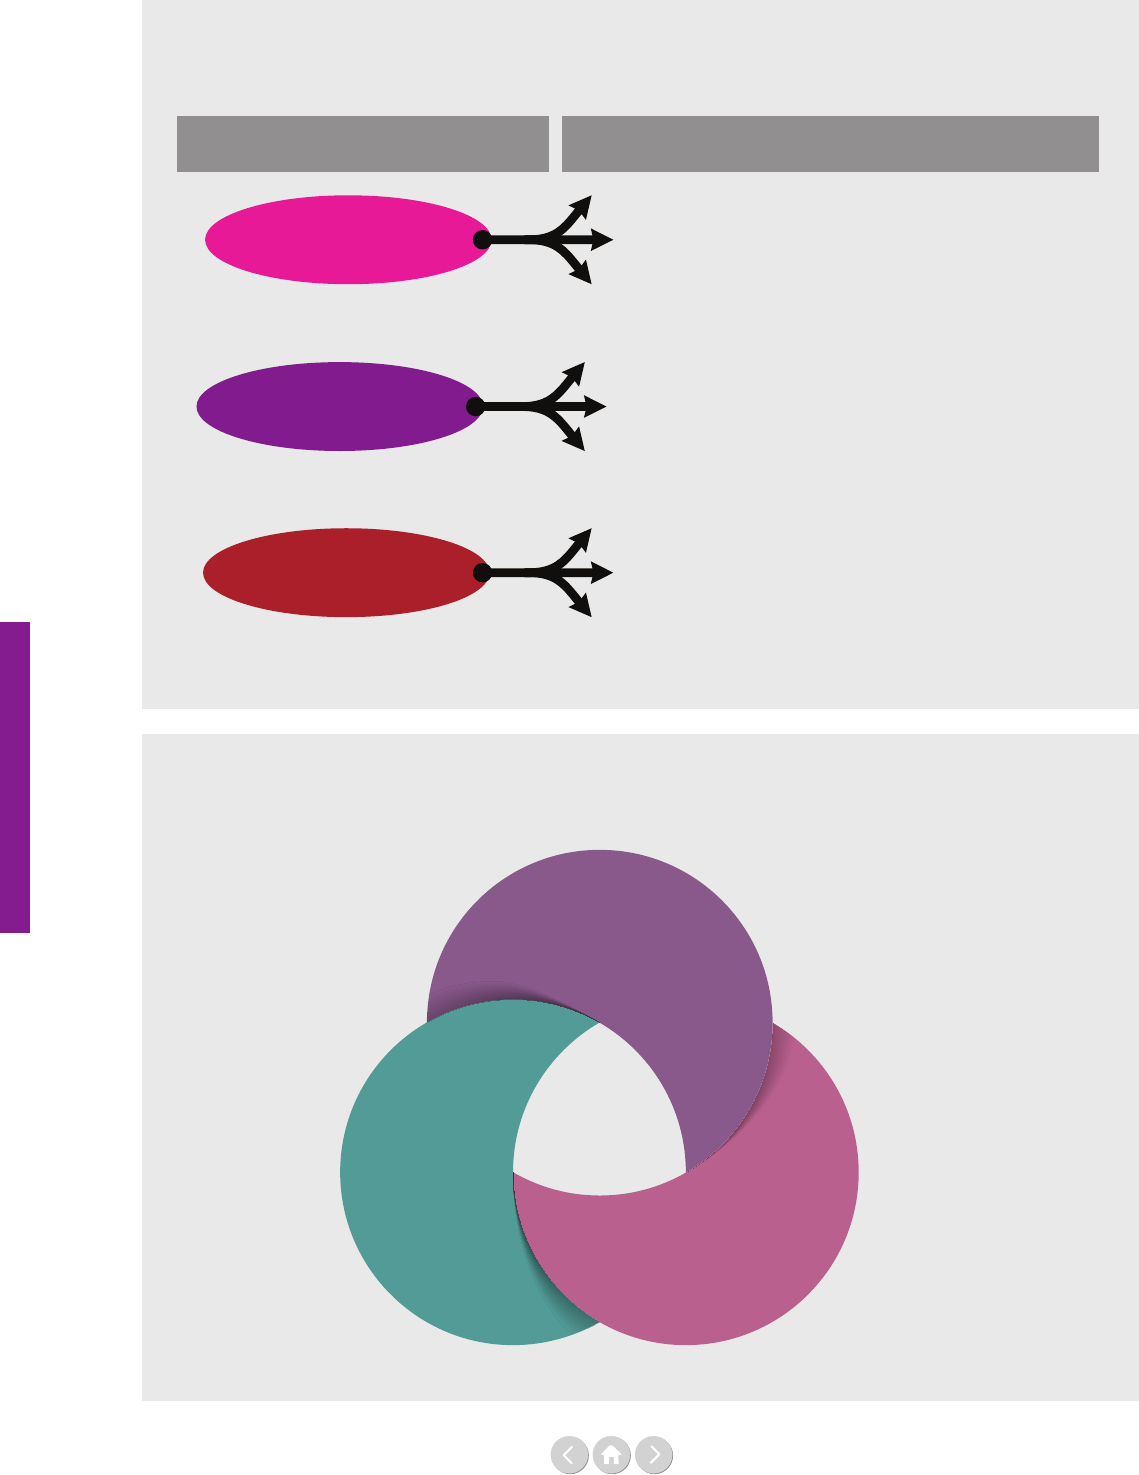
132
Time to invest
Figure 1: Options address different challenges
Figure 2: Progress is hindered by some common challenges
Source: Peacebuilding Support Oce (PBSO)
Source: Peacebuilding Support Oce (PBSO)
Microfinance
Opportunity Options
Raise additional
funding
Improve efficiency or
effectiveness
Create economic
opportunities
Voluntary levies and taxes
Front-loading mechanisms
Fundraising from individuals, foundations and corporations
Product sponsorship
Impact bonds and performance-based contracts
Insurance mechanisms
Bonds
Concessional loans, guarantees and equity
Peacebuilding
is complex
Diversity
of options
Partner-
ships
across
different
sectors

133
Time to invest
Progress is hindered by
some common challenges
(See Figure 2 on previous page.)
Peacebuilding is complex
The knowledge of what works is much weaker in peace-
building than, for example, in the area of health, where
innovative nance has progressed dramatically since the
early 2000s. Peacebuilding and prevention outcomes are
also more elusive and can take a long time to materialise
– or, in case of prevention, is a non-event. The pressure
– common in the public and private sector – to produce
tangible results, often in a short period of time, makes
innovative nancing of peacebuilding more dicult.
Partnerships across dierent sectors
New partnerships are required among dierent actors
that are not typically connected by the nature of their
work. These stakeholders have dierent motivations,
organisational structures, cultural and language barriers,
regulations and operating histories.
Diversity of options
The range of options and ways to implement them are
vast and will require signicant research, development
and set-up costs. As above the range of options span a
diverse range of disciplines and within each there could
be many ways of achieving outcomes. For example, there
are many industries for which a micro levy could be
attached, and many ways of structuring the levy itself.
What will it take to move forward?
1) Increase investment into research and development
Experimentation will be needed to build a pipeline of
new models that are both locally led and designed at
regional or global scale. Patience is essential in this pro-
cess as are realistic expectations of costs and timelines.
To support this early phase of design and innovation
philanthropic capital will be critical; bringing fund-
ing to feasibility studies and developing a path forward
informed by peacebuilding nancing needs. The Peace-
building Support Oce (PBSO) is mapping nancing
resources that are focused on peacebuilding in conict-
aected countries as elaborated in the piece by Ayham Al
Maleh on page 136. Identifying peacebuilding priorities,
based on joint multi-dimensional risk analysis, is import-
ant to determine joint nancing needs and gaps, which
will help forge a successful path forward.
2) Build the business case to mobilise
funds for peacebuilding by raising its prole
Fundraising requires investment into outreach, campaign
building, feasibility research and relationship building.
A joint UN-World Bank (WB) study² showed that for
every US$ 1 invested in prevention, US$ 16 is saved
down the line because of the devastating impacts of
violent conicts. As the study notes, ‘the best way to
prevent societies from descending into crisis, including
but not limited to conict, is to ensure that they are
resilient through investment in inclusive and sustainable
development’.³ Peacebuilding and prevention, however,
is not a well-recognised concept among the public.
What can the peacebuilding sector learn from how the
health and climate nance market has evolved? How
can lessons be applied to motivate new funders to see
peacebuilding as bringing economic and social benet to
them, which in turn motivates investment?
Also, how can peacebuilding leverage the work of other
actors? For example, the UN Food and Agricultural
Organization (FAO) reports that more than 113 million
people experienced ‘acute hunger’ across 53 countries
in 2018, and conict, climate disasters, and economic
shocks are the main factors.⁴ Agencies working on food
security, could raise the prole of peacebuilding by inte-
grating it into their food security programming.
Eorts are being made to join arms. For example, the
Alliance for Peacebuilding, has launched the +Peace
coalition of leading peacebuilding NGOs.⁵ Their aim is
to establish peacebuilding in social campaigns, raise
visibility and entry points for individuals, foundations
and companies to invest and support peacebuilding.
Its rst port of call? Getting the word peacebuilding into
dictionaries.
3) Build capacity for locally led nancing options
Dierent opportunities and challenges exist for private
capital depending on where a country is in its conict
cycle. For example, during violent conict and in the
early phases of recovery, rule of law and contract enforce-
ment are often weak and, as a result, there is little or no
enabling environment for local business lending and
investment. Initiating dialogue with the private sector
can enable a pathway towards a supportive enabling
environment. Risk mitigation, for example, through
political guarantees, could help but this requires dialogue
with private investors at both a local and global level.
Peacebuilding actors are uniquely positioned to facilitate
the development of novel solutions. They are used to risk
taking and to working in uid environments. Empower-
ing local actors with nancing for technical know-how
and connecting them to local and international partners
can create opportunities for investment. The Peace-
building Fund (PBF) has called for increased innovation
through the Gender and Youth Promotion Initiative
(GYPI) in 2019 and has published guidance to capacitate
government and civil society actors exploring opportu-
nities. Catalytic tools such as the PBF have an important

134
Time to invest
role to play in providing the preparatory and risk capital
needed to build a pipeline of nancing options.
Furthermore, the United Nations Development
Programme has seen success through its Alternative
Finance Lab in supporting impact bonds, crowd sourcing
platforms and blockchain solutions. Although not
directly in the eld of peacebuilding, this ability to
experiment and build capacity at the national level is
a promising approach for developing solutions in the
peacebuilding eld. While there is pressure to show per-
formance and results, these areas of learning are essential
building blocks in developing a framework by which
innovative solutions can be deployed at increasing scale.
4) Build coalitions and dene comparative advantages
At the global level, actors can build networks and invest
resources into designing larger nancing mechanisms.
For example, the design of blue bonds to crowd in
US$ 1.6 billion of capital for ocean conservation
requires a collaboration between a range of stake-
holders.⁷ There are cost eciencies to be gained in
addressing challenges more systematically with actors
sharing learnings and challenges that others around the
table can solve. Insurance mechanisms such as the
African Risk Capacity has estimated that for every
US$ 1 insurance paid out, US$ 4.40 of international aid
is saved because of cost eciency.⁸
The peacebuilding eld can explore whether it makes
sense to join other coalitions, eg Humanitarian Investing
Network, or create its own coalition that seeks to address
the unique nature of peacebuilding funding. Actors need
to play to their strengths and comparative advantages and
work together to create joint initiatives.
The United Nations can build on its partnerships with
regional and global development nance institutions,
which have the nancial and regulatory power to bring
market-based solutions to implementation. With an
increase in resources at the World Bank devoted to issues
of fragility, conict and violence and a new strategy for
that area of work under development, it is important that
actors also leverage the comparative advantages of other
actors in the space of innovative nance, eg in issuing
bonds and structuring larger funds.
5) Setting standards and norms
Private investments in conict-aected countries are
largely concentrated in the extractive industry. In this
sector in particular – but relevant for all sectors – invest-
ments can have a notable impact on conict dynamics
in a country. This impact can be positive or negative, and
can relate to land use, environmental practice and eects
and distribution of economic benets. It is therefore
important that investments are conict sensitive, mini-
mise potential harm and empower local actors with the
aim of creating shared and inclusive growth. Moreover,
they could have positive impacts, for example, by bring-
ing dierent groups of people together on the work
oor or by generating revenues for the government,
which can be used to provide equitable social services.
Norms and standards regarding innovative nance tools
are largely non-existent and should be developed.
Finally, what will enable system change?
It is time to move beyond debating the challenges, it is time
to invest!
There is a lot of interest in the eld of innovative nance
for peacebuilding as well as for humanitarian and develop-
ment action. Key actors need to build coalitions, work
together, invest in Research and Development (R&D),
experiment and recognise their respective strengths
and roles. In some instances, the United Nations may
play only a facilitating, not a leading role in the design
and implementation of more complex, but potential-
ly game-changing innovations. The area of uncharted
territory is vast and many actors can have a role, includ-
ing civil society, governments, the private sector, NGOs
and UN entities. The unique position of the UN as an
advocate and convener should be leveraged to catalyse
system change. It is time to invest in the resources to lead
this change.
Blended-finance solution in Colombia
The Peacebuilding Fund (PBF), in 2018, funded
the development of a blended-finance solution
in Colombia.
The project catalyses private sector invest-
ments into conflict-affected areas and to
businesses where risk would be too high for
private capital alone. The project also supports
an innovative Monitoring and Evaluation
(M&E) framework, adapting the Social Progress
Index
6
to Colombia, which in turn could see
investments mapped to the Sustainable
Development Goals (SDGs). While creating
space for design and research, the project
creates the pathway for scale.

135
Time to invest
Footnotes
¹ United Nations Secretary-General, ‘Peacebuilding and
sustaining peace’, (Report of the Secretary-General,
A/72/707-S/2018/43, United Nations General Assembly
Security Council, 18 January 2018).
https://www.un.org/peacebuilding/sites/www.un.org.peace-
building/files/documents/sg_report_on_peacebuilding_and_
sustaining_peace.as_issued.a-72-707-s-2018-43.e_1.pdf
² ‘Pathways for Peace: Inclusive approaches to preventing violent
conict’, (report, United Nations and World Bank, 2018).
³ United Nations and World Bank, ‘Pathways for Peace: Inclusive
approaches to preventing violent conict’, see footnote 2.
⁴ Erica Sanchez and Leah Rodriguez, ‘113 Million People Lack
Food Due to Climate Change and Conict: UN’,
Global Citizen, 2 April 2019.
https://www.globalcitizen.org/en/content/global-food-crises-
report-2019-fao-un/?utm_source=twitter&utm_medium=so-
cial&utm_content=global&utm_campaign=general-con-
tent&linkId=65650547
⁵ https://www.peacebuilding.live/
⁶ https://www.socialprogress.org/
⁷ https://www.nature.org/en-us/what-we-do/our-insights/
perspectives/an-audacious-plan-to-save-the-worlds-oceans/
⁸ ‘Innovative Finance for Development: A Guide for
International NGOs’, (guide, InterAction, 2018).

136
Financing sustaining peace Financing sustaining peace Financing sustaining peace Financing sustaining peace
Time to invest
Official Development Assistance and peacebuilding:
10-year trends
By Ayham Al Maleh
Ayham Al Maleh is an Associate Policy Ocer
with the Peacebuilding Support Oce, working
on Pathways for Peace and the UN-World Bank
Partnership on Crisis Aected situations. He has
followed the Pathways for Peace study in various
capacities since its inception in 2016 and support
the UN-World Bank Steering Committee for
Crisis-Aected Situations. Prior to joining the UN
Ayham worked at the Copenhagen Centre for
Resolutions of International Conict, as well as
the NGO Teach First Denmark. Ayham Al Maleh
holds a Master’s in International Political Economy
from the University of Warwick, UK and a
Bachelor’s in Political Science from the University
of Aarhus, Denmark.
The views and interpretations in this section do not
necessarily represent the views of the United Nations.
The Secretary-General’s report on Peacebuilding and
Sustaining Peace¹ highlights that nearly half of all people
living in extreme poverty reside in fragile and conict-
aected states. Unless concerted action is taken by 2030,
that gure is expected to rise to 80% by 2035.² At the
same time, peacebuilding and conict prevention
remains a cost-eective way to safeguard development
gains – with US$ 1 invested in prevention, resulting in
US$ 16 saved by one estimate.³ By another estimate
– the United Nations-World Bank study on Pathways for
Peace: Inclusive Approaches to Preventing Violent Conict –
costs of conict far outweigh the costs of prevention by
anywhere between US$ 5-70 billion. Increasing donor
spending on peacebuilding in conict-aected countries
remains an important lever by which the international
community can focus on prevention and contain rising
human and economic costs of violent conicts. The
present section lays out the current trends in Ocial
Development Assistance (ODA) to conict-aected
countries as well as to peacebuilding ODA in conict-
aected countries⁴ updating the ndings of a 2017
report on ‘Stocktaking of Peacebuilding Expenditures:
2002–2013’ by the Institute of Economics and Peace and
the UN’s Peacebuilding Support Oce (PBSO).⁵
Using the Organisation for Economic Co-operation
and Development (OECD) Creditor Reporting System,
PBSO has identied the ODA ows that are related
to peacebuilding based on the recurring peacebuild-
ing priorities outlined in the 2009 Secretary-General’s
report⁶: political processes; safety and security; rule of law
and human rights; and core government functions. There
are other areas that could contribute to peacebuilding
outcomes, such as health, education and infrastructure,
depending on the design of the programmes, which
generally do not focus on peacebuilding outcomes.
This exercise can help paint a more data-driven picture
of the state of bilateral and multilateral nancing for
peacebuilding.
Total ODA gross disbursements in 2017 constituted a
total of US$ 186 billion with humanitarian emergency
response and in-donor refugee costs taking up 21%.
Other major areas of investment in 2017 include;
transportation and infrastructure; basic health (6%);
government and civil society (7%) and population
policies/programmes (6%).
Peacebuilding expenditures remain a small and declining
proportion of total aid disbursement to all developing
countries, although this trend seems to be halting in the
most recent years, when disbursements to peacebuild-
ing stagnated at around 9% of total ODA (see Figure 1
on next page). From 2016 to 2017, however, there is an
increase in ODA to peacebuilding of US$ 1.8 billion.
Among the developing countries⁷, there are 51 countries
that are aected by conict.⁸ After a decade-long decline,
the share of total ODA that is allocated to conict-
aected countries has been reversed since 2016, with
36% of ODA disbursed to conict-aected countries in
2017, up from 32% in 2015 (see Figure 2 on next page).
In absolute terms, ODA to conict-aected countries
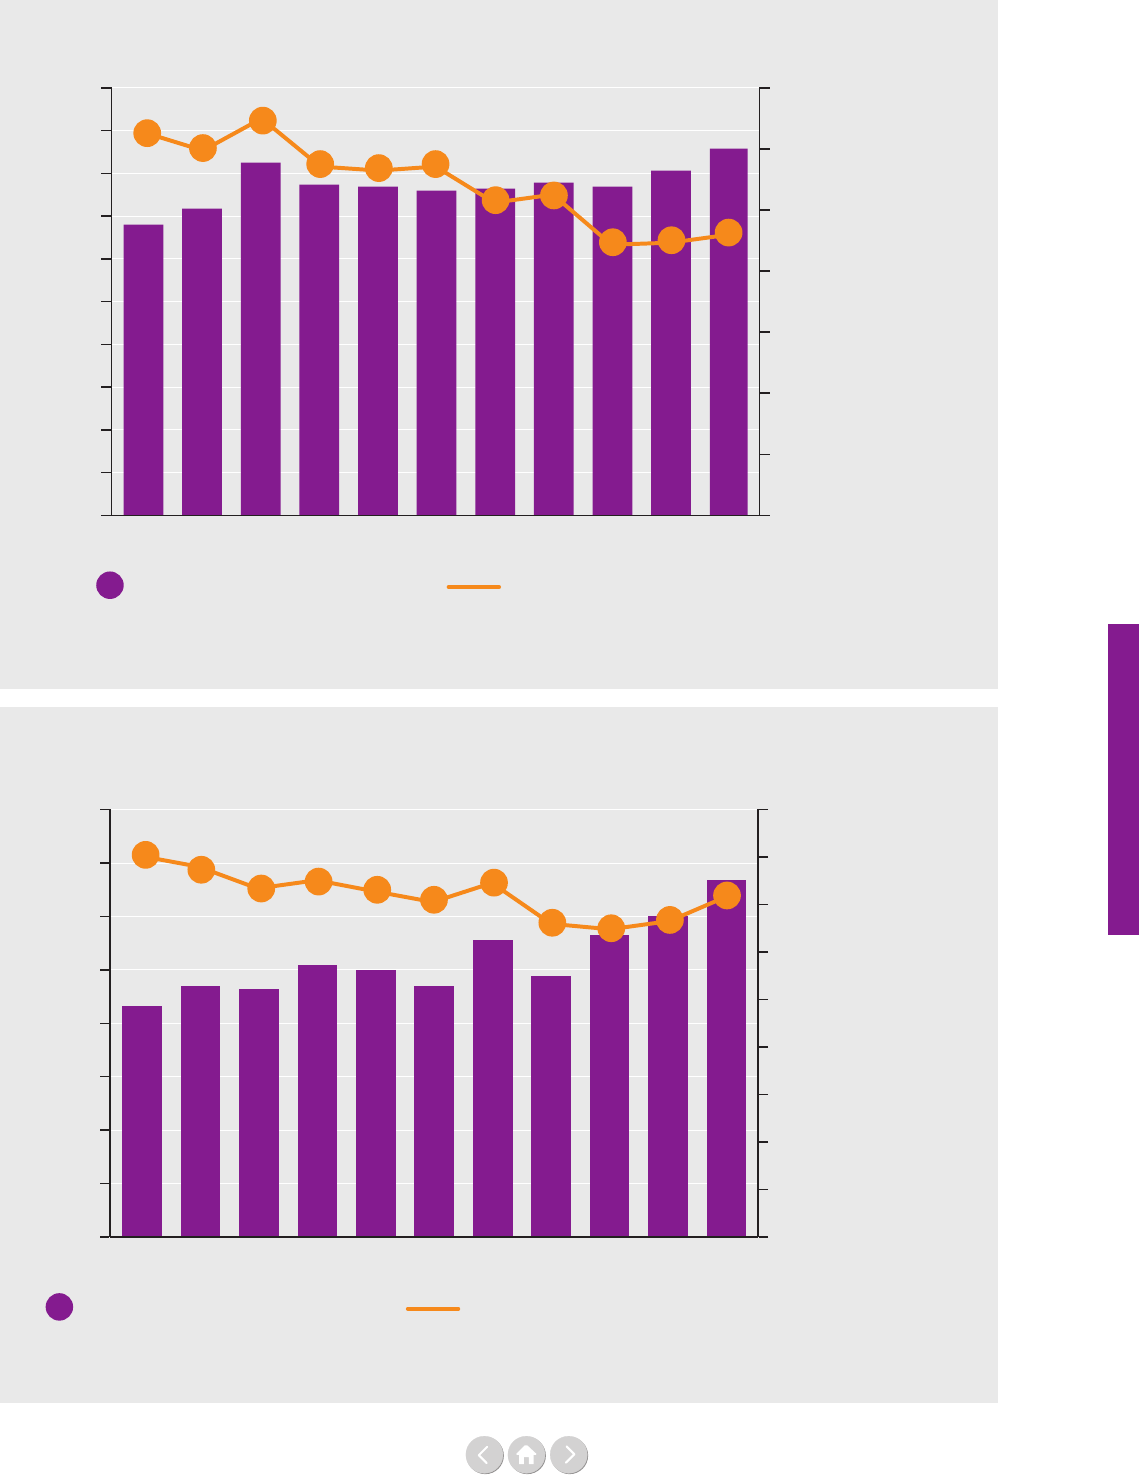
137
Financing sustaining peace Financing sustaining peace Financing sustaining peace Financing sustaining peace
Time to invest
Figure 1: Declining and stagnant disbursement on peacebuilding as share of total ODA
Figure 2: Increasing ODA to conflict-affected countries
Source: Organisation for Economic Co-operation and Development (OECD)
Source: Organisation for Economic Co-operation and Development (OECD)
2007 2008 2009 2010
20
18
16
14
12
10
8
6
4
2
0
14%
12%
10%
8%
6%
4%
2%
0%
2011 2012 2013 2014 2015 2016 2017
US$ billion, 2016 constant prices
% of total ODA
$ ODA in support of Peacebuilding % ODA in support of Peacebuilding
13%
12%
13%
11%
11%
11%
10%
11%
9%
9%
9%
2007 2008 2009 2010
80
70
60
50
40
30
20
10
0
45%
40%
35%
30%
25%
20%
15%
10%
5%
0%
2011 2012 2013 2014 2015 2016 2017
US$ billion, 2016 constant prices
% of total ODA
$ ODA to conflict-affected countries % of total ODA to conflict-affected countries
40%
39%
37%
38%
37%
35%
37%
33%
32%
33%
36%
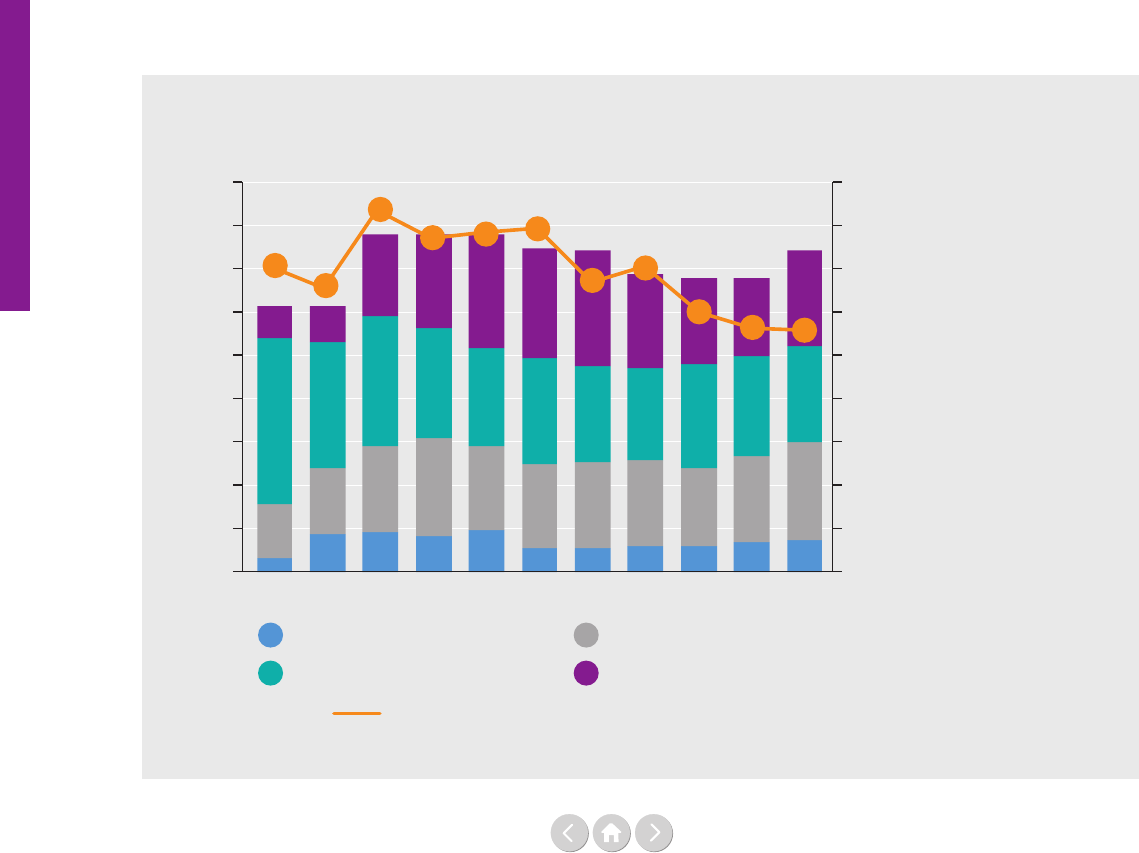
138
Time to invest
increased from US$ 48.7 billion in 2014 to US$ 66.9
billion in 2017. A signicant part of that increase, how-
ever, is attributable to only a few countries. In 2017,
a third of ODA to conict-aected countries was
disbursed to only four country contexts (Afghanistan,
Kenya, Nigeria and Syrian Arab Republic), with Syria
accounting for the largest share of 17%. At the same
time, increased ODA to conict-aected countries is
driven by increased spending on humanitarian responses,
rather than increased development or peacebuilding
spending. In 2017 alone US$ 19.2 billion was disbursed
in emergency response compared to US$ 8.0 billion in
2014, amounting to a 140% increase in just 4 years.
The absolute increase in peacebuilding from 2016 to
2017 is attributable to increased spending on human
rights and rule of law (increased by US$ 453 million)
and inclusive political processes (increased by US$ 256
million) and oset by a decline in expenditures related
to core government functions (declined by US$ 114
million) – reecting shifting priorities related to peace-
building. Although one year of absolute increase in
peacebuilding spending is too early to mark a trend, the
increase could be indicative of the rising importance of
‘inclusion’ – dened as emphasis on human rights and
inclusive political processes – as a means to deliver donor
priorities related to prevention.
Figure 3: In conflict-affected countries, peacebuilding declines as a share of total ODA
Source: Organisation for Economic Co-operation and Development (OECD)
2007 2008 2009 2010
9
8
7
6
5
4
3
2
1
0
18%
16%
14%
12%
10%
8%
6%
4%
2%
0%
2011 2012 2013 2014 2015 2016 2017
US$ billion, 2016 constant prices
% of total ODA
Basic safety and security
Core government functions
Inclusive political processes
Human Rights and Rule of Law
Peacebuilding % of ODA to conflict-affected countries
14%
13%
17%
16%
16%
16%
13%
14%
12%
11%
11%
An increase in ODA to conict-aected countries in
recent years is, however, not matched by a growing focus
on peacebuilding in these countries. The share of ODA
focusing on peacebuilding in conict-aected countries
declined from 16.8% in 2009 to 11.2% in 2017 – and in
absolute terms from US$ 7.8 billion in 2009-2011
to US$ 6.8 billion in 2015 and 2016 – increasing to
US$ 7.5 billion in 2017 (see Figure 3 below). Largely
this decline as share of total ODA could reect the
declining emphasis on large-scale state and peacebuilding
processes related to the wars in Afghanistan and Iraq.
Overall in the period 2015-2017, peacebuilding-related
disbursements accounted for 11.5% of total ODA to
conict-aected countries. Notably, funding for human
rights, public nancial management and legislatures and
political parties constitute the largest proportions of
peacebuilding, accounting for a total of 57% of peace-
building-related disbursements combined (see Figure 4
on next page).
The overall trends in peacebuilding-related ODA reveal
a mismatch between donor rhetoric regarding preven-
tion and donor expenditures focused on crisis-response.
These trends also reect, however, missed opportunities
related to increasing spending on prevention and peace-
building – and thereby cutting crisis-response costs in
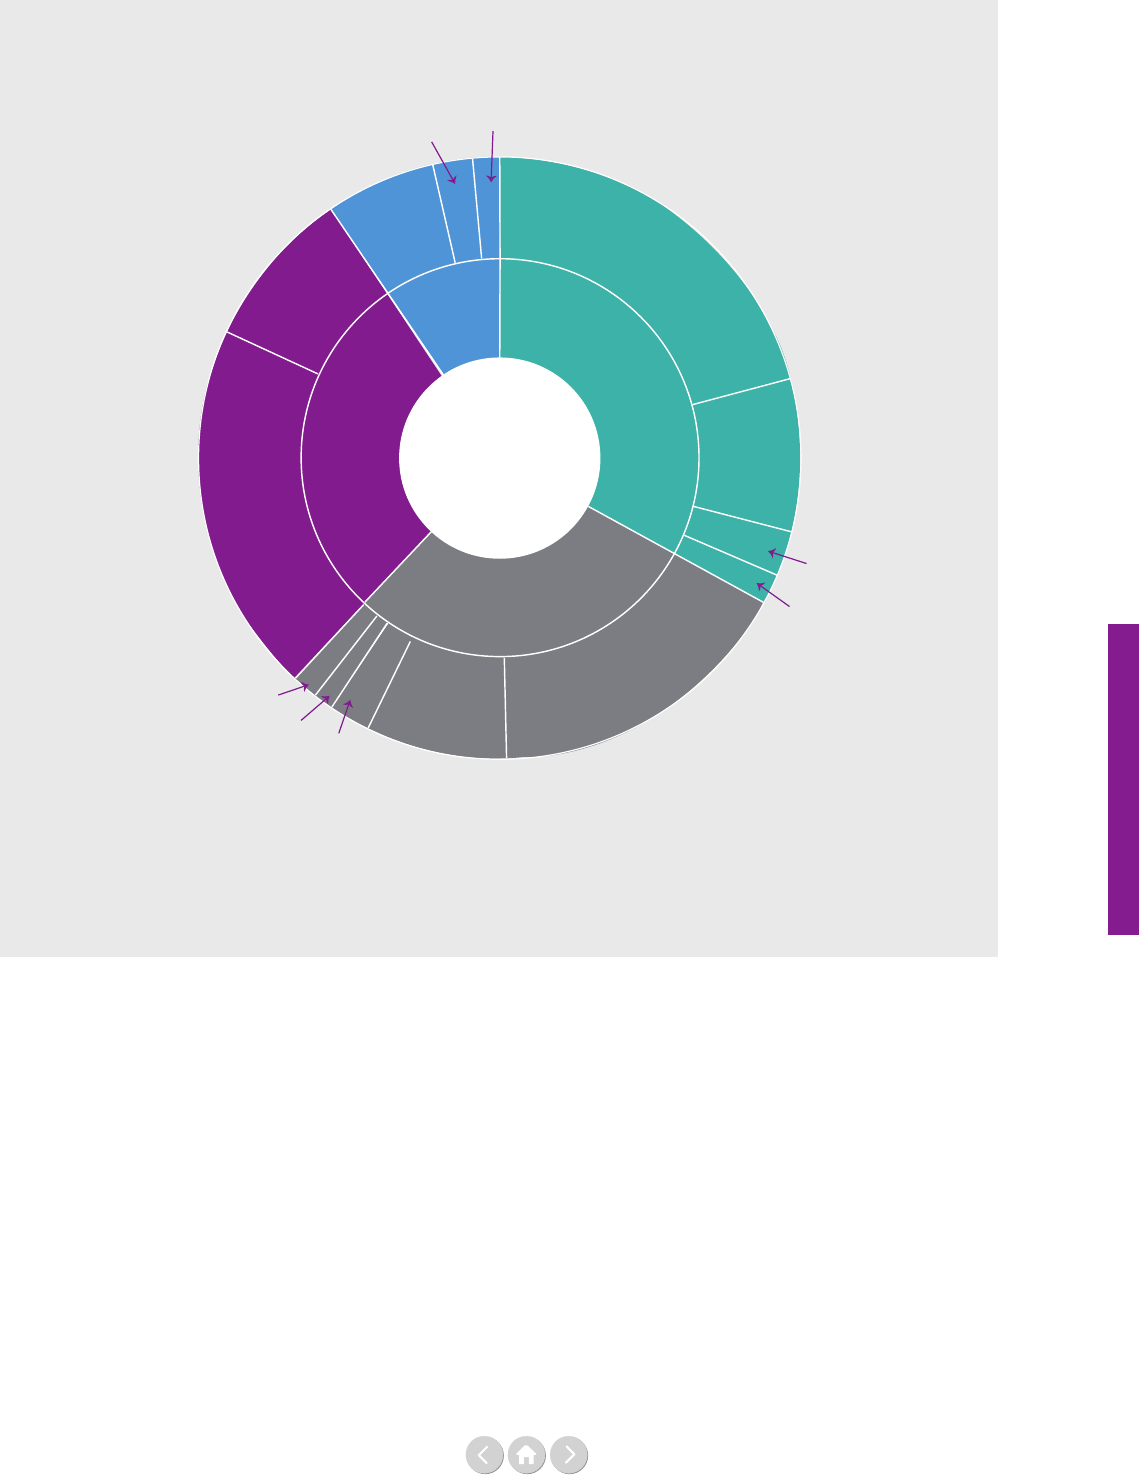
139
Time to invest
Figure 4: Peacebuilding ODA in conflict-affected countries focused mostly on
public financial management, human rights and legislature and political parties in 2015-2017
(in US$ million, 2016 constant prices)
Source: Organisation for Economic Co-operation and Development (OECD)
Note: Sectors under US$ 200 million have been grouped together.
Other in green space represents a total of US$ 350 million:
Child soldiers (prevention and demobilisation) (US$ 29 million), Ending violence against women and girls (US$ 125 million), Participation in
international peacekeeping operations (US$ 23 million), Reintegration and SALW control (US$ 127 million)
Other in grey space represents a total of US$ 293 million:
Anti-corruption organisations and institutions (US$ 124 million), Women's equality organisations and institutions (US$ 169 million)
21,100
US$ million
I
n
c
l
u
s
i
v
e
p
o
l
i
t
i
c
a
l
p
r
o
c
e
s
s
e
s
H
u
m
a
n
r
i
g
h
t
s
a
n
d
r
u
l
e
o
f
l
a
w
B
a
s
i
c
s
a
f
e
t
y
a
n
d
s
e
c
u
r
i
t
y
C
o
r
e
g
o
v
e
r
n
m
e
n
t
f
u
n
c
t
i
o
n
s
P
u
b
l
i
c
f
i
n
a
n
c
e
m
a
n
a
g
e
m
e
n
t
D
o
m
e
s
t
i
c
r
e
v
e
n
u
e
m
o
b
i
l
i
s
a
t
i
o
n
Public sector policy
and administrative
management
Removal of land mines
and explosive remnants of war
Other
Decentralisation and
support to subnational
government
Civilian peacebuilding,
conflict prevention and resolution
H
u
m
a
n
r
i
g
h
t
s
L
e
g
a
l
a
n
d
j
u
d
i
c
i
a
l
d
e
v
e
l
o
p
m
e
n
t
S
e
c
u
r
i
t
y
s
y
s
t
e
m
m
a
n
a
g
e
m
e
n
t
a
n
d
r
e
f
o
r
m
L
e
g
i
s
l
a
t
u
r
e
s
a
n
d
p
o
l
i
t
i
c
a
l
p
a
r
t
i
e
s
M
e
d
i
a
a
n
d
f
r
e
e
f
l
o
w
o
f
i
n
f
o
r
m
a
t
i
o
n
Democratic participation and civil society
Other
the long run. Although the declining emphasis on peace-
building-related ODA disbursement may begin to see a
reversal, we are yet to see a clear trend in this regard.
Methodological notes
The data on ODA is publicly available information,
collected on an annual basis by the Organisation for
Economic Co-operation and Development (OECD) as
reported through their Creditor Reporting System.
The information represents gross disbursements of ODA
– and reects actual spending rather than commitments
and excludes debt repayments. Although the information
may not capture all development ows – the OECD
database represent the best information available on
aggregate Ocial Development Assistance. The OECD
data also captures ODA from countries that are not
members of the OECD Development Assistance
Committee (OECD-DAC), such as Russia, Turkey and
United Arab Emirates. China, however, does not report
to the OECD. The data does not display other import-
ant forms of development assistance, including in-kind
support or cooperation, which also have a valuable role
to play in peacebuilding, as noted in the 2018 Report of
the Secretary-General on Peacebuilding and Sustaining
Peace.⁹
Peacebuilding-related categories
The peacebuilding-related categories of ODA ows are
based on the 2009 Secretary-General’s report
10
, which
highlighted several recurring peacebuilding needs. They
are listed below and constitute the basis for the report of
the Institute for Economics and Peace.
11

140
Time to invest
Peacebuilding
Categories
Purpose code
CRS
Purpose #
Basic safety
and security
Security system management and reform
Reintegration and Small Arms and Light Weapons (SALW) control
Removal of land mines and explosive remnants of war
Child soldiers (prevention and demobilisation)
Ending violence against women and girls
Facilitation of orderly, safe, regular and responsible migration and mobility
Participation in international peacekeeping operations
15210
15240
15250
15261
15180
15190
15230
Inclusive political
processes
Civilian peacebuilding, conict prevention and resolution
Legislatures and political parties
Anti-corruption organisations and institutions
Democratic participation and civil society
Media and free ow of information
Women's equality organisations and institutions
15220
15152
15113
15150
15153
15170
Core government
functions
Public sector policy and administrative management
Public nance management
Domestic revenue mobilisation
Decentralisation and support to subnational government
15110
15111
15114
15112
Human rights and
rule of law
Legal and judicial development
Human rights
15130
15160
Footnotes
¹ United Nations Secretary-General, ‘Peacebuilding and
sustaining peace’, (Report of the Secretary-General,
A/72/707-S/2018/43, United Nations General Assembly
Security Council, 18 January 2018).
² OECD, ‘Creditor Reporting System (CRS)’, (database,
OECD, 2019). Retrieved from: https://stats.oecd.org/
³ Institute of Economics and Peace, ‘Stocktaking of
Peacebuilding Expenditures: 2002-2013’,
(report, Institute of Economics and Peace, 2017’;
‘Measuring Peacebuilding Cost-Effectiveness’,
(report, Institute of Economics and Peace, 2016).
⁴ Countries with financial activity within the Secretary-
General’s Peacebuilding Fund or with a single-country special
political mission or peacekeeping operation in 2018
(54 countries in total).
⁵ Institute of Economics and Peace, ‘Measuring Peacebuilding
Cost-Effectiveness’, see footnote 3.
⁶ United Nations Secretary-General, ‘Report of the Peace-
building Commission, Report of the Secretary-General on the
Peacebuilding Fund, Follow-up to the outcome of the
Millennium Summit, Strengthening of the United
Nations system’, (Report of the Secretary-General,
A/63/881-S/2009/304, United Nations General Assembly
Security Council, 11 June 2009).
⁷ ‘DAC List of ODA Recipients: Effective for reporting on
2014, 2015, 2016 and 2017 flows’,
(statistics, OECD-DAC, 2018).
⁸ Countries with financial activity within the Secretary-
General’s Peacebuilding Fund or with a single-country special
political mission or peacekeeping operation in 2018
(54 countries and territories).
⁹ Report of the Secretary-General, A/72/707–S/2018/43,
UNGA SC, 18 January 2018.
10
Report of the Secretary-General, A/63/881–S/2009/304,
UNGA SC, 11 June 2009.
11
More detailed information regarding the content of each
purpose code as well as other codes can be found here:
http://www.oecd.org/dac/financing-sustainable-development/
development-finance-standards/dacandcrscodelists.htm

141
Time to invest
Laura Buzzoni currently serves as Associate Policy
Ocer with the Peacebuilding Support Oce
(UN DPPA), working on conict prevention
through the Sustainable Development Goals and
other issues related to the Humanitarian-Develop-
ment-Peace nexus. Before joining PBSO Laura
Buzzoni worked as Coordination Associate at
the United Nations Support Mission in Libya for
three years. Throughout her career she focused on
sustainable development, peace and democratic
transition with a particular interest in the MENA
region. She previously held dierent positions with
UNDP, the European Union and NGOs in Jor-
dan, Belgium and Morocco. Laura has two Master’s
degrees in International Aairs and Diplomacy and
Development Economics.
Henk-Jan Brinkman is Chief of the Peacebuilding
Strategy and Partnerships Branch of the Peace-
building Support Oce in the UN Department of
Political and Peacebuilding Aairs. Previously, he
worked in the World Food Programme, the oce
of the UN Secretary-General and the UN
Department of Economic and Social Aairs. He has
published on such topics as peace and justice in the
post-2015 development agenda, socio-economic
factors behind violent conicts, the impact of high
food prices, structural adjustment in Africa and
human stature. Henk-Jan Brinkman holds a Master’s
in economics from the University of Groningen in
the Netherlands and a PhD in economics from the
New School for Social Research in New York City.
How the Peacebuilding Fund is investing
in the Sustainable Development Goals
By Laura Buzzoni and Henk-Jan Brinkman
Violence and conict are the most important obstacles
to sustainable development. Nearly half of all people
living in extreme poverty reside in countries aected by
conict. Fifty percent of the lowest ranking countries in
the 2018 Human Development Index Report are aect-
ed by violent conict.¹ Peace and development mutually
reinforce each other; violence and conict can reverse
development gains, by causing death, disease, deprivation,
displacement, destruction, damage as well as leading to
a decline in public services and limited access to
resources, which in turn can provoke grievances resulting
in mistrust and conict. On the other hand, peace can
sustain development gains. Because of this interdepen-
dence, the UN system is working closely together to
ensure progress on the 2030 Agenda for Sustainable
Development.
The 2016 twin resolutions on
Sustaining Peace and the 2030 Agenda
for Sustainable Development
On 27 April 2016, the General Assembly and the
Security Council adopted substantively identical
resolutions on peacebuilding², concluding the 2015
review of the UN Peacebuilding Architecture. Member
States demonstrated their commitment to strengthen-
ing the United Nations’ ability to prevent the ‘outbreak,
escalation, continuation and recurrence of [violent]
conict’³, address root causes and assist parties to conict
to end hostilities in order to ‘save succeeding genera-
tions from the scourge of war’ as stated in the opening
sentence of the UN Charter.
The resolutions introduced the term ‘sustaining peace’,
which rather than redening peacebuilding, provides
for an expanded scope. The resolutions recognise that
development, peace and security, and human rights are
interlinked and mutually reinforcing. Sustaining peace
is broadly understood as a goal and a process to build
a common vision of a society where the needs of all
segments of the population are taken into account. It
encompasses activities aimed at preventing the outbreak,
escalation, continuation and recurrence of conict,
addressing root causes, assisting parties to conict to
end hostilities, as well as ensuring national reconcilia-
tion and moving towards recovery, reconstruction and
development. It also emphasises that sustaining peace is
a shared task and responsibility that needs to be fullled
by the government and all other national stakeholders,
and should ow through all three pillars of the United
Nations engagement at all stages of conict, and in all its

142
Time to invest
dimensions, and needs sustained international attention
and assistance.
The 2030 Agenda pledges to ‘leave no one behind’ and
‘endeavour to reach the furthest behind rst’⁴, recognis-
ing that failing to do so drives inequalities and under-
mines human rights, social cohesion, peace and sustain-
able development. Member States also stressed that peace
cannot be sustained without sustainable development,
and peace and security is crucial in making progress on
sustainable development. A comprehensive whole-of-
system response, including greater cooperation and com-
plementarity among development, human rights, peace
and security and humanitarian action, is fundamental to
eciently and eectively attaining the Sustainable
Development Goals (SDGs) – as well as sustaining peace.
The SDGs are universal, interlinked and integrated.
As many as 36 targets across the 2030 Agenda are
directly related to violence, justice or inclusivity, for
example:
• SDG 4 on education includes references to
discrimination in education, education on human
rights and gender equality, ‘promotion of a culture
of peace and nonviolence’ and ‘safe and non-violent
learning environments for all’;
• SDG 5 on gender equality aims to eliminate all
forms of violence against women and girls, and
ensure their full and eective participation;
• SDG 8 on decent work and economic growth
aims to eradicate forced labour, modern slavery and
human tracking, secure the prohibition and elim-
ination of the worst forms of child labour, protect
labour rights and achieve equal pay for work of
equal value; and
• SDG 10 on inequalities aims to promote social,
economic and political inclusion and safe migration.
Moreover, there are several SDGs that are critically
important in our eorts to address the drivers and root
causes of conict, including SDG 11 on safe, resilient and
sustainable cities and public spaces, SDG 6 on equitable
access and management of water resources, SDGs 13, 14,
and 15 on management of natural resources and SDG
17, which aims to build stronger multi-stakeholder part-
nerships for the goals.
The Peacebuilding Fund’s investment
in the Sustainable Development Goals
Building on the conviction that sustaining peace and
sustainable development are complementary and
mutually reinforcing, the Peacebuilding Support Oce
embarked on a portfolio review of projects funded by
the Peacebuilding Fund (PBF) from 2015 to 2018 to
assess their contribution to the Sustainable Develop-
ment Goals.
During the period 2015-2018, the PBF has contributed
83% of its total allocation to the SDGs. The US$ 368
million investment of PBF funding towards the SDGs
goes beyond SDG 16 and covers dierent aspects of
peaceful, just and inclusive societies that are included
across several SDGs. The interlinkages and integrated
nature of the SDGs are of crucial importance to en-
suring that the purpose and vision of the 2030 Agenda
are realised. Therefore, eorts to achieve one goal can
be instrumental to the achievement of other goals. For
example, actions to address eradicating poverty (SDG
1), reducing inequalities (SDG 10), promoting quality
education (SDG 4), achieving gender equality (SDG 5),
addressing climate change (SDG 13), supporting peace
and strengthening institutions (SDG 16) and promoting
partnerships (SDG 17) can have mutually reinforcing
eects.
Contrary to the assumption that investment in peace-
building may divert funds from more traditional forms of
development assistance, the review also highlighted how
PBF’s contribution to the SDGs is complementary and
additional to other development eorts. This is partly the
case because contributions to the PBF are coming for a
number of donors from dierent budget lines. Further-
more, through its catalytic role, PBF interventions
usually encourage further funding in development
The Peacebuilding Fund
The Secretary-General’s Peacebuilding Fund
(PBF) is the organisation’s financial instrument
of first resort to sustain peace in countries or
situations at risk or affected by violent conflict.
The PBF may invest with UN entities, govern-
ments, regional organisations, multilateral
banks, national multi-donor trust funds or civil
society organisations. From 2015 to 2018,
the PBF has allocated over US$ 368 million to
47 recipient countries. Since inception, 58
Member States contributed to the Fund,
33 in the present 2017-2019 Business Plan.
The PBF works across pillars and supports
integrated UN responses to fill critical gaps,
acts quickly and with flexibility to political
opportunities and catalyse processes and
resources in a risk-tolerant fashion. The PBF
also enhances coherence among various actors
and is able to invest in areas where others are
hesitant to venture, which is critical in
conflict-affected settings.
Time to invest
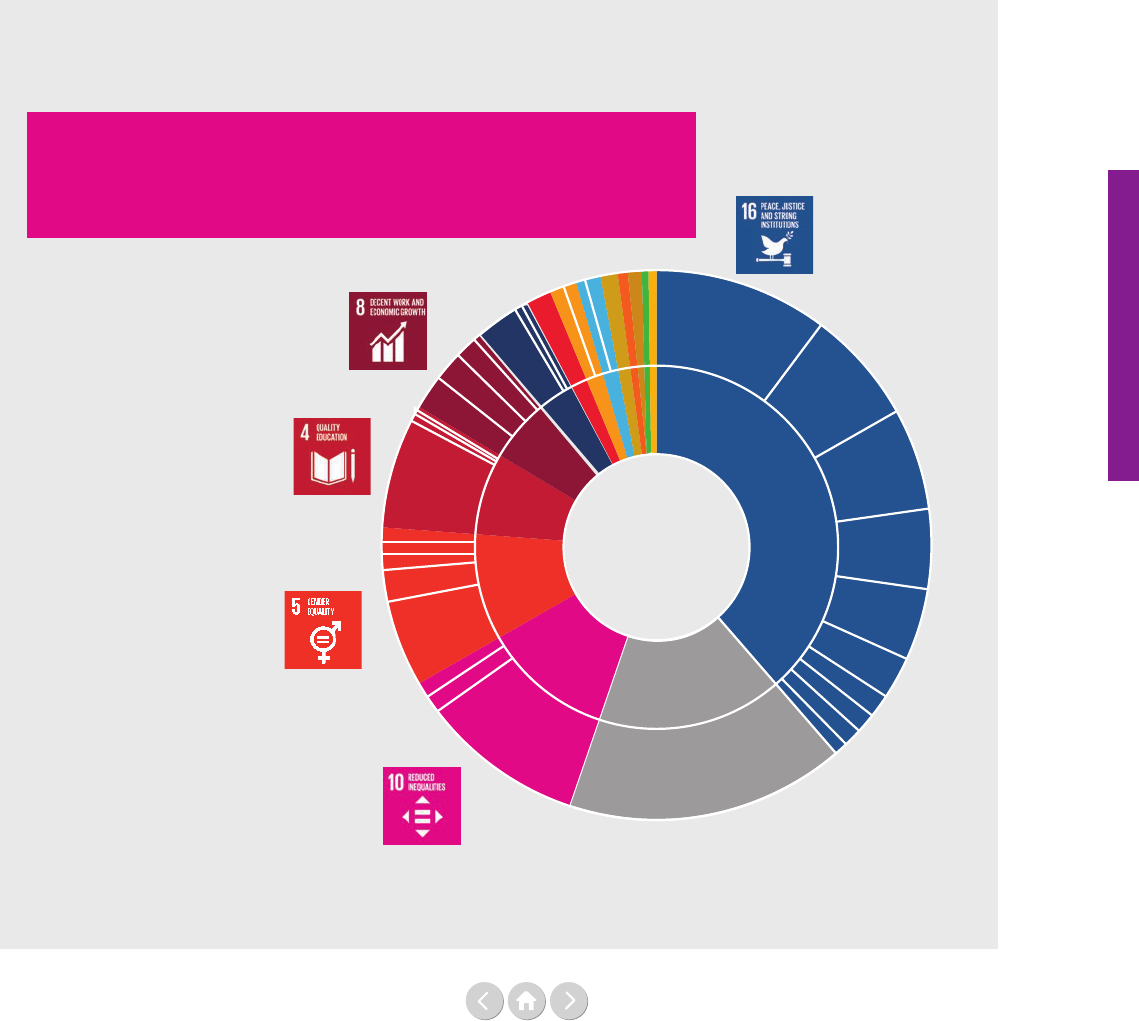
143
Time to invest
initiatives. The 2018 Report of the Secretary-General
on peacebuilding and sustaining peace⁵ highlights the
role of the PBF as a critical vehicle as the UN steps up
its eorts to build resilience and drive integrated UN
action for prevention. The Report stresses the Fund’s
role in supporting national partners and United Nations
country teams in responding strategically to peacebuild-
ing needs, aiding transitions from mission to non-mission
settings and facilitating alignment with international
nancial institutions and other partners.
A 2017 evaluation conducted for the PBF project portfo-
lio in Guinea, for example, highlighted that PBF projects
created entry points for risk taking and innovative inter-
ventions. This oered the basis for subsequent longer-term
Figure 1: Percentage spending per SDG target 2015-2018
Source: Peacebuilding Support Oce, ‘Peacebuilding Fund Investment in the
Sustainable Development Goals’, (report, United Nations, May 2019), p4.
S
D
G
4
S
D
G
8
S
D
G
1
7
S
D
G
5
S
D
G 1
0
S
D
G
1
6
O
t
h
e
r
83% of Peacebuilding Fund investment
can be directly linked to an SDG target
38%
towards targets
under SDG 16
11% towards targets under SDG 10
on reducing inequalities
10% towards targets under
SDG 5 on gender equality
8% towards targets under
SDG 4 on quality education
5% towards targets under SDG 8 on
decent employment and livelihoods
1
6
.6
16
.3
16
.
a
1
6
.1
1
6
.
7
1
6
.
1
0
O
t
h
e
r
P
e
a
c
e
b
u
i
l
d
i
n
g
o
b
j
e
c
t
i
v
e
s
1
0
.
2
5.
5
5
.
2
4
.
7
8
.
3
1
7
.
9
and larger-scale initiatives in the three priority areas
(Security Sector Reform, National Reconciliation, Youth
and Women’s Employment). This conrms the PBF’s
catalytic value and its role of mobilising new partners.⁶
Looking at Figure 1 below, the inner circle of the pie-
chart shows the percentage of PBF spending towards the
SDGs for the period 2015-2018. The outer circle shows
the share of funds allocated to specic targets under each
SDG. The ‘Other’ category represents other peacebuild-
ing functions that are not directly related to a specic
SDG target. This includes some enabling functions,
which are sometimes funded by PBF projects, such as
programme coordination and secretariat.
Time to invest
144
Time to invest
SDG 16
• Support to national dialogue and reconciliation processes (16.3; 16.7)
• Transitional justice (16.3; 16.a)
• Capacity building for institutions at all levels to increase transparency and
accountability (16.6; 16.7; 16.a)
• Community-based conict prevention measures, including early warning
mechanisms (16.1; 16.7)
• Support formal or informal justice systems for peaceful resolution of conict
(16.1; 16.3)
Niger: Establishing early warning mechanisms for conict prevention
at the local level (2016)
In 2016, the PBF funded a project in eight rural communities, in the regions of
Tillabery, Agadez and Tahoua in Niger, to foster social cohesion and peaceful
coexistence among men, women, boys and girls, including opinion leaders, Malian
refugees living in the communities, and security and defence forces. The project helped
to strengthen collaboration among the population, particularly women and youth,
security and defence institutions and local authorities. The project used dierent
capacity-building activities, community-based initiatives and awareness-raising
campaigns to improve the knowledge and skills of security personnel and the
communities. Those activities resulted in the establishment of local peace and security
committees for early warning and conict prevention. The committees are composed
of dierent members of the community. They seek to identify risks of social fractures
and to address potential conict triggers through mediation and other peaceful
resolutions. The project also facilitated the launch of a pilot initiative for the creation
of local police forces in eight target communities. In addition, the project involved
members of the communities in various joint activities around, for example, water and
sanitation, land rehabilitation, planting trees, sports, joint training and awareness
campaigns with the aim of improving technical skills for basic services and strengthening
mutual understanding and trust within the communities.
SDG 10
• Support access to social services for all (10.2)
• Support inclusive decision-making processes at national and local level (10.2; 16.7)
• Establish participatory processes to develop policies that are responsive to the needs
of dierent sectors of the society (10.2; 16.7)
• Foster the inclusion of women and youth in all aspects of peace and security and in
socio-economic arenas (10.2)
Sri Lanka: Youth participation in the peacebuilding process (2017)
This project worked with women leaders and political parties to increase female
political representation though a system of quotas in local government elections.
In addition, the project created platforms for women and youth voices to be heard
through capacity building and advocacy campaigns addressing cultural stereotypes and
civic engagement. Catalysing women and youth participation in local governance and
decision-making contributed to creating a sense of ownership and inclusiveness in the
peacebuilding process.
Examples of PBF funded activities contributing to the SDGs
Time to invest
145
Time to invest
Time to invest
SDG 5
• Combat gender-based violence (GBV) (5.2)
• Provide services to GBV survivors and assist them in their reintegration (5.2)
• Support women’s participation in political and socio-economic decision-making
processes (5.5)
Central African Republic: Promotion of women’s political participation
and female leadership in the peacebuilding process (2018)
In 2018, the Peacebuilding Fund support led to the revision of the Central African
Republic Electoral Code in anticipation of the 2020–2021 elections, making it possible
to lay the foundation for better involvement of women and girls in decision-making
processes. The project enhances women’s and girls’ leadership and engagement in the
national dialogue and public life in Central African Republic. The project recognises
the critical contribution that women make in national planning in Central African
Republic, including the implementation of reconciliation and recovery activities.
SDG 4
• Facilitate education opportunities that promote the values of tolerance, respect,
empathy and mutual understanding (4.7)
• Help communities develop knowledge about common history, past experiences
and roots of existing conicts to alleviate inter and intra-communal grievances,
increase a sense of belonging and strengthen national identity (4.7)
• Educate about human rights rule of law and peaceful means to settle conicts (4.7)
Kyrgyzstan: Increase community resilience to violent ideologies (2017)
In 2017, the Peacebuilding Fund funded a project in Kyrgyzstan focusing on women
and men, boys and girls in target communities, taking a more critical stance on ideol-
ogies that instigate violence. Through the project, schools, civil society and religious
leaders received capacity-building and became partners to provide alternative, positive
messages and build meaningful dialogue, encouraging people to gain a better sense of
belonging to their community and to participate in local development.
SDG 8
• Provide reintegration and livelihood opportunities to ex-combatants (8.6)
• Support to economic and labour market policies should focus on improving labour
market conditions, with particular attention to reducing inequalities for women
and youth, and marginalised groups (8.3; 8.5)
Colombia: Demining and reintegration of former combatants for local peacebuilding (2018)
This project established Humanicemos DH, a civil society organisation composed of
former Revolutionary Armed Forces of Colombia–People’s Army (FARC-EP) com-
batants working on humanitarian mine action. Through the organisation, 146 former
combatants (women and men) are being reintegrated into their communities and will
contribute to their socioeconomic development. Humanecimos DH will be supported
with technical and operational capacity through partnerships with mine-action
organisations with regional and international experience. Thus far, several former com-
batants have received training in areas such as mine-awareness education, recognition of
explosive devices, information management and mapping. They have also learnt about
the use and maintenance of mine detectors. This project will contribute to peace-
building at the local level, not only by giving former combatants an alternative source
of income, but through its mine action focus, it will contribute to clearing parts of land,
therefore increasing the security of communities and opening new opportunities for
livelihood-generating activities.

146
Time to invest
Time to invest
Footnotes
¹ UN Development Programme, ‘Human Development Indices
and Indicators’, (statistics, UNDP, 2018). Available at
http://hdr.undp.org/sites/default/files/2018_human_develop-
ment_statistical_update.pdf
² Referred to as the ‘Sustaining Peace resolutions’: UN Gen-
eral Assembly, ‘Review of the United Nations peacebuilding
architecture’, (resolution, A/70/262, UNGA, 12 May 2016).
https://undocs.org/A/RES/70/262 and UN Security Council,
‘Resolution 2282 (2016)’, (resolution, S/2282, UNSC, 27 April
2016) https://undocs.org/S/RES/2282(2016)
³ UN Security Council, (resolution, S/RES/2282, UNSC,
2016), page 2, see Footnote 2.
⁴ UN General Assembly, ‘Transforming our world: the 2030
Agenda for Sustainable Development’,
(resolution, A/RES/70/1, UNGA, 21 October 2015), page 3,
point 4. https://undocs.org/A/RES/70/1
⁵ UN Secretary-General, ‘ 2018 Report of the Secretary-
General on Peacebuilding and Sustaining Peace’,
(Report of the Secretary-General, A/72/707-S/2018/43, UN
General Assembly and Security Council, 18 January 2018).
https://undocs.org/s/2018/43 and https://undocs.
org/a/72/707
⁶ Transtec, ‘Evaluation du Portefeuille de projets du Fonds
de Consolidation de la Paix en Guinée :
Contrat No. PD/C0182/16’, (report, Transtec, 2017).
http://www.social-terrain.com/static/media/170717_
Rapport_Guinee_version_finale.pdf

147
OECD’s Total Official Support
for Sustainable Development
pilot study on peace and security
‘A key objective of TOSSD [Total Ocial Support for
Sustainable Development] as a new international statistical
standard is to help developing countries better map actual and
potential sources of nance for their development. Their support
and engagement is thus essential. In order to gather their per-
spectives and feed them into the development of the
TOSSD framework, six pilot studies are being carried out in
2018–2019.’¹
Pilot study on Peace and Security
The 2030 Agenda arms that ‘there can be no sustain-
able development without peace and no peace without
sustainable development’. Through Goal 16, which com-
mits countries ‘to promote peaceful, inclusive societies
for sustainable development, to provide access to justice
for all and to build eective, accountable and inclusive
institutions at all levels’, there is an acknowledgement
that political goals—including in relation to good gover-
nance and ending violent conict—should nd a place
alongside social, economic and environmental ones.
Sustainable development in the TOSSD context is
inherently linked to the Sustainable Development Goals
(SDGs). As agreed in the 2030 Agenda, peace and
security activities in pursuit of SDG 16 or other goals
could be considered for inclusion in TOSSD. A pilot
study has been launched to explore the relevance of
doing so and to make recommendations in this regard to
the TOSSD Task Force.
The pilot is based on a consultation with a wide range of
experts (international organisations, provider and partner
countries, civil society and academics) and a deep dive
into one specic provider country’s support to the
security sector (France). While the pilot will only be
nalised mid-June, preliminary ndings highlight that:
• Many stakeholders see an opportunity for TOSSD
to ll the existing gap in data on security expendi-
tures and better reect the humanitarian-develop-
ment-peace nexus.
• Activities in support of international peace and
security deserve some recognition in the TOSSD
framework, in particular under Pillar II on develop-
ment enablers and global challenges. Peace and
security that could be counted in TOSSD include
the United Nations Oce of Counter-Terrorism’s
(UNOCT) work on counter-terrorism, the United
Nations Oce on Drugs and Crime’s (UNODC)
activities, the United Nations Oce for Disarma-
ment Aairs’ (UNODA) actions on disarmament,
peacekeeping operations with a mandate to protect
civilians. Some areas clearly fall outside TOSSD
(military and other kinetic interventions by bilateral
providers).
• Safeguards need to be put in place to protect the
integrity of the TOSSD measure. In particular, civil
society organisations warn of risks of misuse of
funds in the eld of peace and security. Safeguards
could take the form of specic exclusions (lethal arms);
separate identication, within TOSSD, of expendi-
tures for peace and security; requirement that
activities have clear development outcomes and no
adverse impact on any of the SDG targets.
Footnote
¹ http://www.oecd.org/dac/financing-sustainable-
development/development-finance-standards/tossd-
country-pilot-studies.htm
Time to invest

148
Time to invest
Time to invest
Financing the
humanitarian-development-peace nexus
By the UN Multi-Partner Trust Fund Office (MPTFO)
A new generation of pooled funds is helping to bridge
the humanitarian-development nancing divide. These
exible instruments are demonstrating that well-designed
pooled funds can quickly pivot when faced with rapid-
ly changing conditions on the ground. They combine,
blend and sequence development, peace and humanitarian
funding streams in crisis-aected countries. They improve
cost-eciency, transparency and collective outcomes not
only by pooling resources and delivery systems, but also by
sharing, and thereby reducing, the risks that often arise in
highly volatile and unpredictable settings.
Context and challenge
Over the last few years, the volume, cost and length of
humanitarian assistance has increased dramatically. The
UN has estimated that US$ 21.9 billion will be needed
in humanitarian assistance in 2019¹ – a sharp increase
from US$ 12.8 billion just ve years ago. This increase
is due mostly to protracted crises, with 86% of
humanitarian nancing going to medium- or long-term
crises. Conict has become a very signicant driver of
humanitarian needs, as well as a signicant constraint on
achieving the Sustainable Development Goals (SDGs)
in fragile situations.
In 2016, participants of the World Humanitarian Summit
stressed the urgency of overcoming long-standing
attitudinal, institutional and nancial obstacles to
strengthening the collaboration between humanitarian
and development partners. Humanitarian and develop-
ment actors share the vision that investing in prevention,
mitigation and preparedness for early action, as well as
scaling-up of social protection programmes in order to
build resilience and reducing vulnerability and risks is
the best way to decrease humanitarian needs and ensure
that the goal of ‘no one left behind’ is met.
Subsequently in 2017, a United Nations Joint Steering
Committee to advance Humanitarian and Development
Collaboration chaired by the Deputy Secretary-General
was established. The Joint Steering Committee focuses
on three areas, of which one looks at achieving coherent
and appropriate nancing from all sources for collective
outcomes. Through workshops in Dakar, Copenhagen,
Istanbul, Entebbe and New York, key barriers and
enablers for eective humanitarian-development collabo-
ration were identied. Among those highlighted were the
challenges that humanitarian and development partners
request funding separately and also that donors provide
funding in a fragmented manner in protracted crisis.
The United Nations Department of Economic and
Social Aairs (UNDESA) data depicted in Figure 1
on the next page show that between 2012 and 2017 the
development component of the UN Ocial Develop-
ment Assistance (ODA) had an accumulated growth of
32%, while humanitarian ODA increased by 156%.²
An analysis of expenditures by the UN in the 12 crisis-
aected countries with the highest UN expenditure
shows that across all countries – with the exception of
Afghanistan – development oriented funding represents
a very limited portion of the overall UN funding enve-
lope. Figure 2 on the next page shows 2017 UN expen-
ditures and reveals that building resilience and support-
ing recovery are not the primary focus of UN interven-
tions in these countries.³ Achieving the longer-term goal
to ‘leave no one behind’ requires transcending the
humanitarian-development divide. This means identifying
collective outcomes over which humanitarian and
development actors can join forces to achieve over
multiple years. Stakeholders will also have to boost
development action in fragile and conict-aected states.
The Multi-Partner Trust Fund Oce is the UN
centre o f expertise on pooled nancing
mechanisms. Hosted by UNDP, it provides fund
design and fund administration services to the
UN system, national governments and non-
governmental partners. The MPTF Oce
operates in over 110 countries and manages a
total portfolio of US$ 12 billion in pooled funds,
involving more than 150 contributors and over
85 participating organisations.
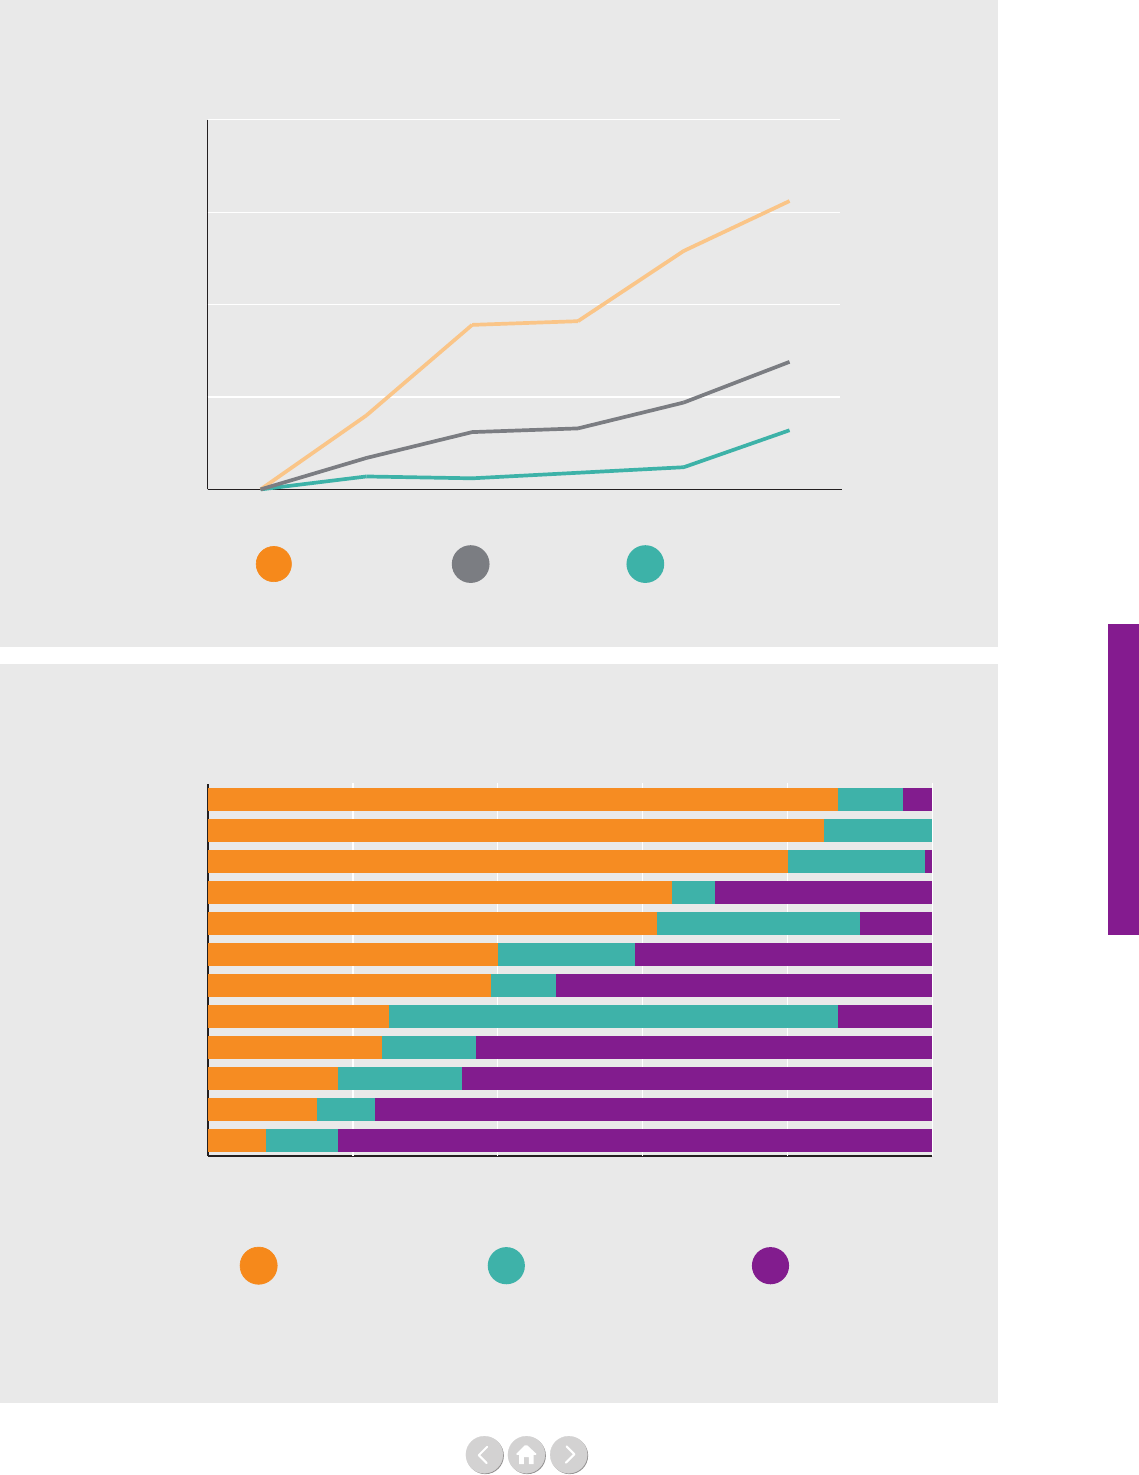
149
Time to invest
Time to invest
Figure 1: Real growth of ODA and of funding for UN operational activities for development,
2012-2017
Figure 2: UN humanitarian, development and peace expenditures as proportion of total, 2017
Source: Report of the Secretary-General (A/74/73-E/2019/4)
Source: Report of the Secretary-General (A/74/73-E/2019/4)
100%
150%
200%
250%
300%
201720162015201420132012
Humanitarian UN-OAD Development
20% 40% 60% 80% 100%
Peace
Development
Humanitarian
Mali
Central African Republic
Dem. Rep. of the Congo
Sudan
Afghanistan
South Sudan
Somalia
Iraq
Lebanon
Yemen
State of Palestine
Syrian Arab Republic
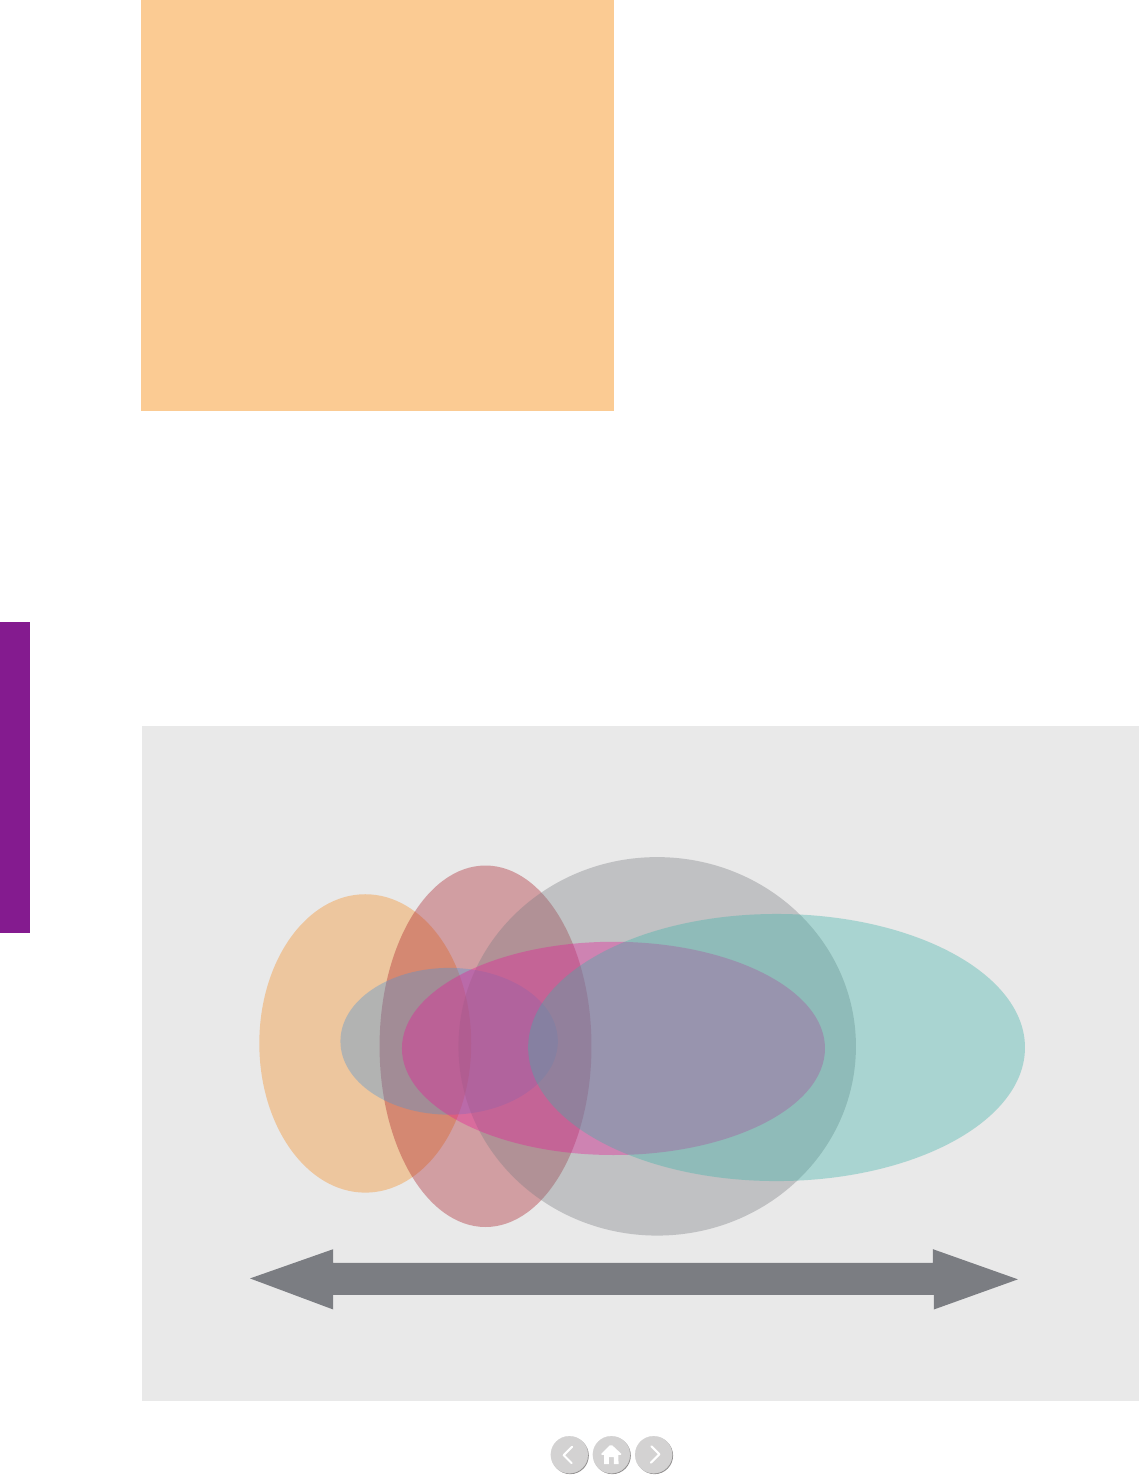
150
Time to invest
Time to invest
Funding can be turned from a divider
into an enabler
Financing modalities that support collective
outcomes can incentivise collaboration.
Together with partners, the Multi-Partner
Trust Fund Office (MPTFO) has been working
on a new generation of pooled funds that
facilitate the blending, sequencing and
cross-referring of development and humanitar-
ian funding. With some of these funds recently
established, the MPTF Office will continue
innovating to better address challenges and
capitalise on opportunities. Some promising
examples are showcased in the pages that
follow.
Figure 3: Combining and sequencing funding mechanisms
Source: Organisation for Economic Co-operation and Development (OECD)
Humanitarian
Flexible Pooled Funding
Early recovery
Stabilisation
Peacebuilding
Resilience
and
Prevention
Development
Rather than bridging these silos, nancing sources and
instruments frequently contribute to further dividing
the streams of external assistance. The strict separation
between humanitarian, development and peace funding
by donors, and the high level of earmarking towards
specic projects deter collaboration between sectors
and actors. In addition, pure development instruments
remain ill-equipped to deal with unpredictability and are
often not responsive enough to changing circumstances
on the ground.
The UN Secretary-General has asked fund contributors
to increase the portion of humanitarian appeal funding
to the UN Country-Based Pooled Funds to 15%, and
Member States have agreed to double the levels of
resources channelled through development related inter-
agency pooled funds by 2023, as part of the Develop-
ment Funding Compact. This makes the design of
pooled funding instruments which strengthen linkages
between humanitarian, development and peace
programmes now of utmost importance.
The advantages of pooled funds
for financing the
humanitarian-development-peace nexus
Flexibility
Pooled funding mechanisms are exible tools that can
easily be remodelled to address specic challenges and
enable new ways of working. Solutions to overcome the
humanitarian-development-peace (HDP) nexus
challenges have already been successfully piloted through
pooled funds at both global and country levels. Inno-
vation can happen at the design phase of the fund, as
illustrated by the Ebola Response MPTF, or it can be
integrated during the course of implementation, as in
the case of the Humanitarian Window of the Malawi
One Fund. Pooled Funds are versatile and oer the
ability to adapt to quickly changing situations.

151
Time to invest
Time to invest
Coherence
Well capitalised pooled funds act as centres of gravity to
improve eectiveness, reduce duplication and promote
alignment among UN agencies and beyond. Their gov-
ernance mechanisms allow a wide range of partners (no-
tably UN, development partners, national government
and civil society) to collectively agree on priorities and
strategies. As a result, they create synergies and comple-
mentarities with programmes funded from other sources
and implemented by other partners.
Collective outcomes
Pooled funds are investment vehicles designed to pro-
mote integrated, cross-cutting initiatives over a long
period of time. Compared to individual projects from a
variety of implementing entities, well designed pooled
funds can support comprehensive theories of change.
These can articulate the causal linkages and actions
required by all humanitarian-development and peace
partners to achieve collective outcomes.
Managing risks
Pooled funds oer a number of options to better manage
risk for individual development partners, particularly in
fragile and conict-aected contexts. The governance
arrangement of a pooled fund, which brings the govern-
ment, UN and development partners regularly together
in a steering committee setting, provides a unique
platform for developing a shared understanding and
coordinated management of risks. This allows for a better
balance between contextual risk, programmatic and
institutional risks. Shared decision making and oversight
in pooled funds spread individual donor exposure to
political and reputation risk.
Experience and examples
The examples below demonstrate that there are a range
of approaches for designing fund instruments to advance
humanitarian, development and peace collaboration.
These approaches can be applied to existing funds or
implemented through the design of new mechanisms.
Reconciliation, stabilisation and resilience in South Sudan
The South Sudan Multi-Partner Trust Fund for
Reconciliation, Stabilization, Resilience (RSRTF),
established in 2018, is closely aligned with the New Way
of Working, supporting the realisation of collective
outcomes that reduce risk, vulnerability and overall levels
of humanitarian needs over time. The Fund has adopted
an area-based programming approach, targeting distinct
geographic locations where opportunities exist to deliver
transformational change and move beyond cycles of
conict and violence. In each area, in close consultation
with the local authorities and the local community,
development, humanitarian and peace actors – the
United Nations Mission in South Sudan (UNMISS),
UN agencies, non-governmental organisations (NGOs)
– adopt a joint strategy. In support of the locally
adopted area-specic strategy, the South Sudan RSRTF
breaks the humanitarian, peace and development silos by
funding programmes that, implemented together, create
synergies and oer a holistic response to complex chal-
lenges. The governance structure of the Fund reects this
approach at both local and national level by ensuring the
participation of all stakeholders, including representatives
of entities focusing primarily on peace or humanitarian
aspects.
The Ebola response MPTF
The UN Secretary-General’s Ebola Response MPTF,
was funded by a blend of humanitarian and develop-
ment nancing, and provides another good example of
a pivot funding instrument. It was capable of addressing
both immediate humanitarian and peacebuilding needs,
as well as longer-term development priorities. From
the onset, operation of the Fund was informed by the
STEPP approach (1. Stop the outbreak; 2. Treat the
infected; 3. Ensure essential services; 4. Preserve stability;
and 5. Prevent outbreaks in countries currently unaect-
ed). It encompassed emergency response, prevention and
recovery. The addition of a Recovery Window in 2015
with four strategic objectives (1. Health, Nutrition, and
Water, Sanitation and Hygiene (WASH); 2. Socio-Eco-
nomic Revitalisation; 3. Basic Services and Infrastructure;
and 4. Governance, Peacebuilding and Social Cohesion)
also bridged the humanitarian-development divide,
further operationalising the nexus approach to nance
(see Figure 4 on the next page).
The Malawi One Fund
In 2012, the Steering Committee of the Malawi One
Fund decided to open a Humanitarian Window to con-
vert this pure development instrument into a pivot fund.
The aim was to address both humanitarian and develop-
ment needs under strong national leadership and owner-
ship. The ancillary benets have been considerable, with
the Window increasing transparency, strengthening co-
ordination and hastening disaster response. The Humani-
tarian Window supports the government-led emergency
response plan and is co-chaired by government. It has its
own Terms of Reference and governance body respon-
sible for programming and operational oversight. With
proposals developed in consultation with humanitarian
cluster members, it has increased coordination among
UN agencies, as well as implementing organisations. The
Humanitarian Country Team provides a platform where
priority setting and implementation is discussed, further
increasing transparency among humanitarian actors.
Before the establishment of the Humanitarian Window,
resource mobilisation invariably commenced after a
disaster occurred, delaying the response to aected com-
munities. The existence of the Humanitarian Window
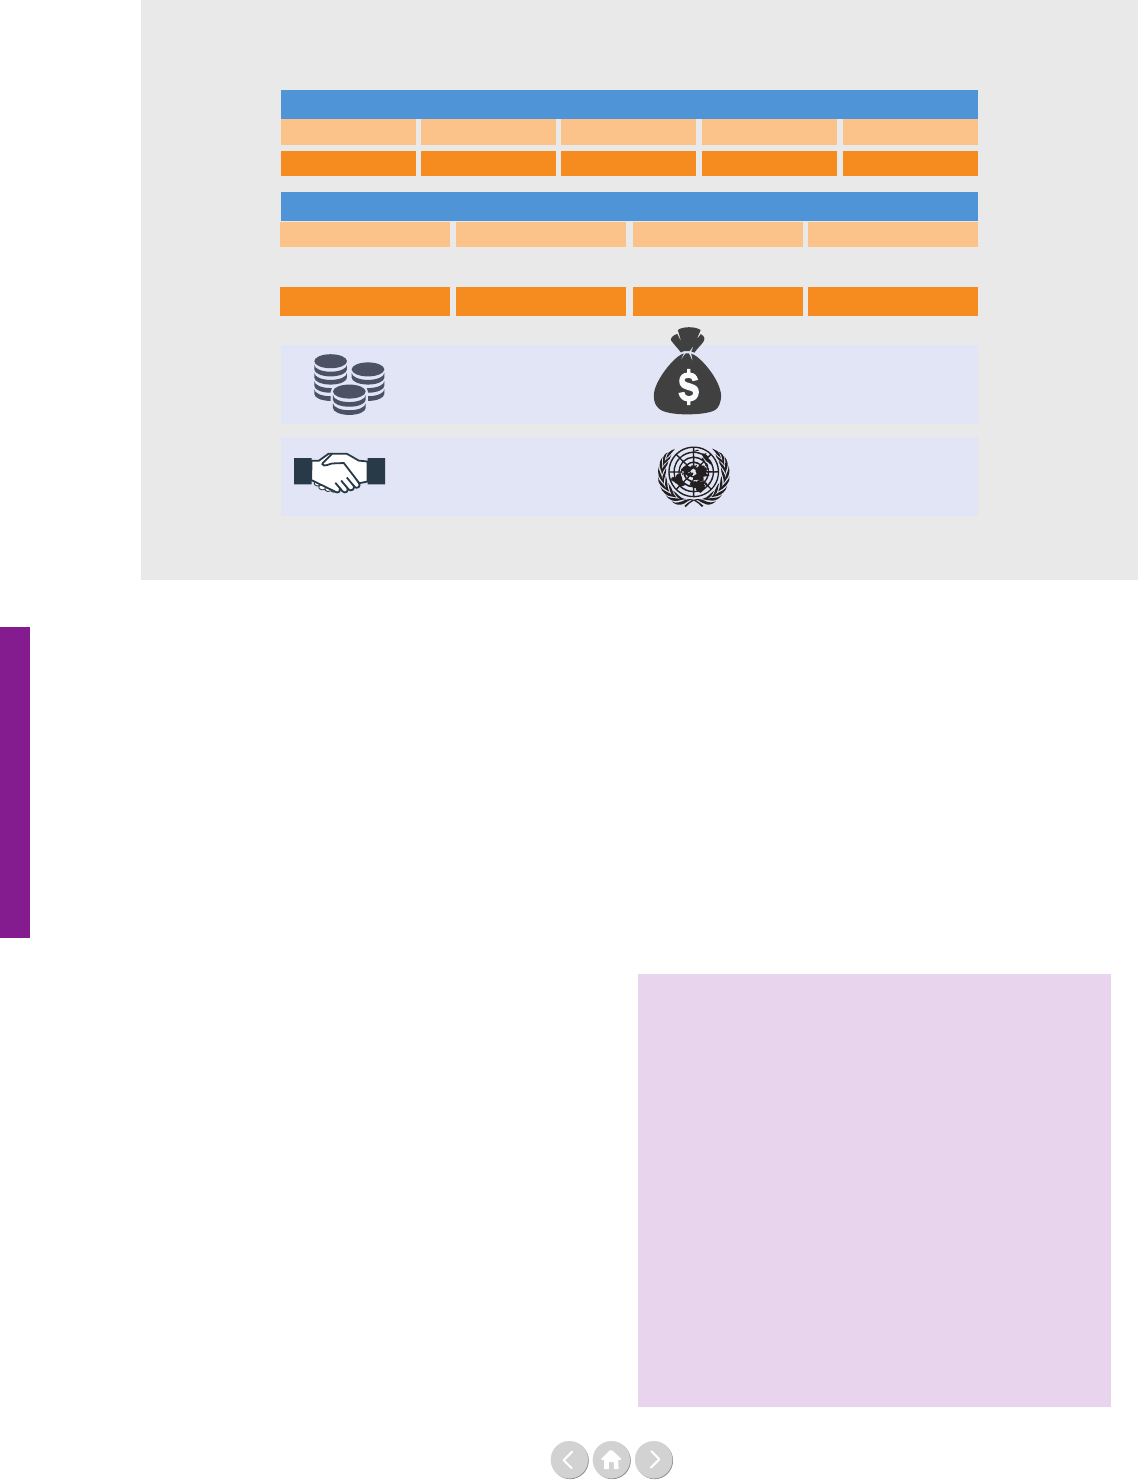
152
Time to invest
Time to invest
during the 2015 oods, for instance, enabled a quick
activation of relief eorts, averting further human misery.
The UN Post-Conict MPTF for Colombia
The UN Post-Conict MPTF for Colombia represents
an important strategic alliance between the Government
of Colombia, the UN and the international community,
which is working together to advance the post-conict
peace and stabilisation agenda in Colombia. A second
phase of the Fund has been approved since December
2018, including four strategic action lines: i. Stabilisation;
ii. Reincorporation; iii. Victims and Transitional Justice;
and iv. Communications. When the MPTF was estab-
lished in February 2016, the Oce for the Coordination
of Humanitarian Aairs (OCHA) Colombia Humanitar-
ian Fund, which was initiated in 2009, was phased out.
OCHA joined the Post-Conict MPTF, and the two
entities have worked closely to develop pilot initiatives
that meet humanitarian, transition and development
needs. The interventions focused on improving co-
ordination mechanisms and information management
systems. Further, successful projects were scaled-up
leveraging existing networks and partnerships.
Way forward
Building on the expertise and knowledge on pooled
funds, the UN Multi-Partner Trust Fund Oce is
leading a new workstream with the United Nations
Development Programme (UNDP), OCHA and other
UN partners on the best design for future country-level
exible funding architecture and instruments that more
eectively and eciently support the HDP nexus. The
overall purpose is to capitalise on the existing compar-
ative advantages of pooled instruments and translate the
overall global discourse on the HDP nexus and the New
Way of Working approach to concrete outcomes. With
new design parameters for nexus-oriented country level
pooled funding mechanisms, there will be better align-
ment of nancing instruments across the nexus, stronger
leveraging of synergies and more impactful and eciently
achieved results for all.
RESPONSE
S
top Treat
Ensure
Preserve Prevent
35.7 million
2.5 million
166 million
contributed
47 contributors
including private sector
163 million
allocated
14 UN entities
2.2 million 2 million 0.5 million
RS02RS01 RS03 RS04
Socio-economic
revitalisation
Health, nutrition
and WASH
Basic services and
infrastructure
Governance, peacebuilding
and social cohesion
57 million 19 million 20 million 24 million
RECOVERY
Footnotes
¹ United Nations Office for the Coordination of
Humanitarian Affairs (OCHA), ‘Global Humanitarian
Overview’, (report, UNOCHA, 2019).
https://www.unocha.org/global-humanitarian-over-
view-2019
² United Nations Secretary-General, ‘Implementation of
General Assembly resolution 71/243 on the quadrennial
comprehensive policy review of operational activities for
development of the United Nations system, 2019’,
(Report of the Secretary-General, A/74/73-E/2019/4,
United Nations General Assembly Economic and Social
Council, 18 April 2019). https://undocs.org/A/74/73
³ Report of the Secretary-General, A/74/73-E/2019/4,
UNGA ECOSOC, 18 April 2019. See Footnote 2.
Figure 4: The Ebola response MPTF
Source: UN Multi-Partner Trust Fund Oce (MPTFO)

153
Time to invest
Time to invest
Ambassador Lana Zaki Nusseibeh is the
Permanent Representative of the United Arab
Emirates to the United Nations in New York.
Ambassador Nusseibeh currently serves as
co-chair of the Intergovernmental Negotiations on
Security Council Reform, and has also
previously served as Vice-President of the General
Assembly for the 72nd session. She has also served
as President of the UN Women Executive Board
in 2017, as co-facilitator of the Ad Hoc Working
Group on the Revitalization of the UN General
Assembly for the 71st session of the General
Assembly, and as co-facilitator for the overall review
of the implementation of the outcomes of the
World Summit on the Information Society (WSIS)
in 2015. Prior to her appointment as Permanent
Representative to the UN, Ambassador Nusseibeh
served in several capacities within the UAE
Ministry of Foreign Aairs.
Forecast-based financing:
A breakthrough at last
for humanitarian financing?
By Lana Zaki Nusseibeh
Humanitarian nancing is rarely an uplifting eld.
Its dening feature is an ever-widening gap between
resources and needs, with most global appeals achieving
just 50 to 60% of their nancing goals. At the same time,
evidence mounts that if we could ‘just’ ramp up
spending on prevention, we might be able to make a
dent in that gap. The ‘US$ 1 spent on prevention saves
US$ X in humanitarian response’ adages become more
compelling every year. The situation is further compli-
cated by a wide range of barriers to change – public
nance shortages, donor regulations that tightly dene
what is a humanitarian activity and what is a develop-
ment activity, and, notably, the diculty in justifying
prevention in a world where emergency relief needs
already outstrip supply.
This context is why forecast-based nancing is so
important – potentially game-changing. Using credible
scientic forecasts of predictable weather events (like
droughts, storms, oods and heatwaves), the approach
releases aid in advance of an expected disaster, based on
a pre-agreed protocol. The results from forecast-based
nancing’s implementation over the last several years,
primarily by the International Federation of Red Cross
and Red Crescent Societies (IFRC), are what humani-
tarian nanciers dream of: more lives have been saved,
at a sharply reduced cost. It is also a tool for the times.
In the age of climate change, more and more disasters
and stresses will be climate-induced, and they will
accordingly be predictable.
The advent of forecast-based nancing is not a silver
bullet – that is clear. It is not going to eliminate what
is often a US$ 10+ billion annual gap in humanitarian
nancing. But it provides, for the rst time, a very
concrete and politically feasible way to do what the
UN and international humanitarian system struggle to
grapple with: prevent rather than react. For this reason,
a growing chorus of countries and agencies, including
the United Arab Emirates (UAE), are calling for a step-
change at the UN. Forecast-based nancing is ready to
go mainstream in the humanitarian system.
Financing context
The annual contributions for humanitarian action have
skyrocketed by 1,200% since the early 2000s, but recent
years have still seen gaps of up to US$ 15 billion
between needed and available resources. In 2018, the
UN called for US$ 22.5 billion and received around
US$ 14 billion. For 2019, the UN estimates that 131.7
million people are in need of humanitarian assistance,
and US$ 21.9 billion is required to help 93.6 million of
them in the worst circumstances. Most of these numbers
are attributed to conict, and climate change is rapidly
adding to them.
We spend a lot of time in the UAE thinking about
possible ways to address this situation. The UAE is one
of the largest humanitarian donors in the world on an
absolute level, and the largest donor across all elds in

154
Time to invest
Time to invest
terms of aid as a percentage of gross national income
(GNI). Many of the worst humanitarian crises are in
countries in our region. So it is a constant concern that
the humanitarian nancing gap remains so persistent.
There are a number of very good solutions that have
gained intellectual traction – for instance, in early 2016,
our prime minister, His Highness Sheikh Mohammed
bin Rashid Al Maktoum, hosted the launch of the UN
High-Level Panel on Humanitarian Financing Report,
which lists many innovative ideas to close the funding
gap. But there are an equal or greater number of reasons
for the inability to make real implementation progress
– from those I mentioned above, to the failure of peace
negotiations, to the political gauntlet of trying to pass a
tax on certain transactions to fund humanitarian relief.
That is perhaps why so much recent focus has been on
cutting overhead costs of humanitarian agencies.
Prevention has perhaps been the hardest nancing nut to
crack. The logic of prevention is nothing new, and few
people would argue against it, not least in the humani-
tarian eld.
The UN has always faced this type of challenge on an
unbelievably vast scale – how to invest to stop the next
war? The next Ebola outbreak? The likelihood of child-
hood stunting? As a system, we are more often than not
reactive, despite knowing better. Peacekeeping is funded
dramatically more than peacebuilding. Disaster clean-up
receives many more magnitudes of money than disaster
risk reduction.
In the humanitarian space, there is a further dimension
hobbling prevention: many donors and agencies cannot
politically aord to be ‘wrong’ about a crisis. They, and
their constituents, typically must see evidence of need
(a devastating media report, a social media storm) to
justify action. Spending money to mitigate crises that
‘might’ happen feels like a tremendous gamble, with
the lives of people caught in existing crises hanging in
the balance.
Forecast-based financing to the rescue
The UAE’s own interest in forecast-based nancing
stems from a joint identication by our climate and
international cooperation ministers that many recent
climate-induced disasters were in fact accurately and
scientically predictable. In response, they were both
looking for more immediate solutions than to simply
‘stop emitting greenhouse gas emissions’.
Forecast-based nancing marries these two portfolios:
climate science and humanitarian response. In its basic
form, it is an agreement among a group of stakeholders
to follow a specic humanitarian protocol when a fore-
cast passes a pre-agreed threshold – a trigger. For
instance, a government and its Red Crescent society
could agree that if a certain meteorological entity
forecasts that a storm is likely to hit at a certain level of
intensity, they will immediately proceed to implement
a list of activities, such as pre-positioning of supplies,
reinforcement of hospitals and release of cash-based
assistance to families, so they do not have to sell their
possessions to buy food.
This approach at once addresses several major barriers
to the shift into prevention. Perhaps most importantly,
it does not blur the lines between development and hu-
manitarian nancing. Disaster risk reduction is often too
much of a grey zone for the UN, donors, and
governments. It focuses on addressing long-term,
systemic risks – such as not building in ood zones, or
restoring mangroves, or training local rst-responders
over many years. It has clear humanitarian benets, but
it is too far removed from immediate need for many
relief governance systems. Forecast-based nancing, by
contrast, is about responding to near-term, specic risks
– typically in the range of hours to a few months. It does
not take money away from humanitarian victims and
give it to development actors; instead, it advances money
to people who are imminently going to be in a
humanitarian situation and whom relief actors are
already mandated to help. If disaster risk reduction is
akin to eating well and exercising, forecast-based
nancing is akin to having an EpiPen on hand because
a swarm of bees is trying to get into your house and
you are allergic. It is a much tighter denition of
prevention, and one that humanitarian actors can easily
accommodate.
Furthermore, forecast-based nancing reduces the
responsibility of being ‘wrong’ about a crisis, because
scientic data is being used – which is already quite
accurate and getting even more precise as climate science
advances. Donors and governments are also not making
a personal call on whether to release funds, but following
a pre-agreed protocol. Of course, we know that forecasts
will sometimes still be wrong; a hurricane can change
course at the last minute. However, for those entities
with greater risk sensitivity, forecast-based nancing can
also have a ‘pause’ phase before a protocol is followed, in
which the science can be reviewed and weighed in the
bigger humanitarian context.
Not least, there are the benets. Forecast-based nancing
has been operating successfully in a number of countries,
including Bangladesh, Peru, and Mozambique, through
IFRC, with support from Germany. Illustratively in
Bangladesh, the national Red Crescent society dispersed
US$ 60 (one month’s average salary) to around 1,000
households in an area that was credibly predicted to
ood. The ood sadly did occur, but the fall-out was
reduced. IFRC found that the households used the

155
Time to invest
Time to invest
money to buy food for animals – their most precious
asset – or evacuate them, resulting in 40% less loss or
forced sale of livestock compared to households that did
not receive payments. Additionally, 50% fewer house-
holds took out high-interest loans in the aftermath.
And to return to the adage about US$ 1 spent on
prevention, a number of studies, from the World Food
Programme (WFP), the United Nations Children’s Fund
(UNICEF), IFRC and the World Bank, among others,
indicates that savings can range from US$ 2 to US$ 12
in avoided humanitarian response.
On this basis, agencies like WFP (with its FoodSecure
programme) and the Food and Agriculture Organization
of the United Nations (FAO), as well as the Central
Emergency Response Fund, under the UN Oce for
the Coordination of Humanitarian Aairs (OCHA),
have joined IFRC in setting up forecast-based nancing
vehicles or incorporating elements of the approach into
their work. Notably, the World Bank and its partners,
including the UN, are now also looking to apply the
concept in the global response to famine. The Famine
Action Mechanism represents potentially the biggest
global eort yet to marshal data and set triggers to drive
prevention, based on a set of technically sound indicators
that allow judgement of when early intervention should
occur in a situation likely to worsen to famine.
Where from here?
There is a strong tendency to create a new fund or
specialty window for breakthrough solutions, but we, in
the UAE, would like to avoid that splintering.
Rather, what we are calling for is a system-wide embrace
of forecast-based nancing. We would like for the
majority of UN humanitarian funds – especially pooled
funds – to sign up to the protocols that govern preventa-
tive response, and we would like fund managers to have
the authority, in consultation with their stakeholders, to
determine whether response is automatic or preceded by
a ‘pause/review’ phase. For instance, we would consider
the Famine Action Mechanism as a perfect opportuni-
ty for multiple existing funds to agree to respond to its
triggers jointly, rather than create a new fund. We would
also like development and humanitarian actors to
cooperate in designing and nancing the protocols.
None of this is a small request. It requires not only
signicant on-the-ground legwork to establish data
sources and protocols, but also a willingness of UN
agencies and donors to accept pre-disaster as closer to
post-disaster in the hierarchy of humanitarian priorities
than ever before. What is dierent with forecast-based
nancing, and what gives me hope, is that its inherent
humanitarian nature and its scientic strength make it
a much easier innovation to champion, a ‘safe’ way to
move past the barriers and allow humanitarian preven-
tion to become as much practice as norm.

156
Time to invest
Time to invest
World Bank catastrophe bonds as an
innovative development financing tool
By Michael Bennett and Rebeca Godoy
Michael Bennett is the Head of the Derivatives
and Structured Finance team in the World Bank
Treasury, where his area of responsibility includes
execution of catastrophe risk transactions. He has
worked with the World Bank since 2000 and is a
1990 graduate of the Columbia University School
of Law.
Rebeca Godoy joined the Capital Markets group
of the World Bank Treasury in December 2012 as a
Senior Financial Ocer. Her current responsibili-
ties involve working with World Bank’s clients in
advising and executing dierent types of nancial
and non-nancial coverage products in the
international markets: from market risk coverage
to commodities, catastrophes and weather hedges.
The devastating cost of
natural disasters in the developing world
Many countries around the world are extremely vulner-
able to natural disasters, such as earthquakes, hurricanes,
volcanic eruptions, tsunamis, severe droughts or epidemic
outbreaks. While such natural disasters do not discrim-
inate between developed and developing countries, the
long-term economic impact on a developing country of
such a disaster can be many times more severe than if a
similar event occurred in a developed country.
For a developing country, the costs of responding to
the disaster can draw money away from funding other
development priorities, such as education, health and
transportation. As a result, the impact of the disaster can
inict damage not just on the people and infrastructure
directly aected by the event itself, but more broadly on
all sectors of the economy. In addition, developing coun-
tries generally have low levels of private insurance pene-
tration, leaving the government as the de-facto insurer of
last resort for the entire country. For example, during the
period from 1980 to 2004, only about 1% of natural
disaster related losses in developing countries were insured,
compared to approximately 30% in developed countries.
The World Bank’s
disaster risk management work
The World Bank has two goals that guide its work –
ending extreme poverty and boosting shared prosperity
globally. Since natural disasters hurt the poor and
vulnerable most and can set back the development of a
country by years, addressing natural disaster risk is a
critical part of the World Bank’s work. In the area
of disaster risk management, the World Bank takes a
multi-layered approach, encompassing technical advisory
work, lending and risk transfer.
Technical advisory
The World Bank advises countries and subnational
entities in assessing their exposures to natural disaster
hazards. The goal is to strengthen the capacity of govern-
ments to take informed decisions based on robust analyt-
ical analysis. Incorporating science and new technologies
supports the understanding of these countries’ exposures
to dierent disasters, including the potential impact of
climate change. Promoting resilient infrastructure is
critical as well to ensure that key services like transport,
healthcare, drinking water, sanitation and electricity are
designed to withstand, to the greatest extent possible,
predictable natural shocks.
Lending
The World Bank provides loans to its member coun-
tries for programmes and projects related to disaster
risk management, such as the development of resilient
infrastructure and the creation of early warning systems.
In addition, the World Bank oers a type of loan to its
member countries that is designed to provide immediate
liquidity to countries following a natural disaster. This
loan, known as a development policy loan with a ca-
tastrophe deferred drawdown option (Cat DDO), serves
as early nancing while funds from other sources, such as
bilateral aid or reconstruction loans, are being mobilised.
To date, approximately US$ 3 billion of these Cat DDOs
have been signed with 13 countries.
157
Time to invest
Time to invest
Catastrophe bonds
In addition to borrowing in response to a natural disaster,
countries may wish to transfer a portion of their natural
disaster risk to the markets. The most common form of
risk transfer is conventional insurance. However, in-
creasingly, catastrophe bonds are emerging as an equally
important risk transfer tool.
Catastrophe bonds (or Cat bonds) allow entities that are
exposed to natural disaster risk (including governments)
to transfer a portion of that risk to the capital markets.
The entity purchasing the protection (the sponsor of
the bond) pays an insurance premium that is embedded
in the coupon paid to the bond investors. If a specied
event occurs during the term of the bond, the investors
lose some, or all, of their principal and those funds are
paid to the sponsor as its insurance payout. On the other
hand, if no event occurs, the investors receive 100% of
their investment back on maturity. In other words, with
a Cat bond, investors risk losing their principal if a spec-
ied natural disaster occurs but in exchange receive a
coupon that reects the insurance premium for such risk.
Since 2014, the World Bank has been issuing Cat bonds
on behalf of its member countries and other international
organisations. By issuing the bonds, the World Bank
signicantly simplies the access of its member coun-
tries to the risk bearing capacity of the capital markets.
The programme leverages the World Bank’s standing in
capital markets and its existing borrowings infrastructure
for the benet of members. In addition to their role in
transferring risk to markets, World Bank Cat bonds (like
all World Bank bonds) raise funds for the World Bank’s
general development lending.
World Bank catastrophe bonds – at the
intersection of insurance and capital markets
When the World Bank issues a Cat bond on behalf of a
member country, it stands between the country and the
markets. The World Bank enters into an insurance agree-
ment with the member country in which the World
Bank agrees to provide a payout to the country upon the
occurrence of a specied natural disaster. In exchange,
the country agrees to make periodic insurance premium
payments to the World Bank.
Simultaneously with the execution of that insurance
agreement, the World Bank issues a Cat bond to inves-
tors with terms that mirror those of the insurance agree-
ment. The Cat bond provides a hedge to the World Bank
for its obligations under the insurance agreement. If the
World Bank is required to make a payout to the coun-
try under the insurance agreement, it will be entitled to
deduct the same amount from the principal amount of
the bond. The World Bank uses the insurance premium
it receives from the country to pay a portion of the bond
coupon.
Most of the investors for World Bank Cat bonds (and for
Cat bonds generally) are specialised catastrophe risk funds.
These funds, which are primarily domiciled in the United
States, Bermuda, the United Kingdom or Switzerland,
invest entirely (or almost entirely) in insurance-linked
products such as Cat bonds. General asset managers,
reinsurance and insurance companies and some public and
private pension funds also invest directly in this market.
Since 2007, over US$ 4 billion of natural disaster risk has
been transferred by the World Bank for its member coun-
tries, in the form of both Cat bonds and conventional
insurance. These transactions have been for countries, large
and small, throughout the globe. Of the total amount,
roughly 65% has been executed in the Cat bond format.
Figure 1: Structure of a cat bond issued by the World Bank
Source: World Bank
Country
exposed to
natural risk
disaster
Insurance contracts Cat bonds
Capital market
World Bank
Investors
Investors
Investors

158
Time to invest
Time to invest
Source: World Bank
Countries Type of disaster
Hedge amount
in US$ million
Mexico
Earthquake & hurricane 1,225
Philippines
Earthquake & hurricane 595
Chile
Earthquake 500
Uruguay
Weather & commodity hybrid –
drought
450
International Development
Association (IDA) Countries
(75 poorest countries)
Pandemic 425
Colombia
Earthquake 400
Pacific Catastrophe Risk Assessment
and Financing Initiative (PCRFI)
(Small Pacific Islands)
Earthquake, hurricane & tsunami 232.5
Caribbean Catastrophe Risk
Insurance Facility (CCRIF)
(Caribbean Islands)
Earthquake & hurricane 203.5
Peru
Earthquake 200
Malawi
Weather – drought 19
Total 4,250
Table 1: Type of disasters and locations of World Bank Cat transactions
What’s next
The World Bank will continue to work with its member
countries to facilitate their understanding of the nancial
implications of natural disasters and climate change and
to help them to design appropriate risk transfer strate-
gies. The World Bank Cat bond product will continue to
play an important part in that work as a risk transfer tool.
The World Bank is also focused on expanding the list
of perils that it can help its member countries hedge. In
addition to the types of natural disasters that have already
been covered by Cat bond transactions, the World Bank
is investigating what other types of risks faced by its
member countries could similarly be insurable. Among
these new risks are famine, cyber and mass migration.

159
Time to invest
The Pacific Alliance is a regional initiative that
promotes the economic integration of Chile,
Colombia, Mexico and Peru to achieve mutual growth
and development. The countries are all situated along
the western part of the seismically active Pacific
Rim and are exposed to a common natural disaster:
earthquakes.
In 2016, the Pacific Alliance countries decided to
explore the use of catastrophe bonds to gain access
to quick liquidity to deal, in part, with the financial
losses linked to earthquakes. The decision to work
with the World Bank on the transaction allowed them
to meet major financial objectives such as expanding
financing options without increasing public debt.
The execution of a market-based transaction was
developed in tandem with technical assistance,
from the legal aspects linked to this modality of
capital market transactions to the analysis of the
individual risk profiles for each country.
The project resulted in the first World Bank Cat
bond sponsored by different countries, the largest
earthquake bond ever issued and, for the first time,
Cat bond investors buying natural disaster risk in
Colombia, Chile and Peru. More than 45 investors
around the world participated in this milestone
transaction. A record amount of almost US$ 2.5
billion were put in orders that gave the World Bank
the opportunity to increase the size of the coverage
and reduce the cost of it for the Pacific Alliance,
resulting in a win-win situation for the countries
and the market.
Transaction summary
Notional amount
US$ 1.36 billion
Classes
Chile: US$ 500 million
Colombia: US$ 400 million
Mexico Class A: US$ 160 million
Mexico Class B: US$ 100 million
Peru: US$ 200 million
Tenor
3 years for Chile, Colombia, and Peru
2 years for Mexico
Insurance premium
Chile: 2.50%
Colombia: 3.00%
Mexico Class A: 2.50%
Mexico Class B: 8.25%
Peru: 6.00%
The Pacific Alliance Cat bond

160
Time to invest
Time to invest
The Migration Fund:
Building on the Global Compact for
Safe, Orderly and Regular Migration
By Jonathan Prentice
Jonathan Prentice currently serves as the Head of
Secretariat for the United Nations Network on
Migration. He has twenty-four years of experience
working for the United Nations and International
Crisis Group in political analysis, human rights and
protection, and migration, including postings in
New York, Brussels, Jakarta, Geneva, Baghdad, Dili,
and Phnom Penh.
Migration in 2019 is at once polarising and unifying.
There was thus something a little paradoxical about the
Global Compact for Safe, Orderly and Regular Migra-
tion (GCM), adopted last December in Marrakech and
subsequently endorsed, in New York, by the General
Assembly. The creation of the Compact revealed at one
and the same time both the intensely politicised nature
of the discourse on migration yet also the clear recogni-
tion of the need to come together if its advantages are to
be maximised and downsides minimised.
The Compact itself is in some ways unremarkable. In
essence, it combines what is in eect a collection of
pre-existing practices in managing all dimensions of the
migratory arc into a non-binding framework, one which
places a premium on both national sovereignty, uphold-
ing of human rights, and the recognition that each state’s
migration experience and needs are unique.
As important as the content is, it is in its framework that
the true signicance of the Compact can be seen:
a collective recognition that migration impacts us all,
that it has many dimensions, causes, consequences and
implications, and that we have the capacity, if we come
together, to maximise migration’s many positives while
pushing back against the downsides – and human
tragedy – that unregulated movement can generate.
The Compact essentially says that we can do better:
by governments of origin, transit and destination, their
communities, and by migrants.
Joined-up response to migration
Rooted in international law, committed to the pursuit of
policies based on a solid evidence base, and grounded
in the 2030 Agenda for Sustainable Development, the
Compact is a framework recognising that the better
management of any one state’s migration policy is best
done through cooperation. Indeed, the emphasis on
cooperation – or partnerships – suuses the Compact,
both as a stand-alone objective (Objective 23) and as
core to its guiding principles. It represents a large tent,
providing room for engagement by the broadest range of
actors – governmental and non; state-level and sub-
national; public entities alongside social and private; and
never forgetting migrants themselves – in pursuit of
shared goals, underpinned by shared principles.
While voluntary and non-binding, the text is clearly
intended to have a tangible impact in addressing
migration for the benet of all concerned. Those who
have adopted it call for the Compact’s ‘eective
implementation’, based on ‘concerted eorts at global,
regional, national and local levels, including a coherent
United Nations system’. A system of ‘follow-up and
review’ is laid out, state-led and involving all stakehold-
ers, to review implementation of the Compact.
The reference to a ‘coherent United Nations system’
is signicant. In parallel to the negotiations which led
to the Compact, the Secretary-General established the
United Nations Network on Migration, bringing
together all parts of the UN to provide structured
support to Member States in their implementation of
the objectives they decided upon in Marrakech. This
network recognises the global signicance of migration
and that it has, nally, come fully onto the United
Nations agenda. The Network is, in short, the system’s
complementary commitment to the Member States, as
laid out in the Compact: that the better governance of
migration demands a response that is joined-up, eective,
transparent and sustained.

161
Time to invest
Time to invest
The Migration Multi-Partner Trust Fund
To further help ensure that the Compact does not gather
dust, and to foster the cooperation that is so core to this
joint project, the text calls for the establishment of
a capacity building mechanism (CBM). This is where
the Migration Multi-Partner Trust Fund (the Fund)
comes in.
The Fund is one leg of the CBM tripod, alongside a
‘global knowledge platform’ and a ‘connection hub’.
The overall purpose of the CBM is to support state
eorts to implement the Compact, drawing on the
eorts of states themselves and allowing for contribu-
tions from the United Nations system, and other stake-
holders, whether technical, nancial or human. All three
elements of the CBM are conceived of as a mutually
supporting whole. Take one away and an imbalance is
inevitable.
Drawing on best practice in the running of UN-pooled
funding, the Fund’s architecture is aimed at reinforcing
national ownership in the development and management
of eective migration policies. It strives to ensure UN
system coherence, inclusiveness in both design, imple-
mentation and oversight, and cost-eciency. Although
contributions to the Fund will ideally not be earmarked,
the creation of ve thematic areas under which the
GCM’s 23 objectives are clustered allow for a level of
targeted nancing, while ensuring that the Fund retains
a degree of agility and that all objectives of the Compact
can be covered without distortion.
The Fund will not – and does not seek to – subsume
existing initiatives, bilateral and multilateral funding
instruments. Rather, in conception and as part of an
integrated CBM, its aim is to encourage and support the
design of projects which can either be scaled up and/or
replicated as bodies of best practice and the partners best
placed to provide support are both drawn from and, in
turn, enhanced through the projects the Fund nances.
Generating innovation
Fostering synergies and bringing coherence to the
nancing architecture around migration is a dicult
task. ‘Migration’ is often not readily put into a discrete
category as a stand-alone subject. It is both a cause and a
consequence of a huge range of factors – developmental,
social, economic, political and so on – that cannot always
be easily disaggregated. Funding for migration-related
purposes display the same characteristics and, in many
ways, and rightly so. Reducing all issues to a narrow
optic – whether migration or otherwise – is unlikely to
always lead to sound policy choices.
However, extreme fragmentation of nancing ows
when it comes to migration, and the strong earmarking
of donor resources towards their own national priorities,
can inevitably lead to an imbalance in the distribution of
resources whether along geographic or thematic lines.
As noted by Sarah Rosengaertner in her article pub-
lished in the 2017 report of Financing the UN Develop-
ment System, the existing nancing landscape provides
few examples of governments pooling funds for migra-
tion purposes. By requesting the creation of a fund with-
in the CBM of the Global Compact, Members States
appear to be cognisant of the need for better balance.
Established by the UN Network on Migration on
8 May, the Fund’s initial target is US$ 25 million for the
rst year of operations. This will allow for the develop-
ment of at least one meaningful project under each of
the ve thematic areas outlined in the terms of reference.
This is a modest sum, given the momentousness of the
Compact and the signicance of the issues it addresses.
As such, it is important that the target is met – both as
a clear signal of intent, and as a platform on which to
build as experience in, and condence with, implement-
ing the Compact matures.
The Fund will be far from the only vehicle through
which the Compact’s implementation is supported.
But, if it works, it will be in the vanguard of generating
the most innovative of initiatives and approaches
– at local, national, regional and global levels – towards
bringing the Compact to life. And if it succeeds in that,
it will play a central role in realising the Compact’s
promise to impact for the better the lives of those
aected by migration.
162
Multilateralism on trial?
Multilateralism on trial?
PART TWO
Chapter Four
A resolute resolution for multilateralism
– a perspective from International Geneva
by Michael Møller
A brief reflection on multilateralism, the UN and financing
by Ulrika Modéer
Multilateralism: An instrument of choice
by Bruce Jenks
The crisis of multilateralism, viewed from the Global South
by Adriana Erthal Abdenur
Attracting the millennial investor to multilateralism
and investing in the Sustainable Development Goals
by Kanni Wignaraja
´

163
Multilateralism on trial?
Michael Møller served as Under-Secretary-General
and Director-General of the United Nations Oce
at Geneva between November 2013 and June 2019.
He has 40 years of experience as an international
civil servant in the UN System, serving in dierent
roles in New York, Iran, Mexico, Haiti and
Switzerland. Prior to his tenure as Director-General,
he was the Executive Director of the Ko Annan
Foundation from 2008 to 2011.
A resolute resolution for multilateralism
– a perspective from International Geneva
By Michael Møller
Earlier this year the global community marked the rst
International Day of Multilateralism and Diplomacy for
Peace, celebrated on 24 April. Some may question the
need for another International Day of this kind,
especially considering we already observe the Inter-
national Day of Peace (21 September) and United
Nations Day (24 October); two moments to reinforce
the ideals and principles of the organisation. For those
who ponder the relevance of a day devoted to multi-
lateralism and diplomacy, I would invite them to take
just a minute to ip or thumb through their favourite
newspaper or social media newsfeed.
Without doubt they would be exposed to a plethora of
global problems: armed conicts that threaten millions
of people, forced displacement at record levels, rampant
inequality both between and within countries, economic
protectionism, sky high debt, terrorism, and threats to
the rule of law, just to name a few. And this short list
(if you are a pessimist) excludes any mention of existential
challenges like climate change, mass extinction of species
and environmental degradation.
The next logical thought to surface should be the
realisation that the only sure way to tackle today’s and
tomorrow’s challenges is through joint action and a
reinvigorated approach to multilateralism and diplomacy.
However, as of late, it seems that many people in the
world of 2019 do not share this line of reasoning.
Consequently, an International Day focused squarely on
rearming the role and spirit of multilateralism could
not come at a more tting moment. A time when the
rules-based system that has guided the international
sphere for nearly three-quarters of a century is being
questioned in many corners of the globe.
As stated in the 2018 General Assembly Resolution
proclaiming 24 April the International Day of Multi-
lateralism and Diplomacy for Peace, the Day ‘constitutes
a means to promote the values of the [UN] and… to
advance the common goal of lasting and sustained peace
through diplomacy’.
1
The Resolution also notes that ‘the approach of multi-
lateralism… could reinforce the advancement of the
three pillars of the [UN], namely, sustainable develop-
ment, peace and security and human rights.
While I fully endorse the above statement, there is one
aspect that I must challenge—the use of could. There
is no question that the multilateral system has and must
continue to advance humankind.
Multilateralism: Crisis or transition?
Having served in the UN for four decades, including
nearly six years at the helm of UN Geneva, or the
United Nations Oce at Geneva, I have borne witness
to the positive and indivisible role of multilateralism
and diplomacy. The impacts of which have resulted in
tangible benets.
By virtually every measure of well-being, human life
is better today than at any other time in history. Living
standards, life expectancy, literacy rates and education
levels have never been higher across the world. Child
mortality, the risk of dying from disease or illness, from
war or famine, has never been lower. These advance-
ments and more happened over the course of just a few
decades. The unprecedented scale of human progress has
been broad, and it happened in what – viewed against
the timeline of human history – was nothing more than
the blink of an eye.

164
Multilateralism on trial?
Yet, against this backdrop, we do nd ourselves in a
period of social upheaval. A time in which a pointed
dissatisfaction over multilateralism is permeating the
foundations of global governance. Citizens are feeling
troubled, insecure and wary of the multilateral institu-
tions that have been put in place over the past decades.
I see this instability and period of discontent as an
opportunity to revive multilateralism by injecting it with
new levels of agility, inclusiveness and partnership.
Making the case for the Geneva model
Infusing these features into international multilateralism
and diplomacy is not an abstraction or mission
impossible. It is happening now, as you read these lines,
in Geneva, which this year is celebrating 100 years of
multilateralism.
During my time as Director-General of UN Geneva,
I concentrated on making the Palais des Nations an
example of multilateralism in action, both in terms of
operational excellence and long-term vision. Achieving
this was no easy task – and it remains a work in progress.
It entailed breaking down internal and external silos,
forging new and unconventional partnerships, increasing
public outreach and promoting openness.
The adoption of the 2030 Agenda for Sustainable Develop-
ment in 2015 provided the impetus to boost the way
‘International Geneva’, an inimitable ecosystem of actors,
worked together. Although the shores of Lake Geneva
have long been the venue of choice for international
diplomacy and mediation, the integrated and universal
nature of the 2030 Agenda and its 17 related Sustainable
Development Goals (SDGs) called for new forms of
collaboration and collective action.
To that end, I created two initiatives within my oce
that have grown to exemplify how International Geneva
lives and breathes a new form of multilateralism that the
city embodies: the Perception Change Project and the
SDG Lab. The former focuses on capturing and com-
municating the impact of International Geneva, with
the latter serving as a catalyst to facilitate dialogue and
partnership for SDG implementation. Together, these
initiatives highlight the value of providing a neutral space
– with a light UN touch – where states and non-state
actors can concentrate more on co-creating solutions
and less on divisive politics.
The impact of this approach has already produced results
that bode well for replicating the International Geneva
model, or elements of it, to other similar hubs and even
local communities all over the world.
One tangible example of the new brand of multilateralism
we are building here in Geneva is the creation of a
collaboration focused on sustainable nance that
leverages the city’s expertise in nancial services and
development. The premise is simple: by bringing two
diverse communities together and creating the condi-
tions for them to collaborate and innovate, we believe
we will increase the chances of developing and deploy-
ing new tools and platforms that drive more private
nance to the SDGs.
Despite being in a nascent stage, the collaboration has
already generated several initial nancing concepts. The
diculty in translating two communities’ languages,
drivers and incentives cannot be understated but there is
already a common understanding developing. In addition,
this coming together of two very dierent worlds to
work together represents a mind-set shift that values
risk-taking and abandoning the status quo. I believe
these are the foundations needed for renewed multi-
lateralism, now more than ever before.
Multilateralism rebooted
Viewed from the Geneva perspective, there is strong
demand for a more dynamic and inclusive model of
multilateralism, one where diverse stakeholders can
come together to negotiate and dialogue, not impose or
threaten. The International Geneva approach to
multilateralism also arms the importance of experi-
mentation and creativity. While ‘thinking outside of the
box’ may be an overused adage, it remains a valid notion
to bring forward reforms and include a much wider
spectrum of society in agenda-setting and decision-
making.
Next year’s seventy-fth anniversary of the UN provides
another opportune moment for Member States to restate
their commitment to the organisation and to multilateral
cooperation, all the while encouraging new models of
inclusive multilateralism and diplomacy. As exemplied
through our eorts in Geneva, actions such as pursuing
unconventional partnerships and brokering untested
collaborations can accelerate the discovery of novel
solutions and means of implementation. It also demon-
strates that multilateralism can be done dierently to
respond to the complex challenges that no single
country is able to tackle on its own.
Footnote
¹ United Nations General Assembly, ‘Resolution adopted
by the General Assembly on 12 December 2018,
International Day of Multilateralism and Diplomacy for
Peace, A/RES/73/127, 19 December 2018.
https://undocs.org/A/RES/73/127

165
Multilateralism on trial?
Ulrika Modéer is the Assistant Administrator and
Director of the Bureau of External Relations and
Advocacy, UN Development Programme (UNDP).
Previously, she was State Secretary to the Swedish
Minister for International Development Cooper-
ation and Climate. She combines a strong policy
background with parliamentary and civil society
experience and has had several assignments in Latin
America (Bolivia, Guatemala) and Africa
(Mozambique/Southern Africa). Ulrika Modéer
holds a Bachelor’s in International Relations from
the University of Gothenburg, Sweden, and was
recently awarded an honorary doctorate from the
Faculty of Social Sciences at the University of
Gothenburg.
A brief reflection on multilateralism,
the UN and financing
By Ulrika Modéer
The Sustainable Development Goals (SDGs) have always
been an ambitious set of targets for the world to achieve.
But, have no doubt, those goals can be achieved by 2030
as long as we all put our shoulders to the wheel.
Today’s global challenges – climate change, entrenched
poverty and inequality, and migration to name but a few
– are growing in both scale and complexity. The SDGs
address these challenges, but they can only be met and
overcome when all of us decide to act.
That is where multilateral institutions come into play.
By bringing the world together, organisations like the
United Nations oer our best chance to respond to
challenges and crises.
Unfortunately, the seven-decade old multilateral system
faces its own crisis: a waning of support as strong men
re-emerge in power across the world. The re-emergence
of nationalism and protectionism are challenging the
work of the UN. Consequently, the idea that Ocial
Development Assistance (ODA), which is meant to
promote the economic development and welfare of
developing countries as its main objective, should
primarily serve the national interest is gaining currency
in some countries.¹
In the words of Secretary-General António Guterres:
‘Trust is at a breaking point. Trust in national institutions.
Trust among states. Trust in the rules-based global order.
Within countries, people are losing faith in political
establishments, polarization is on the rise and populism is
on the march.’²
ODA funding to multilateral development organisations
reached an all-time high of US$ 63 billion in 2016.
But rising mistrust in multilateralism could lead to a
downturn in the near future.³
So is all lost? Are we witnessing the decline and death
of multilateralism? Fortunately, there is hope, but those
of us who believe so strongly in multilateralism at the
heart of the solutions to the world’s challenges have
work to do.
The value of adequate and quality funding
For the multilateral system to regain trust and bolster
the rule-based and value-driven system, it needs to
address its discontents and evolve to be t for purpose.
The world expects a multilateral system that is eective,
accountable and impactful in supporting countries to
deliver on the universal 2030 Agenda. In order to play
this role, the system needs adequate and quality – exible
and predictable – funding.
Empirical evidence shows that ODA channelled through
the multilateral system is found to be less politicised,
more demand-driven, more selective in terms of poverty
criteria and a better conduit for global public goods than
bilateral aid.⁴ Multilateral channels also allow for pooling
more resources and advancing a common global cause, as
seen in the growing prominence of global vertical funds
such as the Global Environment Facility (GEF), the
Global Alliance for Vaccines and Immunization (Gavi),
the Global Fund to Fight AIDS, Tuberculosis and Malaria
(Global Fund), etc.
In 2017, funding for UN operational activities for
development reached US$ 33.6 billion, 12.6% higher
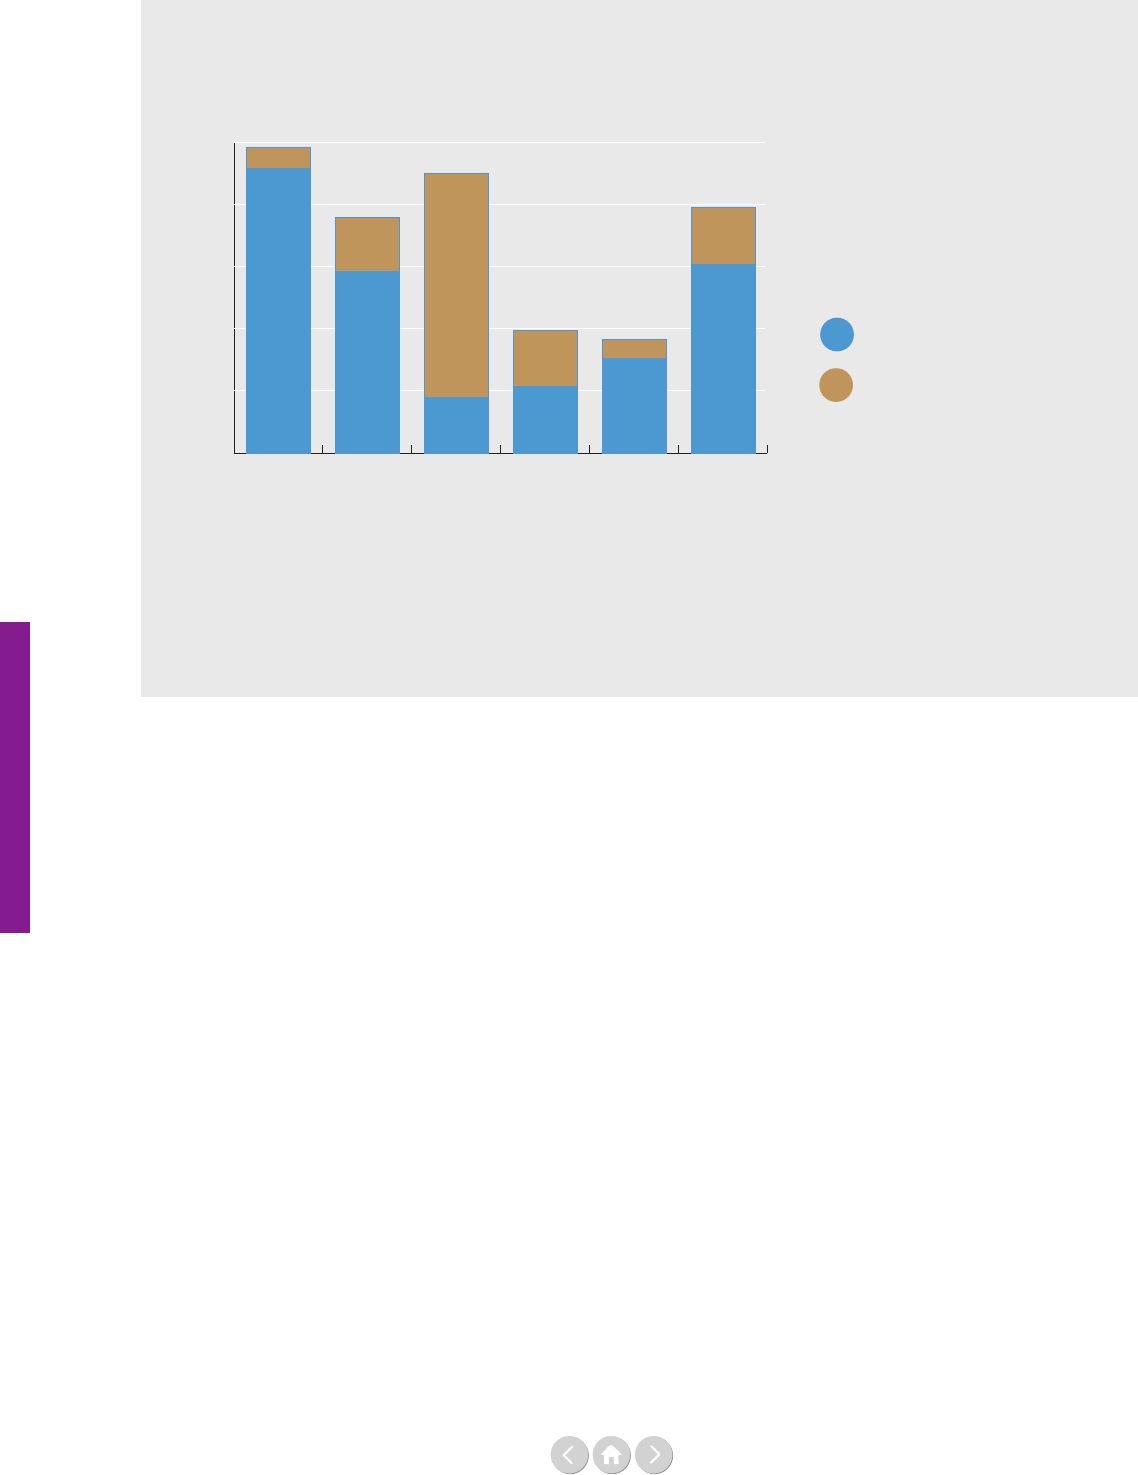
166
than 2016. This growth was primarily due to an increase
in non-core funding resulting in a continuation of a
trend that has prevailed for over two decades. Only
about one-fth of funding in 2017 was in the form of
core resources, the lowest core-share ever.⁵ Compared
to other multilateral institutions, the UN system by far
receives the majority of its funding tied to particular
projects (see Figure 1 above).⁶
This has put undue pressure on the UN system’s ability
to operate eectively, as fragmented and unpredictable
funding practice spurs unhealthy competition and
mandate drift. Because a few donors decide which
projects get funded where, the UN entities are becoming
less independent and strategic in their work, but
follow the money. If this trend continues unabated,
it will reduce the UN system to an outlet for imple-
menting bilateral aid programmes instead of being a
truly multilateral system, owned and trusted by the
entire membership of the UN.
Building trust and
demonstrating value and impact
One of the most important steps falls to the Member
States who make up the UN. These nations need to
show their support for and trust in the ability of the
UN development system to meet both the promises and
the responsibilities of achieving the SDGs.
Contributing to core funding, which is the funding
that is untied to any particular project or programme,
represents the highest level of trust in the development
system of the UN. Given the notable dependence on top
donors (50% of all voluntary core funding from
governments to the UN development system in 2017
came from the top ve contributors)⁷, broadening the
funding base and accessing additional sources of nanc-
ing remains a priority for most institutions.
On their part, the multilateral organisations – individually
and collectively – have a part to play in ensuring that
donors continue to put their trust in us. We must always
demonstrate that we are an eective, reliable and ecient
partner on the road to 2030.
Multilateral organisations are critical sources of funding
for developing countries, but they will need to support
partner countries’ access to an array of nancing sources
– public and private, domestic and international – and
channel these investments better, to deliver sustainable
social, economic and environmental impact.⁸
Figure 1: Funding to multilateral organisations
Source: Organisation for Economic Co-operation and Development (OECD), 2018
Note: The gure represents 2016 constant prices
3
6
9
12
15
Core
Earmarked
Other multilaterals
Regional
development banks
Other UN
UN funds and
programmes
World Bank Group
European Union
US$ billion
7%
93%
77%
54%
83%
77%
20%
23%
80%
46%
17%
23%
= Earmarked funding
as share of total funding
Multilateralism on trial?

167
Accordingly, the discussion has moved from funding to
nancing; in other words, how to increase capacities of
countries to access, utilise and align available resources to
the SDGs, including commercial and concessional
nance. And we must become even better at demonstrat-
ing the value and impact of their important investments
made through the multilateral system.
But to do that, we need the adequate, quality funding
that enables the UN development system to deliver the
results the world demands, and to deliver them on a large
scale. Earmarked funding will always be critical – but so,
too, is the core funding that lies at the heart of the UN
development system.
The recently completed Funding Compact⁹ between
Member States and the UN development system oers
yet another chance for a fundamental shift in the way the
system is funded.
10
It allows us to realign skewed incen-
tives, to realise the full potential of the organisation and
re-enter an era of renewed trust, and to be able to lead the
way to a peaceful, prosperous, and sustainable future.
Footnotes
¹ Nilima Gulrajani and Rachael Calleja,
‘The Principled Aid Index’, (policy briefing, ODI, 2019).
² UN Secretary-General, ‘Address to the General Assembly’,
(speech, United Nations, 25 September 2018).
https://www.un.org/sg/en/content/sg/speeches/2018-09-25/
address-73rd-general-assembly
³ OECD, ‘Multilateral Development Finance: Towards a New
Pact on Multilateralism to Achieve the 2030 Agenda Together’,
(report, OECD Publishing, 2018).
https://doi.org/10.1787/9789264308831-en
⁴ Nilima Gulrajani, ‘Bilateral versus multilateral aid
channels: Strategic choices for donors’,
(report, ODI, 2016).
https://www.odi.org/sites/odi.org.uk/files/resource-docu-
ments/10393.pdf
⁵ United Nations General Assembly, ‘Funding analysis of
Operational Activities for Development – Addendum 2’,
(United Nations General Assembly Economic and Social
Council, A/74/73-E/2019/4 Add. 2, 18 April 2019).
https://undocs.org/A/74/73/Add.2
⁶ OECD, ‘Multilateral Development Finance: Towards a New
Pact on Multilateralism to Achieve the 2030 Agenda Together’,
see Footnote 3.
⁷ United Nations General Assembly, ‘Funding analysis of
Operational Activities for Development – Addendum 2’,
see Footnote 5.
⁸ OECD, ‘Multilateral Development Finance: Towards a New
Pact on Multilateralism to Achieve the 2030 Agenda Together’,
see Footnote 3.
⁹ United Nations Secretary-General,
‘Funding Compact: Addendum’,
(Report of the Secretary-General, A/74/73/Add. 1-E/2019/4/
Add. 1, United Nations General Assembly Economic and
Social Council, 2019).
https://undocs.org/A/74/73/Add.1
Multilateralism on trial?

168
Multilateralism on trial?
Multilateralism:
An instrument of choice
By Bruce Jenks
Bruce Jenks is a Senior Advisor at the Dag
Hammarskjöld Foundation. He has been an adjunct
professor at the Columbia University School of
International and Public Aairs since 2010.
He is also a visiting Professor at the University of
Geneva’s International Organisation MBA
programme. Jenks has co-authored studies on
‘UN Development at a Crossroads‘, on ‘Rethink-
ing the UN for a Networked World’ and on the
future of multilateralism. He has been co-lead for
ve successive annual reports on the ‘Financing the
UN Development System’. Bruce Jenks served as
Assistant Secretary-General at UNDP, responsible
for UNDP’s relationship with its Executive Board,
as well as its donors. He has a PhD from Oxford
University. He has been a guest speaker at univer-
sities and conferences in over 50 countries and has
authored numerous articles and policy papers.
Bilateralism vs Multilateralism: these are usually thought
of as opposites. You are for one or the other. There is an
undertone that if it is serious you do it bilaterally. This is
fundamentally mistaken. Multilateralism is a hard option.
To be eective, multilateralism must be a choice that is
made because it is the most eective or ecient instru-
ment available to a government. Countries should work
multilaterally when it is the most eective way to meet a
challenge.
Multilateralism should not become a way of abdicating
leadership. It must be a way of exercising it. To be eec-
tive, multilateralism must be led. Multilateralism is not a
substitute for leadership. At the end of the Second World
War, the United States made a choice: it would serve US
interests better to use multilateral channels to inuence
outcomes than to act autonomously. Not always, but
often. When General Mattis resigned as United States
Secretary of Defense in 2018, he singled out partnerships
and alliances as critical characteristics of the post-war
multilateral order.
There are many issues worldwide where a country
might have a national interest but it is counter-
productive to intervene unilaterally or to put bodies on
the ground. Multilateralism gives you another instru-
ment, another option, through which to exercise
inuence. Typically, multilateralism oers a way of
pooling resources to achieve critical mass, of outsourcing
work where nobody wants to do it but someone must
and legitimacy where it is in short supply.
Post-war foundations
The post-Second World War foundations of multilateral-
ism form a tripod. Firstly, the foundations were con-
structed on shared values, norms and rules. These shared
values were deeply inuenced by the experience of the
inter-war period leading into the Second World War.
Secondly, a wide array of organisations with dierent
institutional forms was created, with a view precisely
to avoid the vacuum that followed the First World War.
Thirdly, these organisations, for the most part, were
staed by newly empowered international civil servants.
The provisions relating to the international civil service
in the Charter (especially articles 100-101) created
considerably more space for initiative than had been the
case in the League of Nations.
A new world order
and a reconfiguration of state power?
Some 75 years later, the world has undergone transfor-
mational changes which impact deeply on the challenges
facing multilateralism. There has been a major
reconguration of power among states, and there are
three principle scenarios for how the UN might adjust
to the changing realities.
The rst would be a gradual process of accommodation
to some of the demands of emerging powers. This could
lead to reforms, for example, in the membership

169
Multilateralism on trial?
prole of countries in the UN Security Council and the
International Monetary Fund (IMF). There is not much
evidence of a large appetite to take this path.
A second scenario is that countries become dissatised
with the pace of change and begin a process of establish-
ing alternative instruments. There is evidence of this
with the creation of the G20 on the one hand and the
establishment of new international development and
infrastructure banks on the other.
A third scenario would be that signicant segments of
the populations of status quo powers feel they have been
left behind and increasingly see the benets of globalisa-
tion accruing to an ever-smaller minority. In this scenario,
there is a populist rejection of the elitism of international
institutions and there is a retreat into dierent forms of
nationalism. This backlash against global elites is clearly
evident today, but it is very much contested whether this
is a temporary phenomenon or a fundamental change
which will have a long-lasting impact.
To dierent degrees, these scenarios were played out in
the United Nations General Assembly (UNGA) debate
in 2018.
France strongly rearmed its belief in universal values
and the compatibility of these values with the exercise of
sovereignty. China emphasised that it was committed to
upholding the international order and armed that this
required a strong UN and upholding the Charter. The
United States for its part rejected globalism and advocated
patriotism which it saw as contrary to globalism. The US
in practical terms was dening the exercise of sovereignty
as the practice of acting autonomously. The Secretary-
General observed the irony of a multilateralism under
attack when it had never been more in demand. Perhaps
most telling of all was that countries such as China,
India, Russia and Germany were not represented at the
level of head of government at all.
Multilateralism may or may not be in crisis, but it is
certainly in ux.
A new relationship
between public and private?
Another major transformation that has taken place lies
in the relationship between states and markets, fuelled
in large part by the extraordinary growth in the global
economy, which has altered the balance between public
and private, as well as between international and domestic.
First the reality of the power of markets requires rules
to be adjusted and revised. There are areas that require
careful attention. For example, Gillian Tett in a recent
article questions whether we need an IMF to regulate
the internet.¹ The Economist argues the international
bodies responsible for shipping, aviation and postal
services are in thrall to producer interests.²
A second area which lies at the heart of the evolving
relationship between public and private is the increasing
role of the public sector to nd ways of leveraging the
immense resources only available in the private sphere.
Thirdly, the inuence of markets has been paralleled by
the emergence of multiple stakeholders (multilateral,
bilateral, non-state, civil society etc) in dierent issue
areas. This calls for a much more inclusive approach, not
least in many of the governance structures that exist in
the inter-governmental sphere.
Global public goods
and the logic of collective response
The last decade has seen the emergence of a class of
development challenges that require a collective response
if there is to be any chance of a successful resolution.
Generating a collective response requires reaching agree-
ment on the allocation of responsibility for the
solution. This may not require an underlying agreement
on norms and values but it does require a practical
consensus on the allocation of responsibility. Over time
the sustainability of commitments undertaken will be
much more robust if they are grounded on accepted
norms and shared values. The option of a great power
absorbing the costs of providing for a global public good
seems to be receding into the past.
Agreements have two routes to implementation. One is
to take the form of a legally binding agreement and the
other is to institute a system of monitoring and verica-
tion that makes it possible to hold free riders to account.
It appears that the option of monitoring and verication
is becoming the preferred option for holding parties
accountable for the allocation of responsibility that has
been agreed upon. This is the path that has been chosen,
in particular, in climate negotiations and reected in
the Paris Statement. If this path is maintained as the
preferred option then monitoring and verication will
become the twin pillars on which normative frameworks
will be constructed over the near term. Data will
become a central player. According to Hariri, the owner-
ship of data will give rise to the most important political
questions of our era.³ The function of monitoring and
verication will become core characteristics of a multi-
lateral architecture.
Science and technology: the game changers?
The rapid pace of technological innovation has brought
to the fore many issues relating fundamentally to norms
as well as to the application of standards. There is a broad

170
Multilateralism on trial?
range of issues that have emerged over the last decade
which calls into question the need for new regulatory
frameworks. In their recent books, both Rees⁴ and
Hariri⁵ point to the extraordinary potential of the
combination of developments in biotechnology, infor-
mation technology and articial intelligence.
Multilateral arrangements are often associated with the
nancial arrangements that characterise them. Multi-
lateralism has historically been understood as providing
an instrument to allocate nancial resources in an
objective manner. In the future, it may well be that the
architecture surrounding scientic exploration and
progress will take on a much higher prole.⁶ Scientic
endeavour after all most likely adopted many of the
characteristics of a multilateral approach before multilat-
eralism made it into the Oxford Dictionary.
Anticipating the future
It is often argued that only a major cataclysm can
generate the appetite for constructing a new world
order. This is normally associated with the ending of
great wars. The causes of war are analysed, lessons are
drawn and a new architecture is laid out. Hence the
League of Nations followed the First World War and the
United Nations, the Second World War. The lessons
learned from these two cataclysms were very dierent
and these dierences were fully reected in the new
structures put in place.
What are we to make then of the situation we face
today… an extensive policy/academic debate which
questions whether today’s global architecture is t for
purpose set against a background of relative calm? There is
a real sense that the current architecture is out of date and
losing its relevance. But where will the necessary sense of
urgency come from? Without urgency, multilateralism
appears vulnerable. It is by anticipating the future that
the case for multilateralism can strongly be rearmed.
Can it be that, today, living in the era of Anthropocene
Man, characterised by the fact that humans will directly
impact their fate, multilateralism and the commitment to
nd collective responses go out of fashion?
It has been observed that never has the gap been so big
between the resources we have at our disposal, what we
can do with them, and what we are actually doing. We
live in a world, after all, in which 2,000 billionaires are
valued at US$ 9 trillion. Another way of putting it is
that today 1% of the world’s population owns half of the
world’s wealth.⁷ The abundance of resources owes much
to the impact of globalisation, but the mounting inequity
and the sense of too many left behind speaks to the need
for a much better managed globalisation process. Multi-
lateralism has much to contribute to this dilemma.
One of the very special characteristics of the challenges
we face over the coming decades is that the science and
the evidence point to the very limited time that is avail-
able to us before the challenges become insurmountable.
The point is reinforced by the speed at which tech-
nological innovation is moving. The fact that the time
available to take action is so constrained points again to
the need for multilateral action.
In short, it is not the case that multilateralism is in crisis.
Today’s challenges call for collective responses and high-
light the case for precautionary action. Giving priority
to a hypothetical, however likely to happen, invariably
meets strong political resistance. This is precisely the
kind of challenge that is much more likely to be pursued
successfully within a multilateral framework where the
political risks can be distributed. In this respect, mul-
tilateralism has never been so clearly an instrument of
choice.
Beyond this, what multilateralism is suering from is
an abundance of expectation in a world which requires
even more norms to be pursued but is constrained by an
increasing diversity of values. In 2013, the Oxford
Martin Commission for Future Generations urged
renewed dialogue on an updated set of shared global
values around which a unied and enduring pathway for
society could be built. At his press conference, the chair-
man of the Commission, Pascal Lamy, went out of his
way to stress that the recommendation of the Commis-
sion to establish a common platform of understanding
and to have a set of shared global values was the most
important contribution the Commission could make.
In this connection the adoption of Agenda 2030 and the
recognition that it makes a major contribution to
articulating a universal set of goals and values should
provide some optimism for the future.

171
Multilateralism on trial?
Footnotes
¹ Gillian Tett, ‘Do we need an IMF to regulate the internet?’,
(opinion article, Financial Times, 17 April 2019).
https://www.ft.com/content/4526982e-60a0-11e9-b285-
3acd5d43599e
² The Economist, ‘Some international regulators have been
captured by producer interests’,
(news article, The Economist, 24 November 2018).
https://www.economist.com/leaders/2018/11/24/some-inter-
national-regulators-have-been-captured-by-producer-interests
³ Yuval Noah Harari, 21 Lessons for the 21st century
(London: Jonathan Cape, 2018), p80.
⁴ Martin Rees, On the Future: Prospects for Humanity
(Princeton: Princeton University Press, 2018).
⁵ Yuval Noah Harari, 21 Lessons for the 21st century,
see Footnote 3.
⁶ Pedro Conceição, ‘Creating money out of thin air?
The role of science, technology and innovation in making the
SDGs affordable’, Opening Doors: Financing the UN Develop-ment
System, (report, UN MPTFO/Dag Hammarskjöld Foundation,
2018), p93-98.
⁷ Yuval Noah Harari, 21 Lessons for the 21st century, p75,
see Footnote 3.

172
Multilateralism on trial?
The crisis of multilateralism,
viewed from the Global South
By Adriana Erthal Abdenur
Adriana Erthal Abdenur is a Brazilian policy expert
and Coordinator of the International Peace &
Security Division at Igarapé Institute, a think tank
based in Rio de Janeiro, Brazil. She publishes
widely on South-South cooperation, global
governance, rising powers and international
security.
Adriana Erthal Abdenur holds a PhD from
Princeton University and a Bachelor’s from
Harvard University.
Multilateralism is under attack. A number of prominent
leaders from a wide variety of countries, from global
powers (the United States) to emerging powers (Brazil
and India), criticise major multilateral institutions such as
the United Nations and the Bretton Woods institutions.
Nationalist movements around the globe fuel mistrust
in international cooperation via inter-state platforms.
Their leaders argue that, not only is national sovereignty
incompatible with multilateralism, it is in fact directly
threatened by the latter. They seize upon areas of relative
or perceived inecacy to make umbrella statements
questioning the practices, motivations and principles
underpinning major multilateral organisations.
These contestations are juxtaposed onto, and end up re-
inforcing, longstanding frustrations among Global South
actors vis-à-vis the established multilateral institutions.
These frustrations include the perception that global
norms are, too often, set by global powers, and that
—recent restructuring eorts notwithstanding—deeper
reform of the system is hampered by geopolitics. As a
result, outdated and unjust power structures that date
back to the post-World War II period persist at the heart
of the global governance system.
The crisis of multilateralism already has concrete reper-
cussions, especially for the wide variety of states referred
to collectively as the Global South. Major agreement
regimes, including the Paris Agreement, have undergone
political reversals during implementation, while others,
such as the Global Compact for Migration, have suered
state withdrawals while still under negotiation. As global
and regional norms are disavowed, social protection
systems are weakened, with harsh consequences for the
poorest and most vulnerable, including children, migrants,
and indigenous populations. Global trade negotiations
have stalled, and a worldwide ‘noodle bowl’ of bilateral
trade agreements is emerging that often favours the rich.
Meanwhile, Northern assistance to the Least Developed
Countries is stagnant even as development, security and
climate crises persist. Failure to meet the goals of Agenda
2030 and to reach the targets of the Paris Agreement
hits some of the most vulnerable countries the hardest.
The attacks on human rights frameworks and institutions
imperil the wellbeing and often the lives of activists,
journalists, researchers, LGBTI groups and, indeed, the
general population.
New uncertainties around
regional and global governance
The attacks on international cooperation also aect the
Global South in multiple and complex ways through the
new uncertainties they create around regional and global
governance. Anti-multilateralism discourses erode the
legitimacy of the United Nations and create new pressures
for budgetary cuts within a context in which demands
—especially those related to conict prevention, extreme
poverty, inequality, sustainable development and climate
change—continue to grow. While the idea that the United
Nations must do ‘more with less’ predates this period,
arguments for eciency have become, more than ever,
based less on evidence than on ideology and self-interest.
In addition, withdrawal of support for established multi-
lateral institutions has contributed toward a lack of
leadership that remains unresolved. This trend is evident
not only at the United Nations but also in some regions,
notably Latin America and the Caribbean, whose vast
cemetery of regional institutions has recently expanded
with the dismantling of the Union of South American
States (UNASUR- Unión de Naciones Suramericanas).
Elsewhere, links between regional organisations, such as
the African Union and the United Nations—channels
seen as vital to a coherent and eective partnership—face
major coordination issues.

173
Multilateralism on trial?
Who sets the rules?
Finally, the (re)emerging discourses of national sovereignty
facilitate the proliferation of new platforms that, in the
long term, may undermine the centrality of the United
Nations to normative debates. The United Nations has
long competed with other institutions set up by the global
North, as in the cases of the Organisation for Economic
Co-operation and Development (OECD) and the North
Atlantic Treaty Organization (NATO). In many instances,
rich countries have opted to carry out normative and
operational initiatives in areas such as development and
security through these platforms rather than via the
United Nations. In the present era, alternative institutions
are being established by Global South states.
At rst glance, the growing fragmentation of global gov-
ernance seems to widen the range of options available to
states in the Global South. For an increasing number of
developing countries, the appearance of new platforms,
including multilateral development banks such as the Asian
Infrastructure Investment Bank (AIIB) and Brazil, Russia,
India, China and South Africa’s (BRICS) New Develop-
ment Bank (NDB), oers attractive alternatives to tradition-
al support, as in the case of South-South cooperation versus
aid from the global north. This supposed ‘age of choice’,
moreover, is not about resources alone: it is also about
normative alternatives, as well as who gets to set the rules.
The plethora of alternatives available is not always pos-
itive. There are frequent accounts of predatory prac-
tices and political interference by ‘new’ actors. Some
question to what extent the new platforms are in fact
dierent from the established ones. In addition, from a
systemic perspective, the normative ‘shopping around’
that increasingly takes place can weaken the centrality
of what remains the most democratic and institution-
alised channel for regime negotiations, and the one most
directly drawing on the idea of universal human rights:
the United Nations. In addition, by contributing towards
a fragmented system, the mushrooming of new institu-
tions may also have nefarious eects on democracy and
human rights, since some of the emerging platforms are
(far more than their established counterparts) heavily
premised on narrow economic and cooperation interests
rather than on a foundation of inclusiveness.
However, all is not lost. Multilateralism remains a foreign
policy cornerstone of most developing country foreign
policies, since it allows them to pool resources and inu-
ence. The vast majority of countries continue to actively
engage in negotiations and reform eorts at the United
Nations, which remains a powerful space for collective
action towards the world’s complex, transnational prob-
lems. For highly vulnerable and Least Developed Coun-
tries, tackling longstanding problems of poverty is simply
not feasible without engagement with the system. With
new disruptive forces on the horizon, from articial
intelligence to climate-related security risks, the need for
coherent multilateralism becomes even more urgent.
Vital role for the UN in the Global South
Even in Global South countries where the leadership
openly question or even disdain multilateralism, civil
society groups often continue to look to the United
Nations for exchanges and guidance, as in the case of the
SDGs, and to assure their own survival as political actors.
This is partly because of the inclusive and universal
character of such frameworks, but also due to their loca-
tion within the UN system, with its near 75 years of exis-
tence. Alternative platforms may be enticing and may help
to ll gaps in development nancing, but their governance
systems are incipient and often still largely illegible even
for those directly involved. Such is the case of the Belt and
Road Initiative, which may prove to be less a multilateral
eort than a China-centred, hub-and-spokes system.
At an operational level, too, much of the Global South
still relies on UN support and guidance. In some conict-
aected contexts, the deployment of peace operations
and special political missions has helped to prevent
recurrence of major conict and possibly of genocide,
as in South Sudan. Even in developing countries that are
not aected by war, the presence of the UN develop-
ment system has been vital in building up capacity, of-
fering alternative policy routes and promoting exchanges
and coordination with other actors. In much of Latin
America, for instance, key stakeholders view the UN as a
high-level policy dialogue partner. More broadly, there
is strong appetite across the Global South for a greater
role to be played by UN peacebuilding, especially in
contexts in which the UN Security Council is viewed as
ineective due to geopolitical disputes, the breadth of its
agenda, or the changing nature of conict.
To boost the engagement of the Global South in the
defence of multilateralism, three steps are needed. First,
established institutions such as the United Nations
need not only to become more eective, but to bet-
ter communicate this eectiveness, using evidence and
story-telling to reach people, to make goals less abstract,
and to counter narratives that distort the dynamics and
impact of the organisation. Second, these institutions
must double-down on their defence of human rights
rather than shy away from it, showing more clearly the
broad range of human, economic and social benets of
promoting a rights-based approach to the development
and security challenges. And nally, the United Na-
tions and its partner organisations need to engage more
actively with emerging platforms of the Global South.
These new fora are unlikely to go away but could, with
some eort, be better welcomed into global eorts to
address global problems.

174
Multilateralism on trial?
Attracting the millennial investor to
multilateralism and investing in the
Sustainable Development Goals
By Kanni Wignaraja
Kanni Wignaraja is the Assistant Administrator and
Director ad interim at the Bureau for Management
Services at UNDP. Prior to this, she served as the
Senior Advisor to the UNDP Administrator
focusing on development policy and reform, and
leadership development, and before that as the
Director of the Oce for UN Development
Coordination. Kanni Wignaraja has signicant
experience in leading UNDP’s global, regional and
country programme portfolios. Prior to joining the
UN, she worked with the Ford Foundation in New
York, and with the International Centre for Ethnic
Studies in Sri Lanka. She has contributed to
numerous papers, articles and conferences in areas
of public policy, institutional reform, capacity
development, human rights and leadership.
Who is the millennial investor, and why focus on this
cohort to drive Sustainable Development Goal (SDG)
nancing? Born in the late 1980s through mid-1990s, this
age cohort constitutes a large proportion of the
economically active population in many countries,
including in emerging economies. To cite a few examples,
in Nigeria and Ethiopia the median age is 18, Egypt 24,
South Africa and Saudi Arabia 27, India 28, Indonesia
and Colombia 30, Bahrain 32, Armenia 35, China 37,
USA and Australia 38, UK 40, France and Sweden 41.¹
This group of inuencers will have an impact on the
economies, societies and environments they live in.
In turn, how can the UN with the SDG agenda in-hand,
inuence their choices as job seekers, consumers,
producers and investors?
There is more to the engagement of the millennial gen-
eration than what they care to invest in, but this article
focuses on this aspect of their inuence and potential
impact. Much of the survey data available on the invest-
ment interests of this cohort comes from North America
and Europe, so while one would not wish to extrapolate
across geography, it is useful to draw out a few points
from this data to make three broad generalisations:
• A high priority for this young group is paying o
debts (if accumulated by self or by family), retire-
ment savings are often not aordable or not on
their radar yet, and they expect to live longer as life
expectancy in most countries continues to rise;
• The trailing cohort of the millennials, ie those still
in their 20s, are generally seeing stagnant wages,
shorter-term jobs, volatility of nancial markets and
the onset of the impacts of long drawn out conicts
and climate change, which has direct or indirect
spill-over eects into their own lives, no matter
where they live and work;
• It is not a stretch to say that for the millennial who
can aord to invest, socially responsible investment
matters more than it did to the generations before.
Impactful investments
Maybe the millennials are more socially conscious, more
curious and want to eect change. Or maybe they have
better access to data and information on what’s going
on both at home and overseas, in terms of good and bad
practices on corporate governance, human rights, climate
change, advent of new technology and so on. Maybe it
is both.
Morgan Stanley conducted a survey among millennial
investors in the US in 2018 that showed that 86% of
them are very or somewhat interested in sustainable
investing. It also revealed that they are twice as likely
than the broader investor group to invest in companies
targeting social and environmental goals, and 90% want
this to be in their 401(k) plans², putting large private
banks and companies on notice.
Across parts of the North America, Japan and Europe, we
are also seeing pressure groups calling on pension funds,
sovereign wealth funds and asset managers to shift invest-
ment portfolios to avoid investing in what they consider
‘bad’ social choices. These include alcohol, tobacco,
rearms, fossil fuels and in companies that violate human

175
Multilateralism on trial?
rights and labour standards.³ The Government Pension
Fund of Norway was an early responder, which is
signicant considering it is the world’s largest sovereign
wealth fund⁴ (it constitutes over US$ 1 trillion in assets,
including 1.3% of global stocks and shares).⁵
While the environmental, social and corporate gover-
nance (ESG) marker may still be seen as a boutique
measure and is still to make signicant inroads into the
larger world of public and private sector investment,
from 2012 to 2018 there has been a fourfold increase
in mutual funds incorporating and reporting on ESG
standards. These positive trends will continue according
to the Global Impact Investing Rating System (GIIRS),
which tracks companies’ social and environmental
performance. They expect the eld of impact investing,
where there is greater intentionality of value-driven
purpose (which is a sub set of socially responsible invest-
ments), to grow at least tenfold by 2020, drawing more
than US$ 400 billion in investments to ve sectors alone
(housing, water, health, education and nancial services).
J.P. Morgan estimates a potential for at least US$ 183
billion in prots. This is all good, but not enough. The
SDGs require trillions of dollars in investments⁶ to put
many of the goals within reach by 2030.
The role of UNDP
For the UN, for United Nations Development
Programme (UNDP) and for the 2030 Agenda with its
measurable Sustainable Development Goals, these trends
provide new impetus to bring the eld of socially
responsible investing, with its o-shoot of impact invest-
ing, to a whole new level of inuence to transform
how and where public and private nancing ows.
B-Labs, Rockefeller Foundation, Deloitte, IFC,
Morningstar⁷ and many others are cracking the measure-
ment vault, so ‘investing in good’ can be measured as
soundly as nancial prot and loss. UNDP is working
with these partners to develop an SDG Impact Seal to
move this eort beyond ESG and from advocacy to
action on the SDGs, aligning private value with public
interest and to actioning SDG-aligned investing.
What does all this mean for the UN development system
and for UNDP? What does it mean for our work across
the SDGs that focuses on those horizontal issues that
accelerate progress across multiple goals – addressing
social justice; mitigating climate impact; zeroing-in on
inequalities of income, wealth and opportunity; tackling
joblessness and hopelessness among young people;
introducing new clean technologies and other trans-
formational innovations? Meeting the challenge of
attracting nancing to these issues and measuring the
value they bring in terms of change and positive impact
will be key.
On the issue of attracting new nancing, millennials
are a core part of this eort, both in convincing their
government leaders and corporate managers to make
the pivots into dierent production pathways, as well as
changing consumer behaviour and encouraging new
SDG investments. They are voices and inuencers of
change based on where they put their money as well as
where they see value-based returns, investing in technol-
ogy is highest on the list of priorities, followed by health
and energy.
UNDP’s quest is to broaden these interests and to help
millenials act on on their curiosity. Using available data
and perception surveys, we do so by further educating
the young on what those development investments are
that progress from single nancial bottom-line returns,
embedding ‘do no harm’ principles, and moving further
along to proactively impact positive change without
compromising economic performance. New ideas, a
resurgence of values-driven civic consciousness, new
tech and innovations and greater access to learning and
knowledge is making ‘green, clean and protable’
possible. It is interesting to note that the website oer-
ings of the major corporate players now include a value-
driven set of investments and services, acknowledging a
potentially fast-growing, powerful young stakeholder in
the game.
In terms of nancial instruments, the mix of old and
new, works well. Market indexed mutual funds and large
sovereign wealth funds are calling for new SDG-aligned
measures to relay impact; emerging innovative nance
products are working together with development grant
assistance to provide ‘rst loss’ guarantees and helping to
manage and mitigate risks – these eorts show the way
and must be done at scale.
For the UN and UNDP, it requires the greater use of
pooled funds in this domain to jointly carry the initial
contribution to open new spaces and new ways of doing
business. Support to the changes in analytics, policy and
institutional reforms is needed, investing in education
and new capabilities, designing programmes that cut
through gender dierentials to bring more access, equity
and skills to those left behind, and screening for good
corporate governance in terms of transparency, account-
ability and reporting standards to this investment space
– UNDP with the UN development system, is able to
bring all this to bear through its policy and programme
portfolios.
Moving the needle on SDG investments
The dramatic consequences of conict, inequality and
climate change are already obvious to this generation of
young people. And for the majority, the fall-out directly
impacts their immediate futures. Whether driven by

176
Multilateralism on trial?
shared values, excitement over ‘moon shots’ or by shared
anxieties at what the future holds – they care. The overall
inter-generational transfer of wealth to the millennials
will be of a magnitude never seen before⁸ and upon
receipt, they will guide these future investment decisions.
This millennial generation – as leaders, consumers,
self-starters and investors – can dramatically move the
needle on inuencing SDG investments, locally and
globally. The UN and UNDP must use its knowledge,
innovation spaces, global capabilities and resources to
fully engage them in transitioning from considering
nancing of the SDGs as fringe philanthropy to being
mainstream better-business for all.
Footnotes
¹ UN Department of Economic and Social Affairs,
Population Division, ‘World Population Prospects’,
(webpage, United Nations, 2019).
https://population.un.org/wpp/Publications/ and
https://en.wikipedia.org/wiki/List_of_countries_by_medi-
an_age
² The 401(k) plan refers to a tax-deferred, defined contribution
retirement savings account provided (and sometimes propor-
tionately matched) by an employer in the US.
³ Benjamin J. Richardson, Socially Responsible Investment Law:
Regulating the Unseen Polluters
(Oxford: Oxford University Press, 2008).
⁴ The Economist, ‘Norway’s sovereign-wealth fund passes the
$1trn mark’, (article, The Economist, 21 September 2017).
https://www.economist.com/finance-and-econom-
ics/2017/09/23/norways-sovereign-wealth-fund-passes-the-
1trn-mark
⁵ Ministry of Finance, ‘Ethical Guidelines for the Government
Pension Fund — Global’,
(guidelines, Government of Norway, 2007).
⁶ UNCTAD, ‘World Investment Report 2014, Investing in the
SDGs: An Action Plan’, (report, UNCTAD, 2014).
https://unctad.org/en/PublicationsLibrary/wir2014_en.pdf
⁷ The Morningstar Sustainability Rating was introduced in
2016, and currently appraises approximately 20,000 mutual
funds and exchange traded funds on how they do on ESG
criteria, reflecting the growing interest and importance
attached to sustainable investing.
⁸ ‘While the ‘Great Transfer’ from the Greatest Generation to
the Baby Boomers is still taking place, a second and even larger
wealth transfer from the Boomers to their heirs is starting now
and will continue over the next 30 to 40 years.’ ‘The “Greater”
Wealth Transfer, Capitalizing on the Intergenerational Shift in
Wealth’, (report, Accenture, 2015), p2.
https://www.accenture.com/t20160505t020205z__w__/us-
en/_acnmedia/pdf-16/accenture-cm-awams-wealth-transfer-
final-june2012-web-version.pdf

177
Conclusion
Time is short. Not only is 2030 approaching, but there
is little time to take the necessary actions to prevent
irreversible setback and development losses. Climate
action, armed conict, disease prevention, migration,
inequality – all need urgent action and multilateral
approaches to be at the centre of global action. To make
the case for a multilateral approach, countries, leaders,
investors and citizens will need evidence of where and
in which areas this approach is the most eective option
to achieve the goals we aspire to globally, nationally and
locally. This is the rst hard choice, out of which the
nancing choices ow.
This report has attempted to provide the necessary
evidence, showcasing the funding of the UN development
system and its role within the nancing dynamics of the
2030 Agenda. A number of headline messages and
questions have emerged from this work.
What kind of multilateralism supports nancing and
funding of sustainable development and is there a
sucient sense of urgency and evidence for meaningful
investment? How do global norms get funded and
support these larger investment and nancing choices?
Does the big picture of nancial ows to development
countries – apparently increasing – point to any net
impact?
How can some of the most impactful drivers of change
– technology, science and innovation – help to reduce
inequality, ‘leave no one behind’ and leapfrog transforma-
tion? And what are the nancing approaches most likely
to accelerate these drivers? How can impact be credibly
measured to underpin hard investment choices and track
outcomes and return for future investment? What are
today’s (and tomorrow’s) models of ‘good multilateral
donorship’? And where are the pathways to ensure the
model becomes a rm structure?
In order to support countries in their achievement of the
SDGs, the required repositioning of the UNDS was
advanced by recent milestones. These include the
Secretary-General’s 2018 reform agenda adopted by
Member States, the major global nancing events for
sustainable development held in 2018 and 2019, and the
Funding Compact with Member States. These steps, if
well reinforced can serve as nancing cornerstones for the
UN’s contribution to a stronger multilateral order. The
hard choices ahead rest on further strengthening this
multilateral foundation, where strength is needed
especially in times of uncertainty.

178
AAAA Addis Ababa Action Agenda
AFD Agence Française de Développement
AfDB African Development Bank
AIIB Asian Infrastructure Investment Bank
AU African Union
BRICS Brazil, Russia, India, China and South Africa
B2T ‘Billions to Trillions’
CBM Capacity-building mechanism
CEB Chief Executives Board for Coordination
CEO Chief Executive Ocer
CERF Central Emergency Response Fund
CTBTO Comprehensive Nuclear-Test-Ban Treaty Organization
DAC Development Assistance Committee
DCO Development Coordination Oce
DPA Department for Political Aairs
DPKO Department for Peacekeeping Operations
ECOSOC Economic and Social Council
ERP Enterprise Resource Planning
ESG Environmental, social and governance
FAO Food and Agriculture Organization of the United Nations
FCV Fragility, conict and violence
FDI Foreign direct investment
FfD Financing for Development
FMOG Fiduciary Management Oversight Group
FSDO Financing for Sustainable Development Oce
FSDR Financing for Sustainable Development Report
Gavi Global Alliance for Vaccines and Immunization
GCM Global Compact for Safe, Orderly and Regular Migration
GDP Gross Domestic Product
GEF Global Environment Facility
GISD Global Investors for Sustainable Development
GNI Gross National Income
GPG Global public good
GPW General Programme of Work
GYPI Gender and Youth Promotion Initiative
IAEA International Atomic Energy Agency
IATF Inter-Agency Task Force
IATI International Aid Transparency Initiative
ICAO International Civil Aviation Organization
ICC International Criminal Court
IDA International Development Association of the World Bank
IFAD International Fund for Agricultural Development
IFC International Finance Corporation
IFI International Financial Institutions
IFRC International Federation of Red Cross and Red Crescent Societies
ILO International Labor Organization
IMF International Monetary Fund
IMO International Maritime Organization
INFF Integrated National Financing Frameworks
INGO International non-governmental organisation
IOM International Organization for Migration
ITC International Trade Center
ITU International Telecommunication Union
Acronyms & Abbreviations

179
LDC Least Developed Countries
MDB Multilateral Development Bank
MDG Millennium Development Goal
MIGA Multilateral Investment Guarantee Agency
MSME Micro-, small- and medium-enterprise
NDB New Development Bank
NGO Non-Governmental Organisation
OAD Operational activities for development
OCHA Oce for the Coordination of Humanitarian Aairs
ODA Ocial Development Assistance
OECD Organisation for Economic Co-operation and Development
OECD-DAC Organisation for Economic Co-operation and Development’s Development Assistance Committee
OHCHR Oce of the United Nations High Commissioner for Human Rights
PAHO Pan American Health Organization
PBF Peacebuilding Fund
PBSO Peacebuilding Support Oce
PEPFAR President's Emergency Plan for AIDS Relief
PF Pooled Funds
PSW Private Sector Window
QCPR Quadrennial Comprehensive Policy Review
RC Resident Coordinator
RSW Sub-Window for Refugees and Host Communities
R&D Research and Development
SDG Sustainable Development Goal
SDSN Sustainable Development Solutions Network
SIDS Small Island Developing States
SPTF Special Purpose Trust Fund
TOSSD Total Ocial Support for Sustainable Development
TRP Technical Review Panel
UNAIDS Joint United Nations Programme on HIV/AIDS
UNASUR Union of South American States
UNCDF United Nations Capital Development Fund
UNCT United Nations Country Teams
UNCTAD United Nations Conference on Trade and Development
UNDAF United Nations Development Assistance Framework
UNDESA United Nations Department of Economic and Social Aairs
UNDCO UN Development Coordination Oce (UNDCO)
UN DOCO United Nations Development Operations Coordination Oce
UNDG United Nations Development Group
UNDP United Nations Development Programme
UNDS United Nations development system
UNEP United Nations Environmental Programme
UNESCO United Nations Educational, Scientic and Cultural Organization
UNFCCC United Nation Framework Convention on Climate Change
UNFPA United Nations Population Fund
UNGA United Nations General Assembly
UN-HABITAT United Nations Human Settlements Programme
UNHCR United Nations High Commissioner for Refugees
UNICEF UNIDO United Nations Industrial Development Organization
UNITAR United Nations Institute for Training and Research
UN-OAD United Nations’ Operational Activities for Development
UNOCHA United Nations Oce for the Coordination of Humanitarian Aairs
UNODC United Nations Oce for Drugs and Crime
UNOPS United Nations Oce for Project Services
UNRISD United Nations Research Institute for Social Development
UNRWA United Nations Relief and Works Agency for Palestine Refugees in the Near East
UNSDG United Nations Sustainable Development Group
UNSSC United Nations System Sta College
UNU United Nations University
UN Women United Nations Entity for Gender Equality and the Empowerment of Women
UNWTO United Nations World Tourism Organization
UPU Universal Postal Union of the United Nations
WB World Bank
WBG World Bank Group
WFP World Food Programme
WHO World Health Organization
WIPO World Intellectual Property Organization
WMO World Meteorological Organization
WTO World Trade Organization
Acronyms & Abbreviations

180
Endnotes for Part One
¹ United Nations Secretary-General, ‘Repositioning the United
Nations development system to deliver on the 2030 Agenda:
ensuring a Better Future for All’, (Report of the Secretary-General,
A/72/124–E/2018/3, United Nations General Assembly Economic
and Social Council, 11 July 2017).
https://undocs.org/A/72/124
and
United Nations General Assembly, ‘Resolution adopted by the
General Assembly on 31 May 2018, Repositioning of the United
Nations development system in the context of the quadrennial
comprehensive policy review of operational activities for develop-
ment of the United Nations system’, (resolution, A/RES/72/279,
UNGA, 1 June 2018). https://undocs.org/A/RES/72/279
² This figure was created based on CEB data for total UN revenue
and the United Nations Department of Economic and Social
Affairs (UNDESA) data for revenue for UN-OAD. Though
combining these two data sets has limitations, they both are
consistent in the way they define the UN financing instruments.
The term UN-OAD refers to those UN activities that are classified
as development and humanitarian and funded by contributions that
are ODA-like, that are carried out by UN entities classified by
UNDESA as being part of the UN development system. The overall
UN revenue data is as given by the CEB and similar data for
UN operational activities for development come from UNDESA.
This enables a combined analysis to understand how the UN-OAD
and the UN non-OAD segments of the UN revenue are evolving,
and within them the levels of core and earmarked funding.
³ ‘Multilateral Development Finance: Towards a New Pact on
Multilateralism to Achieve the 2030 Agenda Together’,
(report, OECD, 2018).
⁴ United Nations Children’s Fund (UNICEF), ‘UNICEF National
Committees’, (website, UNICEF)
www.unicef.org/unicef-national-committees
⁵ General Assembly Resolution, A/RES/72/279, UNGA,
1 June 2018. See Endnote 1.
⁶ ‘Operational Guidance for Implementing the Coordination
Levy’, (guidelines, attachment to letter of the Deputy Secretary
General to Member States dated 14 March 2019).
Contribution agreements that meet the above conditions will be
subject to the levy unless one of the following conditions is true.
• The contribution is from a global vertical fund.
• The contribution is from a United Nations entity.
• The contribution is for an entire entity country programme,
without earmarking within the country programme.
• The contribution is to a trust fund (ie in the case of project/
programme funded by multiple donors where funds are
co-mingled and no separate donor-by-donor report is
provided).
• The contribution is to United Nations inter-agency pooled
funds, including joint programmes, or to agency specic
thematic funds.
• The contribution is ‘In-kind’.
• The contribution is from a programme country, whether to
their own programme or the programme of another country
(ie south-south cooperation related contributions).
• The overall contribution agreement is for less than
US$ 100,000.
• The purpose of the contribution is to fund activities that the
United Nations entity has classied as Humanitarian
Assistance (mapped to DAC code 720, 730, 740 and 930);
Peace Operations (mapped to DAC Code 15230); to counter
illicit narcotics and crime; or Global Agenda and Specialized
Assistance.
⁷ UN Economic and Social Council, ‘Progress in the implemen-
tation of General Assembly resolution 71/243 on the quadrennial
comprehensive policy review of operational activities for develop-
ment of the United Nations system’, (resolution, E/RES/2019/15,
ECOSOC, 12 July 2019). https://undocs.org/E/RES/2019/15
⁸ World Bank grouping.
9
In this we are inspired by the late Hans Rosling’s concept of
‘factfulness’ dened as ‘the stress-reducing habit of only carrying
opinions for which you have strong supporting facts’.
Hans Rosling, Anna Rosling and Ola Rosling, Factfulness,
(New York: Flatiron Books, 2018).
10
The CEB data is reported to the General Assembly and
available on the CEB website. The 2017 data were included in
United Nations Secretary-General, ‘Budgetary and nancial
situation of the organizations of the United Nations system’,
(Note by the Secretary-General, A/73/460, United Nations
General Assembly, 29 October 2018).
https://www.unsceb.org/CEBPublicFiles/A_73_460%20Budget-
ary%20and%20nancial%20situ%20of%20orgs%20of%20UN%20
system.pdf

181
Endnotes
11
The UNDESA data is reported to the Operational Activities
Segment of ECOSOC and available on the ECOSOC website.
The 2017 data is contained in the ‘statistical annex with 2017
funding data’ that accompanies United Nations Secretary-General,
‘Implementation of General Assembly resolution 71/243 on the
quadrennial comprehensive policy review of operational activities
for development of the United Nations system, 2019’, (Report of
the Secretary-General, A/74/73-E/2019/4, United Nations
General Assembly Economic and Social Council, 18 April 2019).
12
The six are: the Comprehensive Nuclear-Test-Ban Treaty
Organization (CTBTO), the International Criminal Court (ICC),
the United Nations Capital Development Fund (UNCDF), the
United Nations Framework Convention on Climate Change
(UNFCCC), the United Nations Research Institute For Social
Development (UNRISD) and the United Nations System Sta
College (UNSSC). The total sum of the revenue for these six
entities in 2017 was US$ 457 million; of these ICC and
CTBTO were the largest in funding terms (US$ 170 and 128
million, respectively).
13
The funding analysis conducted by United Nations Department
of Economic and Social Affairs (UNDESA) is part of their report-
ing on the Quadrennial Comprehensive Policy Review (QCPR).
The scope of the QCPR is the UNDS, or entities that carry-out
operational activities. As such, not all UN entities are included in
UNDESA’s dataset on funding.
14
United Nations General Assembly, ‘Resolution adopted by the
General Assembly Resolution on 21 December 2016,
Quadrennial comprehensive policy review of operational activities
for development of the United Nations system, A/RES/71/243,
21 December 2016.
https://undocs.org/A/RES/71/243
15
For more information, please visit the dedicated website at
http://www.oecd.org/dac/nancing-sustainable-development/
development-nance-standards/tossd-task-force.htm

182
Notes to figures and tables
in Part One
General Notes
i) In Figures 1, 2, 3, 29–32, 34, 35 and in Tables 2, 3, 4, 6, the term
‘Chief Executives Board for Coordination (CEB)’ indicates data
from the CEB Financial Statistics Database,
https://www.unsceb.org/content/un-system-financial-statistics.
Data was downloaded in February 2019.
ii) In Figures 3-7, 11, 25–26, 28a and 28b, and 36–38,
‘Report of the Secretary-General (A/74/73 - E/2019/4)’ is used
as a shorter reference to the United Nations Secretary-General
Report ‘Implementation of General Assembly resolution 71/243 on
the quadrennial comprehensive policy review of operational
activities for development of the United Nations system, 2019’,
statistical annex on 2017 funding data (A/74/73 - E/2019/4,
United Nations General Assembly Economic and Social Council,
15 April 2019, available online from
https://www.un.org/ecosoc/en/node/17356550)
Data was downloaded in April 2019.
iii) In Figures 9, 10, 18-24 and in Table 5, the term ‘Organisation
for Economic Co-operation and Development (OECD)’ is used
as a shorter reference for OECD statistics database,
https://stats.oecd.org. ‘Theme: Development: Flows based on
individual projects: Creditor Reporting System (CRS)’.
Data from this source was downloaded in March 2019.
iv) In Figures 25–26 and 28a and 28b, and 34–35, the term
‘UN Pooled Funds Database’ refers to the UN Pooled Funds
Database published to the International Aid Transparency Initiative
(IATI), which is available at the IATI’s website: www.iatistandard.org.
It uses the publisher name UN Pooled Funds (XI-IATI-UNPF).
For figures 25, 26, 28a and 28b, the term UN Pooled Funds
Database also is meant to include the 2017 overview of single-
agency thematic funds prepared jointly by
United Nations
Development Operations Coordination Oce (
UNDOCO) and the
MPTFO.
v) In Figures 4, 10, 25–26, 29–30 core consists of assessed contribu-
tions and voluntary core contributions.
Figures
Figure 1
i) Data from the United Nations System Chief Executives Board
for Coordination (CEB) Financial Statistics Database, series
‘Total Revenue by Revenue Type’ (FS-K00-01), 2017
(https://www.unsceb.org/content/FS-K00-01).
ii) CEB figures reflect revenue and expenses as reported to the
CEB by United Nations organisations, based on their audited
financial statements. They have not been adjusted for revenue
and/or expenses associated with transfers of funding between UN
organisations.
iii) Total earmarked contributions presented in Figures 1 and 2 were
obtained by adding ‘Voluntary contributions pending earmarking’
and ‘Voluntary Contributions - Specified’.
Figure 2
i) Nominal values
ii) Based on the historical series ‘Total Revenue by Revenue Type’
(FS-K00-01) from Chief Executives Board for Coordination (CEB),
2010-2017.
Figure 3
i) Total UN revenue data is based on CEB (FS-K00-01), 2017.
ii) Revenue data for UN operational activities for development
(UN OAD) is based on the ‘Report of the Secretary-General
(A/74/73 - E/2019/4)’, Table A-3a: ‘Contributions for operational
activities for development by contributor, type of activity.’
iii) United Nations Department of Economic and Social Aairs
(
UNDESA) uses the designation ‘United Nations development
system’ (UNDS) to identify the UN entities that undertake oper-
ational activities for development and are eligible for Official De-
velopment Assistance (ODA). This definition does not include the
following entities: International Organization for Migration (IOM),
World Trade Organization (WTO), Universal Postal Union of the
United Nations (
UNU) and International Atomic Energy Agency
(IAEA). United Nations Oce for Project Services
(UNOPS) is only partially incorporated to avoid double counting.
iv) ‘Voluntary Core’ contributions to UN non-OAD below
US$ 1 billion are not shown in Figure 3; however, they are included
in the total.
v) ‘Core’ contributions for UN-OAD, as calculated in
the Report of the Secretary-General (A/74/73-E/2019/4),
include amounts of assessed contributions that are considered ODA.

183
Figure 4
i) Nominal values.
ii) Core contributions for UN-OAD, as calculated in the Report
of the Secretary-General (A/74/73-E/2019/4), include amounts of
assessed contributions that are considered ODA.
iii) Nominal values for 2017 are based on the Report of the
Secretary-General (A/74/73-E/2019/4) - Table A-2:
‘Contributions for operational activities of United Nations system,
by UNDS entity, core and other resources: 2003-2017’. Historical
values in the series were calculated by United Nations Department
of Economic and Social Affairs (UNDESA) and were presented
in the 2018 report on Financing the UN Development System:
Opening Doors.
iv) The series depicted in this Figure and the one presented in the
latest online version of Table A-2 differ because the data reported
are continually being refined.
Figure 5
i) Nominal values.
ii) Data is based on United Nations Department of Economic and
Social Aairs (
UNDESA) expense data, as revenue is not reported
in such categories. Therefore, the percentages reflect the shares in
overall UN 2017 expenditures.
iii) UNDESA considers all activities of High Commissioner for
Refugees (UNHCR), United Nations Relief and Works Agency for
Palestine
Refugees in the Near East (UNRWA) and Office for the
Coordination of Humanitarian Affairs (UNOCHA) humanitarian,
as well as emergency operations of United Nations Children’s
Fund (UNICEF), humanitarian emergencies of United Nations
Population Fund (UNFPA) and humanitarian operations of World
Food Programme (WFP). All other operational activities are treated
as development assistance.
Figure 6
i) Nominal values.
ii) Data is based on the statistical annex of the Report of the
Secretary-General (A/74/73-E/2019/4) - Table A-3a. Historical
values in the series were calculated by United Nations Department
of Economic and Social Affairs (UNDESA) and were
presented in the 2018 report on Financing the UN Development
System: Opening Doors.
Figure 7
i) Data provided by United Nations Department of Economic and
Social Affairs (UNDESA). See also: Report of the Secretary-
General (A/74/73-E/2019/4).
ii) Growth in real terms (2000= 100%).
iii) Official Development Assistance (ODA) is defined by the
OECD Development Assistance Committee (OECD-DAC) as
government aid that promotes and specifically targets the economic
development and welfare of developing countries.
iv) Values upon which the growth rates are calculated are based on
amounts expressed in constant 2016 United States dollars by apply-
ing deflators published by OECD-DAC. These deflators consider
the combined effect of inflation and exchange rate movements.
Figure 8
i) Nominal values.
ii) Data from the Financial Tracking Service of the United Nations
Office for the Coordination of Humanitarian Affairs (UNOCHA),
https://fts.unocha.org/appeals/overview/2018
Data was downloaded in February 2019.
iii) Humanitarian response plans and flash appeals articulate how
to respond to the affected population's assessed and expressed needs
in a humanitarian emergency. They are also a management tool for
response and support decision-making by humanitarian country
teams that comprise UN agencies, NGOs and other actors. The
plans include: a country or context strategy, with strategic objectives
and indicators; and cluster plans, with objectives, activities and
accompanying projects. Together they detail how the strategy will
be implemented and how much funding is required.
iv) The percentage labels shown in each bar represent the unmet
requirements as a percentage of the total response plans and appeals
for each year.
Figure 9 and 10
i) Data from the Organisation for Economic Co-operation and
Development (OECD)
ii) Values are in constant 2016 prices.
iii) The Credit Reporting System (CRS) database presents the
International Monetary Fund (IMF) and the World Bank Group
(WBG) as separate categories. For these figures, their data has been
integrated into one category to describe a channel of multilateral
assistance.
iv) In the CRS database, the World Trade Organization (WTO) is
presented as a channel of multilateral assistance separate from the
‘UN development system’. For this figure both have been
integrated under the latter category.
Figure 11
i) Data from the Report of the Secretary-General
(A/74/73-E/2019/4), Tables A-3a and A-3b: ‘Non-core
contributions for operational activities for development by
contributor, type of non-core: 2017’
ii) The list of Organisation for Economic Co-operation and Develop-
ment’s Development Assistance Committee (
OECD-DAC) members
used was downloaded from the OECD website.
iii) Although the European Union is an OECD member, for this
figure it is considered in a separate category from the OECD-DAC
countries.
iv) The category ‘NGO, private and others’ includes private
contributions and contributions from other UN entities, IFIs, other
non-state donors.
Figures 12 to 17
i) Data from the following selected UN entities: United Nations
Development Programme (UNDP), United Nations Population
Fund (UNFPA), United Nations High Commissioner for Refugees
(UNHCR), United Nations Children's Fund (UNICEF), World
Food Programme (WFP) and World Health Organization (WHO).
ii) For UNDP, ‘Academic, training and research’ showed a negative
contribution of US$ 2.4 million because the balance of
contributions was transferred to another project/donor. This
amount has therefore been deducted from the ‘Other’ category.
Figures 18-24
i) Data from the Organisation for Economic Co-operation and
Development (OECD) statistics database.
ii) Data from the Creditor Reporting System (CRS) cover all ODA
contributions from OECD-DAC members.
iii) The categories of the different sources of ODA have been
regrouped for this report.
Figure 25 and 26
i) Data from the UN Pooled Funds Database and the Report of the
Secretary-General (A/74/73-E/2019/4), Tables A-3a and A-3b.
Notes to figures and tables

184
Notes to figures and tables
Figure 27
Funding Compact Summary 6 March, distributed by UN Develop-
ment Coordination Office (UNDCO) to Member States on 26
March 2019.
Figure 28a and 28b
i) UN Development Coordination Oce (UNDCO), ‘Data
Compendium to the Funding Compact’, (document, UNDCO,
2019). The graph has been updated with more recent United
Nations Department of Economic and Social Affairs (UNDESA)
numbers that have since become available.
ii) Data from the Report of the Secretary-General
(A/74/73-E/2019/4), Tables A-3a and A-3b and UN Pooled Funds
Database.
iii) Data presented in Figure 28a is presented as a proportion of total
contributions for development assistance, while the data in Figure 28b
reflects the level of contributions for development assistance.
Figure 29 and 30
i) Data from the CEB Financial Statistics Database,
Series FS-D02-01: ‘Agency revenue by government donor
(Voluntary Contributions, non-specified)’,
https://www.unsceb.org/content/FS-D02-01.
ii) Data does not account for any negative values (reversals)
reported by organisations.
Figure 31 and 32
i) Data from the CEB Financial Statistics database, Series
FS-D03-01: ‘Agency revenue by government donor
(Voluntary Contributions, specified)’,
https://www.unsceb.org/content/FS-D03-01.
ii) Data does not account for any negative values (reversals)
reported by organisations.
Figure 33
i) Data from the UN Pooled Funds Database and the Report of the
Secretary-General (A/74/73-E/2019/4), Table A-3a and Table A-3b.
ii) The category ‘Development assistance’ aggregates the categories
of ‘Development’, ‘Climate’, and ‘Transition’ used in the UN Pooled
Funds Database.
Figure 34 and 35
i) Data from the CEB Financial Statistics database, series
‘Agency revenue by government donor (Voluntary Contributions,
specified’ (FS-D03-01), and UN Pooled Funds Database.
ii) To obtain the ‘total earmarked contributions to the UN’ by
country, the contributions to non UNOCHA administered pooled
funds have been added to the ‘Voluntary contributions – specified’
as reported to the CEB for each country.
iii) European Union, which is part of the CEB data, is not included
since, as per CEB guidance, their data should not be appearing
under agency revenue by government donor.
iv) The percentage inside each bar represents the inter-agency
pooled fund share of the total earmarked contributions.
Figure 36
i) Data from the Report of the Secretary-General
(A/74/73-E/2019/4), Table B-2: ‘Expenditures on operational
activities for development by recipient, type of activity (develop-
ment- and humanitarian assistance-related) and type of funding
(core and non-core): 2017’.
ii) Countries were aggregated to regional level with the ‘List of
countries/territories by region’ contained in the Report of the
Secretary-General (A/74/73-E/2019/4), Table C-3.
iii) In the UNDESA data, programme support costs are often
included within the data on expenditures. These are costs of
activities of a policy-advisory, technical and implementation nature
that are needed for achievement of the objectives of programmes
and projects in the development focus areas of the organisations.
Even though these inputs are considered essential to the delivery of
development results, they may not be included in specific
programme components or projects in country, regional, or global
programme documents.
Figure 37
i) Data from the Report of the Secretary-General (A/74/73-E/2019/4),
Table B-2 and World Development Indicators.
ii) As of 1 July 2017, low-income economies were defined as those
with a gross national income (GNI) per capita of US$ 1,005 or less;
lower middle-income economies are those with a GNI per capita
between US$ 1,006 and US$ 3,955; upper middle-income
economies are those between US$ 3,956 and US$ 12,235; high-
income economies are those with a GNI per capita of US$ 12,236
or more. (World Bank GNI per capita Operational Guidelines &
Analytical Classifications).
iii) ‘Crisis-affected countries’ must be in the DAC list of ODA
recipients. The latter list shows all countries and territories eligible
to receive ODA. These consist of all low and middle-income
countries as published by the World Bank [except for G8 members,
EU members, and countries with a firm date for entry into the
EU], and all of the Least Developed Countries (LDCs) as defined
by the UN.
iv) Crisis-affected countries are countries in the DAC list of ODA
that fulfil one or more of the following criteria:
a) report expenditure for an ongoing or recently discontinued
peacekeeping mission;
b) report expenditure for an ongoing or recently discontinued
political mission, group of experts, panel, office of special envoy or
special adviser;
c) report expenditure from the Peacebuilding Fund higher than
US$ 500,000; and/or
d) have had a humanitarian response plan for the two past years,
ie 2016 and 2017.
v) The 50 crisis-affected countries are drawn from different income
groups.
Figure 38
i) The data for this figure has diverse sources: Report of the Secretary-
General (A/74/73-E/2019/4), Table B-2, UN Pooled Funds
Database, Department for Peacekeeping Operations (DPKO) and
Department for Political Aairs (DPA).
ii) DPKO’s financial year starts in July and ends in June.
The 2017 data is based on July 2017- June 2018 data: United
Nations General Assembly, ‘Financial report and audited financial
statements for the 12 month period from 1 July 2017 to 30 June
2018 and Report of the Board of Auditors Volume II’
https://undocs.org/en/A/73/5%20(Vol.%20II) page 172,
Table V: ‘Statement of comparison of budget and actual amounts
for the year ended 30 June 2018’.
iii) The source of DPA data is United Nations Secretary-General,
‘Estimates in respect of special political missions, good offices and
other political initiatives authorized by the General Assembly
and/or the Security Council’, (Report of the Secretary-General,
A/72/371, United Nations General Assembly, 16 October 2017)
http://www.un.org/ga/search/view_doc.asp?symbol=A/72/371
page 27, Table 4: ‘Summary of significant variances between the
2016–2017 appropriation and projected expenditures for missions
continuing into 2018’.

185
iv) The figure does not display countries with less than US$ 100
million in expenditure.
v) The countries that are in the crisis-affected list but are not
depicted in the figure are: Guatemala, Philippines, Burkina Faso,
Guinea, Democratic People’s Republic of Korea, Mauritania,
Sri Lanka, Kyrgyzstan, Western Sahara, Tajikistan, Papua
New Guinea, Djibouti, Kosovo, Eritrea, Gambia and Solomon
Islands.
vi) Expenditure data from United Nations University (UNU),
World Trade Organization (WTO), International Organization for
Migration (IOM) and International Atomic Energy Agency (IAEA)
are excluded given that the data contains information only from
entities which fall under the United Nations Department of
Economic and Social Affairs (UNDESA) definition for UN
operational activities for development.
vii) Expenditures of the following UNDS entities are not included
in this data since they do not report disaggregated country
expenditures: International Civil Aviation Organization (ICAO),
International Fund for Agricultural Development (IFAD), Interna-
tional Maritime Organization (IMO), International Trade Cen-
ter (ITC), International Telecommunication Union (ITU), Pan
American Health Organization (PAHO), United Nations Depart-
ment of Economic and Social Affairs (UNDESA), United Nations
Environmental Programme (UNEP), United Nations Educational,
Scientific and Cultural Organization (UNESCO), United Nation
Framework Convention on Climate Change (UNFCCC), the UN
Office for Disaster Risk Reduction (UNISDR), United Nations
Office for Drugs and Crime (UNODC), United Nations Research
Institute for Social Development (UNRISD), United Nations
System Staff College (UNSSC), United Nations University (UNU),
United Nations World Tourism Organization (UNWTO), Universal
Postal Union of the United Nations (UPU), World Intellectual
Property Organization (WIPO), World Meteorological Organiza-
tion (WMO), and the five regional commissions: United Nations
Economic Commission for Africa (UNECA), United Nations
Economic Commission for Europe (UNECE), United Nations
Economic Commission for Latin America and the Caribbean
(ECLAC), The Economic and Social Commission for Asia and the
Pacific (ESCAP), and United Nations Economic and Social Com-
mission for Western Asia (ESCWA).
viii) The African Union-United Nations Hybrid Operation in
Darfur (UNAMID) expenditure was allocated to Sudan.
The United Nations Disengagement Observer Force (UNDOF)
expenditure was allocated equally to Syria and Israel [Israel is not
included in the ‘crisis-affected countries’ because it is not in the
DAC list of ODA recipients]. The United Nations Organization
Interim Security Force for Abyei (UNISFA) expenditure is
allocated equally to South Sudan and Sudan.
Figure 40
Sources:
CEB 2017 Financial Data; Total Revenue type by entity: Assessed
(R01), Voluntary (R02, R03, R03a), and Other (R04).
CEB 2017 Financial Data; Total Revenue type by entity (R01),
Donor Revenue type by entity (R01).
UN Pooled Funds Database 2017.
CEB 2017 Financial Data; Total Revenue type by entity:
Revenue from UN organisations excluding inter-agency pooled
funds (R10).
Selected 2017 Audited Financial Statements, publicly available
online; Department for Peacekeeping Operations (DPKO);
International Organization for Migration (IOM);
Pan American Health Organization (PAHO); UN;
United Nations
Development Programme (UNDP)
; United Nations Educational,
Scientic and Cultural Organization (UNESCO); United Nations
Population Fund (UNFPA); United Nations Children’s Fund
(UNICEF); United Nations Oce for Project Services (UN-
OPS); United Nations Relief and Works Agency for Palestine
Refugees in the Near East (UNRWA); United Nations University
(UNU); World Food Programme (WFP); World Health Organization
(WHO);
and World Intellectual Property Organization (WIPO)
jointly account for 93% of revenue in Other (R04).
Notes to figures and tables

186
Tables
Table 2a
i) Data in nominal values, expressed in US$ million.
The amounts have been rounded up and those below
US$ 1 million are shown as 0 in the table (ie, values for United Na-
tions Institute for Training and Research (
UNITAR), United Nations
Research Institute for Social Development (
UNRISD) and United
Nations System Sta College (
UNSSC)). However, the total reflects
the sum of the total revenue of all individual UN entities.
ii) Data from the CEB, series (FS-A00-02), 2017.
https://www.unsceb.org/content/FS-A00-02
Table 2b
i) Data in nominal values expressed in US$ million.
ii) Data from thwe following selected UN entities: United Nations
Development Programme (UNDP), United Nations Population
Fund (UNFPA), United Nations High Commissioner for Refugees
(UNHCR), United Nations Children's Fund (UNICEF), United
Nations Relief and Works Agency for Palestinian Refugees in the
Near East (UNRWA), World Food Programme, (WFP) and World
Health Organization (WHO).
Table 3
i) Data in nominal values expressed in US$ million.
ii) Data source for 2010-2017 is CEB, series ‘Revenue Type by
Agency’ (FS-A00-02).
iii) Department for Peacekeeping Operations (DPKO) data prior to
2010 is expenditure figures, used as proxy for revenue data. DPKO
data for 2005 is from General Assembly, ‘Financial report and audit
financial statement for the 12-month period from 1 July 2004 to
30 June 2005’,
(Report of the General Assembly, A/60/5, 10 March 2006).
http://undocs.org/en/A/60/5(VOL.II)(SUPP). For 1975 to 2000,
DPKO data is based on Michael Renner, Peacekeeping Operations
Expenditures: 1947-2005 (Table, Global Policy Forum),
https://www.globalpolicy.org/component/content/article/133-ta-
bles-and-charts/27448-peacekeeping-operations-expenditures.html.
iv) Additional source for assessed contributions to UN specialised
agencies, 1971-2013 (not DPKO),
https://www.globalpolicy.org/component/content/article/133-ta-
bles-and-charts/27480-assessed-contributions-to-un-special-
ized-agencies.html.
Table 4
i) Data in nominal values expressed in US$ million.
ii) Data for 2010-2017 is from CEB, series (FS-A00-02).
Table 5
i) Data from the Organisation for Economic Co-operation and
Development (OECD).
ii) Values expressed in constant 2016 prices.
Table 6
i) Data in nominal values expressed in US$ million.
ii) Data for the period 2010-2017 is from the CEB, series
‘Total Expenditure by Agency’ (FS-F00-03),
https://www.unsceb.org/content/FS-F00-03.
iii) DPKO data for 2005 is from the Report of the General
Assembly, A/60/5, 10 March 2006.

Dag Hammarskjöld Foundation
The Dag Hammarskjöld Foundation is a non-governmental organisation
established in memory of the second Secretary-General of the United Nations.
The Foundation aims to advance dialogue and policy for sustainable development,
multilateralism and peace. ace.
www.daghammarskjold.se
Multi-Partner Trust Fund Office
The Multi-Partner Trust Fund Oce is the UN centre of expertise on pooled
nancing mechanisms. Hosted by UNDP, it provides fund design and fund
administration services to the UN system, national governments and
non-governmental partners. The MPTF Oce operates in over 110 countries and
manages a total portfolio of US$ 12 billion in pooled funds, involving more than
150 contributors and over 85 participating organisations.
mptf.undp.org
United Nations
MPTF Oce
This is a report about hard choices ahead of us. Choices that governments, leaders,
investors and citizens need to make about when and how to fund a multilateral
approach to address today’s most stubborn and urgent global development challenges
– climate change, health, migration, armed conflict and inequality. The case for a
multilateral approach needs to be based on evidence that shows effectiveness and
impact in addressing these challenges.
The overall ambition of this fifth annual report,
Financing the United Nations
Development System, is to advance the quality of this evidence-based debate and to
expand the marketplace of ideas related to the United Nations and development
financing. It showcases the complex funding dynamics of the UN development system
and its role in spurring greater and more diverse financing flows for the 2030 Agenda.
With a firm platform of data and a strong portfolio of ideas presented in this report,
we hope that when hard decisions are made – bilateral, multilateral or other – they
will deliver on our shared goals.
